one last dancegm.
you finally woke up and ethereum was soaring.
you saw the bounce. the reclaim. the headlines.
you convinced yourself the bottom was in.
you drew trendlines, watched influencers say “we’re so back.”
you wanted to believe.
and that’s exactly what wave B needed.
because this wasn't a breakout.
it’s a reset.
a psychological rinse,
engineered to bait late longs and build fuel for the final l i q u i d a t i o n.
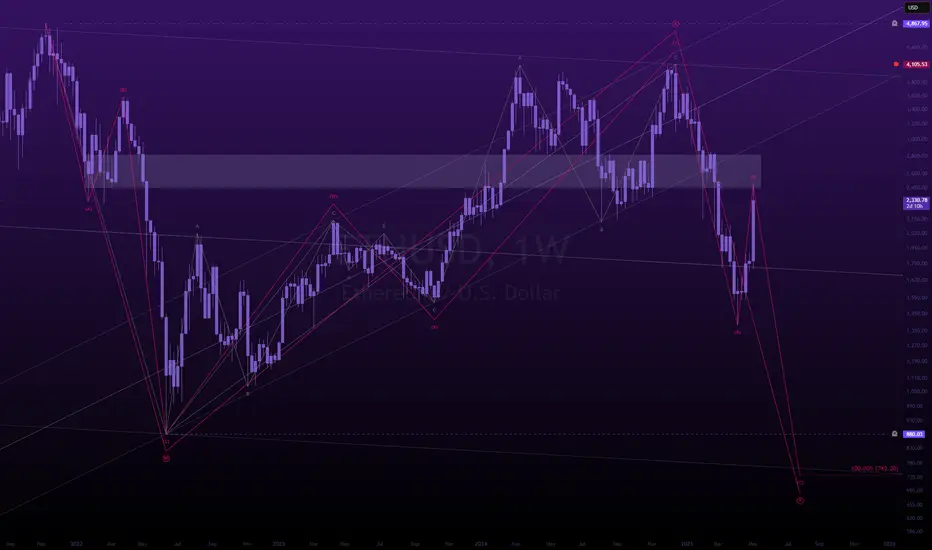
this is the macro (W)-(X)-(Y).
not hopium, not dreams structure.
wave A brought devastation.
wave B brought complacency
wave C brings the execution.
make no mistake:
we’re not going up,
we’re being set up.
the chart says $742.
you call it impossible.
but the market doesn’t care what you believe.
the market only exists to find the maximum pain,
your maximum pain.
eth to $700 is not a prediction.
it’s a scheduled event.
and you’re RSVP’d unless you wake up.
wave C of wave (Y) is coming.
and it doesn’t care how bullish you feel.
---
Ethereum (Cryptocurrency)
ETHUSD INTRADAY bullish breakout supported at 2,190The ETH/USD pair maintains a bullish overall sentiment, underpinned by a sustained upward trend.
Key Levels:
Support: 2,190 (primary), followed by 2,123 and 2,046
Resistance: 2,625, with extended targets at 2,725 and 2,850
A corrective dip toward the key support zone at 2,190 could offer a bullish rebound opportunity. A successful bounce from this level would reinforce the uptrend and pave the way for a test of the 2,625 resistance. A breakout above this level may open the door to further gains toward 2,725 and 2,850 over the longer term.
Conversely, a decisive break and daily close below 2,190 would invalidate the bullish setup, potentially triggering a deeper pullback toward the 2,123 and 2,046 support levels.
Conclusion:
While the broader trend remains bullish, ETH/USD is currently consolidating. Traders should watch the 2,190 support closely—its defence may confirm trend continuation, while a breakdown could signal a short-term bearish reversal.
This communication is for informational purposes only and should not be viewed as any form of recommendation as to a particular course of action or as investment advice. It is not intended as an offer or solicitation for the purchase or sale of any financial instrument or as an official confirmation of any transaction. Opinions, estimates and assumptions expressed herein are made as of the date of this communication and are subject to change without notice. This communication has been prepared based upon information, including market prices, data and other information, believed to be reliable; however, Trade Nation does not warrant its completeness or accuracy. All market prices and market data contained in or attached to this communication are indicative and subject to change without notice.

After a 37% Surge, Is Ethereum Still a Buy...?Ethereum Breaks Key Resistance, Signaling Potential Trend Reversal
Ethereum has delivered two significant technical signals indicating a potential trend reversal. The first is a breakout above the longstanding downtrend line, and the second is the breach of the critical \$2,100 resistance level. These developments suggest growing bullish momentum in the market.
With both confirmation signals in place, Ethereum appears poised for further upside. Traders may now look for a potential pullback or retest around the \$2,100 level, which could serve as a strategic entry point for long positions.
If this level holds as new support, the next target to watch is the \$2,800 mark, aligning with broader market expectations and previous price structure zones.
As always, traders should monitor price action closely and manage risk accordingly in case of volatility around key levels.

BTC – One last pushmarket context and structure
This BTCUSDT 4-hour chart from BYBIT provides a broader perspective on BTC’s ongoing uptrend, emphasizing the role of fair value gaps in guiding price behavior. After a prolonged period of sideways action and consolidation, BTC initiates a sharp bullish impulse that breaks previous structure and introduces fresh momentum into the market. Each leg higher is followed by a corrective phase, during which multiple fair value gaps (FVGs) are formed. These FVGs serve as structural inefficiencies left by aggressive buying pressure and outline key zones of interest for future price interaction.
fair value gaps and institutional demand
The chart identifies three key FVGs that have influenced BTC’s price action. The lowest FVG, created during the initial breakout below the 89,000 zone, is the origin of this current bullish leg and reflects strong institutional involvement. The mid-level FVG, created as BTC pushed through the 94,000–96,000 region, marks another significant shift in order flow. The most recent FVG, created just prior to the most recent impulse, lies just beneath the 98,000 level and represents a more immediate zone of demand. Price is currently trading above this uppermost FVG, indicating that it may act as a reaccumulation zone if price retraces.
liquidity dynamics and continuation thesis
The projection drawn on the chart suggests a short-term retracement back into the upper FVG before a potential continuation higher. This idea is rooted in the expectation that institutional participants will revisit unfilled orders left within the FVG before driving price upward toward new liquidity pools. The light blue shaded zone indicates the potential target range for this continuation. The market has consistently respected prior FVGs, confirming their role as reliable demand zones and reinforcing the current bullish bias.
price behavior and structural clarity
BTC’s price action on this timeframe is characterized by impulse–correction cycles with clearly defined inefficiencies. Each impulse leaves behind an FVG, which is either fully or partially mitigated during pullbacks. The most recent bullish leg has created an unmitigated FVG directly beneath current price, suggesting that if a retracement occurs, it is likely to interact with this gap before continuing the upward trajectory. This behavioral pattern of clean imbalances followed by targeted mitigation is a strong indicator of organized institutional involvement in the market.
interpretation and tactical insight
The chart outlines a strategic approach to navigating BTC’s current bullish structure. Rather than entering impulsively, the analysis encourages waiting for price to retrace into identified imbalance zones where the probability of sustained movement is higher. Fair value gaps provide a roadmap for understanding where price is likely to react and continue. In this case, if BTC revisits the nearest FVG and holds that level, it sets the stage for continuation toward the 101,000–102,000 zone, in line with the drawn projection. The setup remains aligned with smart money trading methodology, where price is guided by liquidity and imbalance mechanics.

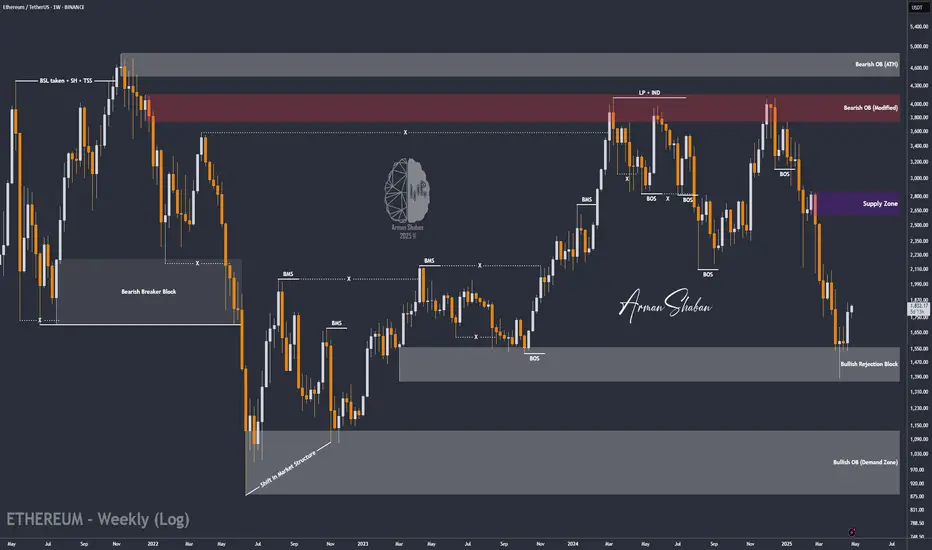
ETH/USDT : Bulls are coming back? (READ THE CAPTION)By analyzing the #Ethereum chart on the weekly (logarithmic) timeframe, we can see that after reaching the demand zone between $1400 and $1550, buying pressure increased significantly. Currently, Ethereum is trading around $1800, and I expect to see the next bullish wave soon. The potential upside targets are $1990, $2500, and $2600. This analysis will be updated accordingly!
Please support me with your likes and comments to motivate me to share more analysis with you and share your opinion about the possible trend of this chart with me !
Best Regards , Arman Shaban
TON/USDT : The Next Bullish Rally Ahead? (READ THE CAPTION)By analyzing the #Toncoin chart on the 3-day timeframe, we can see that the price is currently trading around $3.00, which is approximately 60% below its all-time high of $8.20. If Toncoin can hold above the $2.80 level, we may expect further bullish momentum in the mid-term.
The next potential upside targets are $3.39, $3.64, $4.20, and $4.66.
Please support me with your likes and comments to motivate me to share more analysis with you and share your opinion about the possible trend of this chart with me !
Best Regards , Arman Shaban

BTC/USD: The Bull Run Isn’t Over yet! (READ THE CAPTION)By analyzing the #Bitcoin chart on the weekly timeframe, we can see that price has finally started rising as expected and has hit all our targets, breaking above $100,000. Bitcoin is currently trading around $103,000, and now we must wait to see if it gets rejected from this level. If there's no rejection and price breaks and holds above $110,000, we could expect higher targets around $130,000 and even $163,000 in the coming weeks. So far, this analysis has delivered over 39% return!
The Previous Analysis :
Please support me with your likes and comments to motivate me to share more analysis with you and share your opinion about the possible trend of this chart with me !
Best Regards , Arman Shaban

BTC/USD: Get Ready for another Bullrun ! (READ THE CAPTION)By analyzing the #Bitcoin chart on the weekly timeframe, we can see that the price is currently trading around $95,000. Soon, we should expect Bitcoin to enter the key supply zone between $99,500 and $109,500, where we’ll closely watch for the market's reaction.
Bitcoin continues to show strong demand, and we may witness another bullish spike in the short term. All previous assumptions from the last analysis remain valid.
Please support me with your likes and comments to motivate me to share more analysis with you and share your opinion about the possible trend of this chart with me !
Best Regards , Arman Shaban

DeGRAM | ETHUSD keeping the demand zone📊 Technical Analysis
● ETH printed a higher low at the green $1 750‑1 900 demand zone and is now moving along the support line.
● A close above minor trend resistance at $1 900 should trigger a run toward $2 100; downside risk contained at $1 650.
💡 Fundamental Analysis
● SEC cleared options trading on spot‑ETH ETFs, and analysts see staking approval as early as May—fresh catalysts for institutional inflows.
✨ Summary
Trend‑break plus ETF momentum backs a short‑term long stance: targets $1 900 → $2 100; invalidate below $1 700.
-------------------
Share your opinion in the comments and support the idea with like. Thanks for your support!

The Illusion of Value: How the U.S. Market Became a Fantasy EconThe Illusion of Value: How the U.S. Market Became a Fantasy Economy
For decades, the American economy has been celebrated as the epicenter of innovation, wealth creation, and corporate success. But beneath the surface, an unsettling reality has emerged: The U.S. financial markets are increasingly driven by speculation, hype, and a distorted sense of value.
"Buy Now, Pay Later"—A Culture of Delusion
One of the most glaring symptoms of this detachment from reality is the widespread adoption of "Buy Now, Pay Later" (BNPL) services. A staggering number of American consumers have embraced debt-financed spending as a normal part of life. Credit cards are no longer the primary vehicle for financial mismanagement—BNPL systems have convinced people they can afford luxuries they fundamentally cannot.
This mentality, in turn, feeds into the stock market’s obsession with future promises over actual output. Investors have become infatuated with narratives rather than numbers, driving valuations to unrealistic highs for companies that either underdeliver or simply do nothing at all.
The MicroStrategy Paradox: Borrowing Money to Buy Bitcoin
Take MicroStrategy, for example—a company whose sole business model seems to be leveraging borrowed capital to buy Bitcoin. By traditional metrics, MicroStrategy offers no tangible product, no innovative service, no groundbreaking technology—just speculative accumulation. Yet, thanks to Bitcoin hype, its stock price is valued as if it’s a revolutionary player in the corporate world.
This irrational valuation mirrors the broader issue with American markets: Companies are being rewarded not for what they actually do, but for the financial games they play.
The Myth of Overvalued Titans: Tesla & Meta
Tesla and Meta serve as the poster children of speculative overvaluation.
- Tesla: Once hailed as an automotive disruptor, Tesla’s stock price often reflects what Elon Musk promises rather than what Tesla delivers. From self-driving software that never fully materialized to mass production goals that fell flat, Tesla’s ability to sustain its valuation relies more on Musk’s cult-like following than automotive success. Meanwhile, the gutting of regulatory oversight has allowed Tesla to push unfinished, potentially hazardous products into the market.
- Meta: Meta’s valuation has ballooned largely on the promise of virtual reality dominance. Yet, billions poured into the Metaverse have yielded little beyond overpriced VR headsets and gimmicky social spaces.
Elon Musk: The Master of Market Manipulation
Elon Musk’s influence on financial markets cannot be overstated. Through cryptic tweets, grand promises, and regulatory maneuvering, Musk has become a force powerful enough to shift markets with mere words. Whether it’s pumping Dogecoin, slashing Tesla’s safety oversight, or influencing government policy for personal gain, Musk operates in a reality where market value is dictated by his persona rather than corporate fundamentals.
The Rise of True Value Markets
While the U.S. economy indulges in financial fantasy, other global markets have started to present compelling opportunities:
- Europe: A more realistic, fundamentals-based approach to valuation is emerging. Traditional industries remain resilient, and companies must show actual profitability to attract investment.
- China: Despite regulatory challenges, China’s focus on industrial production, technological advancement, and infrastructure development gives its economy a sense of tangible progress.
- UK & Australia: Unlike the speculative U.S. markets, these economies remain grounded in earnings, productivity, and rational valuations.
Conclusion
The American financial landscape has become a speculative playground detached from reality. Companies are valued not for what they produce, but for what they promise, what they borrow, and what narratives they spin. Figures like Musk exploit market sentiment, while deregulation enables corporations to operate recklessly. As Europe, China, the UK, and Australia foster economies built on real value, the U.S. is at risk of crashing under the weight of its illusions.
SP:SPX TVC:DXY INDEX:BTCUSD TVC:GOLD NASDAQ:MSTR NASDAQ:TSLA NYSE:BLK NASDAQ:META XETR:DAX FTSE:UKX TVC:HSI SET:SQ NASDAQ:PYPL NASDAQ:AFRM NASDAQ:AAPL NASDAQ:AMZN NASDAQ:NVDA NASDAQ:COIN NASDAQ:HOOD

Ethereum: Correction to $1,300–$1,500 and Rise to $2,500–$2,800#Ethereum Price Analysis: Correction to $1,300–$1,500 Before Potential Rise to $2,500–$2,800
Let’s break down why Ethereum (ETH) might correct to the $1,300–$1,500 range and then potentially rise to $2,500–$2,800 (with increased risk beyond that).
Technical Analysis
On the ETH/USDC 5-day timeframe chart from Coinbase, key points confirm a correction to $1,300–$1,500:
1. Correction Target: $1,300–$1,500 ("Coinbase orders")
• Limit orders were placed on Coinbase before the drop.
2. Hyperliquid Liquidation Map
• According to the Hyperliquid Liquidation Map, the liquidation level for long traders is at $1,337.00, within the target zone of $1,300–$1,500.
• A price drop to this level could trigger a cascade of liquidations, and market makers might accumulate positions at the lowest prices, specifically in the liquidation area.
3. Elliott Waves
• We’re completing the 5th wave and starting to form a reversal. This event will roughly coincide with the S&P 500’s reversal.
What Event Could Trigger the Correction?
• An expected Bitcoin correction to $70,000–$76,000 could trigger Ethereum’s drop, as the altcoin market historically follows BTC.
• I’ve previously shared this Bitcoin idea; we’re waiting for it.
Potential Targets for Ethereum Before a Global Downturn
Look for an exit point in this area: $2,500.00–$2,800.00
➖ This is approximately the 61.8% Fibonacci level
➖ A significant area according to the Volume Profile
➖ Large sell orders on Binance at $2,500, $2,800, and $3,000
➖ On Coinbase, they’re getting smarter and splitting orders into 500–600 ETH.
➡️ In Summary for Ethereum
This makes the $1,300–$1,500 range attractive for buying the dip.

ETHUSDT Daily : READY For Ethereum ATH Hi guys ,
So let's see if Ethereum finally gets its turn. The chart has heavy nodes for growth but I think we could see Ethereum at $4,000 again.
SecondChanceCrypto
⏰ 9/May/26
⛔️DYOR

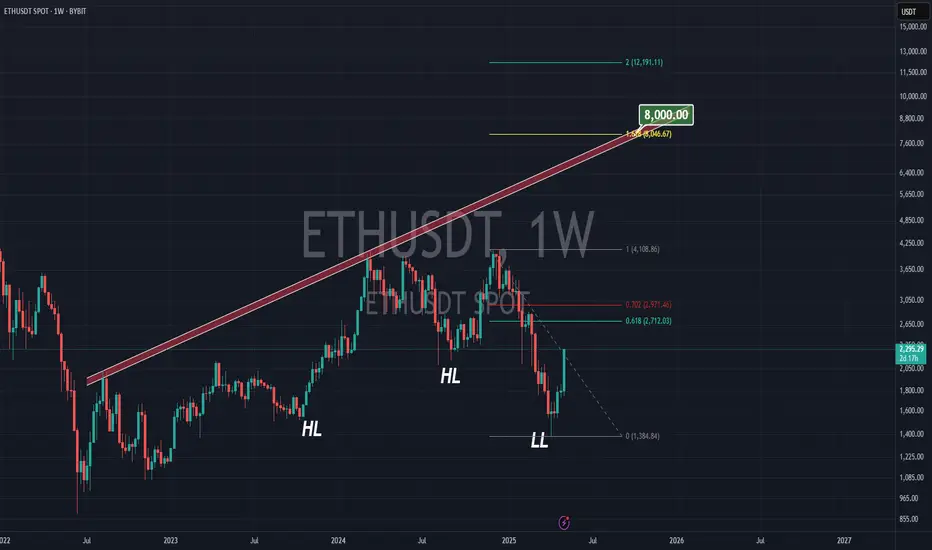
ETHEREUM TO $8000According to the previous tops we have for Ethereum on big time frames, we have a strong & long-term trend-line which gives us $7000 in summer and $8000 in October time.
On the other hand the 161.8% Fibonacci from the previous top the bottom we just saw (about $1500 ) is at $8000 .
Is this a coincident?! I don't think so
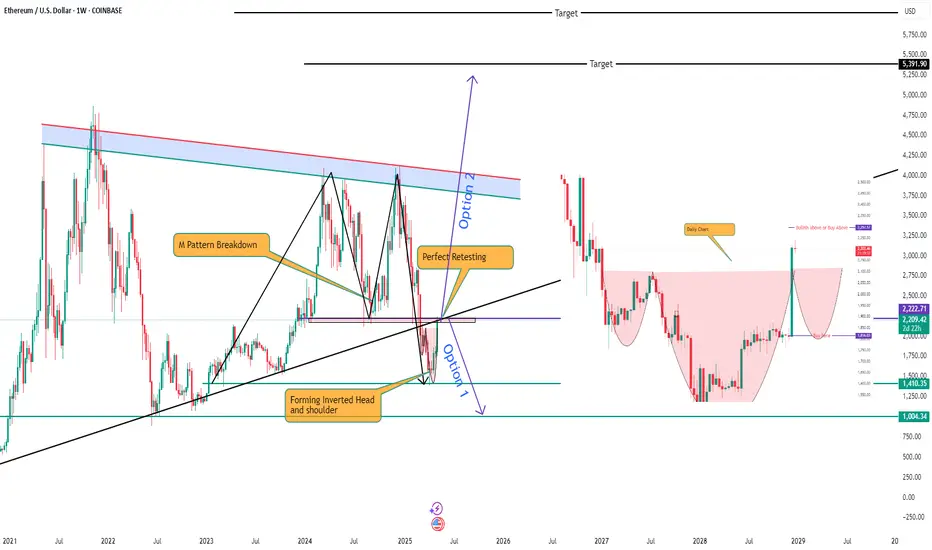
Ethereum - Perfect exactly how I thoughtEthereum
Stage 1 - Triangle Pattern - Gave perfect breakdown of triangle pattern
Stage 2 - Form M Pattern - Have almost completed the selling target
Stage 3 - Retesting completed *Current)
Stage 4 - Forming inverse cup and handle and inverted head and shoulder pattern
Stage 5- in either of the scenario it may come down but if it goes above 2297 expect it to reach 4000/500/7000 in coming days
Stage 5.2 - if the retesting is completed and bearish patter is continued expect it to reach to 900 USD
For more details ping me
GK Trade manthan
Ethereum Bear Market Over! $10,000 Before 2026 Confirmed!People were badmouthing Ethereum but look what is happening, more than 20% growth in a single day. Awesome right? But this is only the start, the last high will be reached and conquered easily, that I know for certain for sure it is true just watch.
In a previous analysis I mentioned that ETHUSDT was trading within a tight range support buy-zone, marked blue on this chart. This is also a higher low and consolidation was happening before what happened today. Bullish action confirmed. Real bullish action I should say because this action is coupled with really high volume. Confirming a very strong high in the coming weeks and days.
Here is what will happen, Ethereum will grow daily non-stop for months. Now, saying it (reading it) is one thing, experiencing will be something completely different, the market will become euphoric as everything grows.
Hundreds of billions worth of USD will be injected into the market, we already have 30 billions that came in recently but only some 10-15 billions are already in-play. This means that the whales still have 15 billion USD ready to buy, and they will continue to buy long-term. As this capital dries up, more and more players will get involved. Notice how the sentiment is still low. People know we are bullish but that is only the usual market participants, those that are part of the industry, the rest, the mass, they are not in yet. When the masses wake up, that will be very close to the top of the first bullish wave. 250 B$ coming in will change not only the Cryptocurrency market forever but also the global financial landscape.
Ethereum breaking bullish is just step one, there is more to come. Prepare for Ethereum to trade at around $10,000 before this year ends. Would you like to bet? I don't think so, we already won because we've been bullish since before 7-April, now it is time to enjoy the ride nothing more.
Adapt and change. The market always fluctuates from bullish to bearish, from bearish to sideways, from sideways to bullish and bullish the market will stay long-term.
Thank you for reading.
"Buy like it's the end of the world. —Master Ananda"
You can't go wrong when prices are low.
Thanks a lot for your continued support.
Namaste.

$ETH 20% Move With 20/50DMA CrossoverHOLY MOLY!
Over 20% gain for CRYPTOCAP:ETH on the day
20DMA making a bullish crossover the 50.
Next target at the .382 Fib ~$2400
Did Pectra actually work?
And is Ethereum back from the dead !?

ETHUSDT - Will likely have 5 Digits by the end of 2025Ethereum has dropped 65% since December, hitting its bottom in April —
that’s 5 full months in a bear market with a massive drawdown, especially for the second-largest crypto by market cap.
Today, it made a strong bounce, rallying over 50% from the grey support zone,
confirming that the bottom was likely in.
Looking at the RSI, Ethereum has entered the oversold zone only 3 times in the last 5 years —
which is another strong indication that a bottom has been reached.
So what can we expect from ETH in the coming days?
- Ethereum is still close to the bottom, and RSI conditions remain healthy.
- Historically, the current RSI level has only occurred three times in five years.
Based on this:
- This bounce is likely just the beginning of a much bigger move. ETH still has a lot of upside potential.
- The next key resistance is around $2,500, which lines up with both the 200 EMA and the 0.618 Fibonacci level — keep an eye on that.
- Long-term, Ethereum is on track for a new all-time high (ATH).

Ether-Bitcoin Ratio Signals ETH Is 'Extremely Undervalued,' The cryptocurrency market is a realm of intricate signals, complex metrics, and often-conflicting narratives. Among the myriad indicators traders and investors scrutinize, the Ether-Bitcoin (ETH/BTC) ratio holds a prominent place. This metric, a simple division of Ethereum’s price by Bitcoin’s price, serves as a barometer for the relative strength and market sentiment between the two leading crypto assets. Recently, this ratio has dipped to levels that historically signaled significant undervaluation for Ether, sparking debate about a potential upcoming rally. However, a confluence of factors – notably surging ETH supply, stagnant network demand, and a weakened token burn mechanism – casts a considerable shadow over this optimistic outlook, suggesting that past performance may not be a reliable guide in the current, uniquely challenging environment.
Understanding the ETH/BTC Ratio: A Barometer of Relative Strength
At its core, the ETH/BTC ratio reflects the market's perception of Ethereum's value proposition relative to Bitcoin. When the ratio trends upwards, it indicates that ETH is outperforming BTC, suggesting growing investor confidence in Ethereum's ecosystem, technological advancements, or utility. Conversely, a declining ratio signifies BTC's relative strength, potentially due to factors like "digital gold" narratives, safe-haven appeal, or specific Bitcoin-centric catalysts.
A low ETH/BTC ratio, such as those observed in recent times, is often interpreted by analysts as a sign that ETH is "cheap" or "undervalued" compared to Bitcoin. The logic is that, over time, capital flows within the crypto market tend to seek out assets with stronger growth potential or those perceived as lagging behind their fundamental value. If ETH is indeed undervalued, the expectation is that it will eventually catch up, leading to a rally in both its USD price and its value relative to BTC. This potential for "mean reversion" or a "catch-up trade" is what excites many market participants when the ratio hits historical lows.
Historical Precedents: When Undervaluation Sparked Rallies
The argument for an impending ETH rally based on the current low ETH/BTC ratio is not without historical merit. There have been several instances where a depressed ratio preceded substantial upward movements for Ether.
1. Post-2018 Crypto Winter: After the ICO boom and subsequent crash, the ETH/BTC ratio languished for an extended period. However, as the DeFi (Decentralized Finance) ecosystem began to gain traction in 2020 ("DeFi Summer"), ETH, as the foundational layer for most DeFi protocols, experienced a resurgence. The ratio climbed significantly as capital flowed into Ethereum to participate in yield farming, lending, and decentralized exchange activities.
2. The NFT Boom (2021): The explosion of Non-Fungible Tokens (NFTs) in early 2021, predominantly on the Ethereum blockchain, provided another major catalyst. The increased demand for ETH to mint, buy, and sell NFTs pushed its price and the ETH/BTC ratio upwards, as Ethereum's utility as a platform for digital collectibles and art became undeniable.
3. Anticipation of The Merge (2021-2022): As Ethereum moved closer to its pivotal transition from Proof-of-Work (PoW) to Proof-of-Stake (PoS) – "The Merge" – market sentiment turned increasingly bullish. The promise of significantly reduced energy consumption, coupled with the "ultrasound money" narrative (where ETH issuance would drastically decrease and potentially become deflationary due to EIP-1559's burn mechanism), fueled strong buying pressure. The ETH/BTC ratio saw notable gains during periods of heightened Merge anticipation.
In these instances, the low ETH/BTC ratio acted as a tinderbox, and specific fundamental catalysts served as the spark that ignited significant rallies. Investors who recognized the undervaluation signal and anticipated these catalysts were handsomely rewarded. This historical pattern underpins the current optimism among some analysts who see the present low ratio as a similar buying opportunity.
The Complicating Factors: Why This Time Might Be Different
Despite the compelling historical precedents, the current market environment for Ethereum presents a unique set of challenges that complicate the simple "undervalued, therefore rally" thesis. These headwinds stem from fundamental shifts in Ethereum's tokenomics and network dynamics.
1. Surging Supply: The Post-Merge Issuance Reality
While The Merge successfully transitioned Ethereum to a more environmentally friendly PoS consensus mechanism, its impact on ETH supply has been more nuanced than initially portrayed by some bullish narratives.
• Staking Rewards: Under PoS, new ETH is issued as rewards to validators who stake their ETH to secure the network. While the rate of new ETH issuance is significantly lower than it was under PoW, it is still a consistent inflationary pressure. The annual inflation rate from staking rewards is currently in the low single digits.
• Net Issuance vs. Deflation: The "ultrasound money" thesis largely depended on the EIP-1559 burn mechanism (discussed later) consistently burning more ETH than is issued through staking rewards, leading to a net deflationary supply. However, this has not always been the case post-Merge. There have been extended periods where ETH has been net inflationary.
• Unstaking and Liquid Staking Derivatives: The ability for validators to unstake their ETH (enabled by the Shanghai/Capella upgrade) means that previously locked supply can re-enter the market. Furthermore, the proliferation of Liquid Staking Derivatives (LSDs) like Lido's stETH or Rocket Pool's rETH, while enhancing capital efficiency, also means that staked ETH is not entirely removed from liquid circulation, as these derivative tokens can be traded or used in DeFi.
This consistent, albeit reduced, issuance contributes to sell pressure, especially if demand does not keep pace. The narrative of ETH becoming a deflationary asset has been weakened, impacting one of the key bullish arguments that previously supported a higher ETH/BTC ratio.
2. Flat Demand: A Stagnant Network Picture
For ETH's price to appreciate significantly, there needs to be robust demand for the token, driven by network usage and adoption. Currently, several indicators suggest that demand is, at best, flat, and in some areas, declining.
• Network Activity Metrics: Key on-chain metrics such as daily active addresses, transaction counts, and total gas consumed have shown periods of stagnation or even decline. While Layer 2 scaling solutions are processing more transactions, this activity doesn't always translate directly into proportional demand for ETH on the mainnet, especially if Layer 2s manage their own fee markets efficiently.
• Total Value Locked (TVL) in DeFi: While DeFi remains a cornerstone of Ethereum's value proposition, the growth in TVL has slowed considerably compared to the explosive growth seen in 2020-2021. Capital inflows into DeFi protocols on Ethereum have been less aggressive, partly due to macroeconomic conditions, regulatory concerns, and the emergence of competitive DeFi ecosystems on other blockchains.
• Competition from Alternative Layer 1s and Layer 2s: Ethereum faces increasing competition from other Layer 1 blockchains (e.g., Solana, Avalanche, Aptos, Sui) that offer higher throughput and lower transaction fees, attracting users and developers. Moreover, Ethereum's own Layer 2 ecosystem (e.g., Arbitrum, Optimism, Polygon zkEVM, Starknet, zkSync Era), while crucial for its long-term scalability, also fragments user activity and can, in some ways, reduce direct demand pressure on ETH for L1 transactions if users primarily operate within these L2 environments.
• Macroeconomic Headwinds & Regulatory Uncertainty: Broader economic conditions, including inflation, interest rate hikes, and recession fears, have generally dampened risk appetite across financial markets, including crypto. Additionally, the ongoing regulatory uncertainty in key jurisdictions like the United States creates an environment of caution, potentially hindering institutional adoption and large-scale investment in assets like ETH.
• NFT Market Cool-Down: The NFT market, which was a significant driver of ETH demand, has experienced a substantial cool-down from its peak in 2021-2022. While innovation continues, transaction volumes and average sale prices have fallen, reducing the ETH velocity associated with this sector.
Without a significant uptick in genuine network demand – more users transacting, more capital flowing into DeFi, a resurgence in NFT activity, or new killer dApps emerging – it becomes harder for ETH to absorb the ongoing supply issuance and stage a sustainable rally.
3. Weakened Burn Mechanics: The Diminished Impact of EIP-1559
EIP-1559, implemented in August 2021, was a landmark upgrade for Ethereum. It introduced a mechanism where a portion of every transaction fee (the "base fee") is burned, permanently removing that ETH from circulation. This was a key pillar of the "ultrasound money" narrative, as it created a deflationary pressure that could, under conditions of high network demand, outpace new ETH issuance.
However, the effectiveness of this burn mechanism is directly tied to network congestion and the level of the base fee.
• Lower Network Congestion: In periods of lower network activity and congestion (as has been observed more frequently recently), the base fee required to get transactions included in a block decreases. A lower base fee means less ETH is burned per transaction.
• Impact of Layer 2s: As more transaction activity shifts to Layer 2 scaling solutions, which have their own, typically much lower, fee structures, the demand for block space on Ethereum Layer 1 can decrease. While L2s do periodically batch transactions and settle them on L1 (consuming L1 gas and contributing to the burn), the overall L1 gas consumption directly attributable to individual user transactions might be lower than if all those transactions occurred on L1.
• Periods of Low Burn: Consequently, there have been extended periods post-Merge where the amount of ETH burned via EIP-1559 has been insufficient to offset the ETH issued as staking rewards. During these times, ETH's supply becomes net inflationary, undermining the deflationary narrative that was a strong catalyst in previous cycles.
While EIP-1559 remains a crucial and beneficial upgrade for Ethereum's fee market predictability, its power as a consistent deflationary force has been tempered by the current realities of network demand and the evolving Layer 2 landscape.
Synthesizing the Outlook: A Tug-of-War
The current situation for Ethereum is a complex tug-of-war. On one side, the historically low ETH/BTC ratio flashes a compelling "undervaluation" signal, suggesting a potential for significant upside based on past market behavior. This attracts traders looking for relative value plays and those who believe in Ethereum's long-term fundamental strengths.
On the other side, the fundamental picture is clouded by persistent, albeit reduced, supply issuance, a lack of explosive growth in network demand, and a burn mechanism whose deflationary impact is currently muted. These factors create genuine headwinds that could prevent ETH from easily replicating its past ratio-driven rallies.
For ETH to truly capitalize on its apparent undervaluation relative to Bitcoin, several things likely need to occur:
1. A Resurgence in Demand: This could come from a new "killer app" or narrative on Ethereum, a significant rebound in DeFi or NFT activity, increased institutional adoption (perhaps spurred by clearer regulation or new investment products like spot ETH ETFs in more jurisdictions), or a general improvement in macroeconomic conditions that boosts risk appetite.
2. Successful Maturation and Value Accrual from Layer 2s: As Layer 2 solutions mature and gain wider adoption, their success needs to translate into tangible value accrual for ETH itself. This could happen through increased L1 settlement demand, the use of ETH as a primary gas token on L2s, or innovative mechanisms that tie L2 economic activity back to the L1 token. EIP-4844 ("Proto-Danksharding") is a step in this direction by aiming to reduce L2 transaction costs, potentially fostering more L2 activity and, consequently, more L1 settlement.
3. A Shift in Broader Market Sentiment: Often, major altcoin rallies, including for ETH, occur after Bitcoin has established a strong uptrend and market sentiment becomes broadly bullish. A sustained Bitcoin rally could create a "wealth effect" and encourage capital to rotate into ETH and other altcoins.
Conclusion: Caution Warranted Despite Undervaluation Signals
While the ETH/BTC ratio strongly suggests that Ether is trading at a significant discount compared to Bitcoin, historical precedent alone may not be enough to guarantee a rally in the current market. The fundamental challenges posed by ongoing supply, relatively flat demand, and a less potent burn mechanism are significant and cannot be ignored.
Investors and traders eyeing ETH must weigh the allure of its apparent undervaluation against these tangible headwinds. A potential ETH rally is likely contingent not just on the ratio mean-reverting, but on a demonstrable improvement in Ethereum's core demand drivers and a favorable shift in the broader market environment. The "extremely undervalued" signal is a call for attention, but thorough due diligence and a clear understanding of the current complexities are more crucial than ever. Ethereum's long-term vision remains ambitious, but its path to reclaiming relative market dominance against Bitcoin in the near term appears more challenging than in previous cycles.

ETH is fighting in a strong resistance zone!Hello everyone, I invite you to review the current situation on ETH. When we enter the one-day interval, we can see how the ETH price came out on top from a strong downward trend.
Here we can see how the current bounce brought the movement closer to a very strong resistance zone from $ 2,090 to $ 2,310, in which we can currently observe a fight for further upward movement. Only when the price comes out on top, it can go towards resistance at $ 2,740, and then move towards strong resistance at $ 3,070.
Looking the other way, we can see that when the trend reverses, we first have support at $ 1,837, then a very strong support zone from $ 1,610 to $ 1,404 is visible, however, if this zone is broken, we can see a quick decline to the support area at $ 1,071.
On the RSI indicator we can see how strong the ETH price movement is visible intensively on the indicator and here we can see how we are approaching the upper limit, which could potentially slow down the movement or give a temporary relief.

$ETH has woken up!Usually very busy on Thursday, volunteer work, & didn't find the post on us being bullish on CRYPTOCAP:ETH while many have soured on it.
Targets? Purple Arrows!
We bought leveraged ETF AMEX:ETHT CBOE:ETHU very close to the recent lows.

ETH - Is $3,000 next?Today marked a significant milestone for Ethereum as it successfully rolled out its much-anticipated Pectra upgrade. The update, which introduces a number of technical enhancements aimed at improving scalability, security, and developer experience, has already had a noticeable impact on market sentiment. In the hours following the upgrade, Ethereum (ETH) surged more than 13%, breaking through key resistance levels and igniting fresh bullish momentum.
From a technical standpoint, ETH is currently breaking out of a descending wedge pattern, a structure often seen as a bullish reversal signal. The price action has decisively pushed through the wedge’s upper boundary, signaling a potential end to the recent downtrend. Additionally, ETH is now testing a significant resistance zone, often referred to as the "resistance box," which has historically served as a key battleground between bulls and bears.
Should Ethereum manage to secure a clean breakout above this resistance area with strong volume. The next major upside target lies around the $3,000 level, a psychologically and technically important price point. This move could mark the beginning of a larger bullish cycle if market conditions remain favorable and momentum continues to build.
With the broader crypto market showing signs of recovery and Ethereum's fundamentals strengthening post-upgrade, traders and investors alike will be closely watching to see whether ETH can sustain its breakout and confirm this bullish trend.
-------------------------------
Thanks for your support.
- Make sure to follow me so you don't miss out on the next analysis!
- Drop a like and leave a comment!

Is the Ethereum / Bitcoin bottom In?Eth maxi's have been obliterated for the past six - eight months, as a new all time high proved to be elusive. If you're a trend trader, this may be an interesting set up to watch...
Ethereum about to take the lead during the next leg up in the Crypto markets?

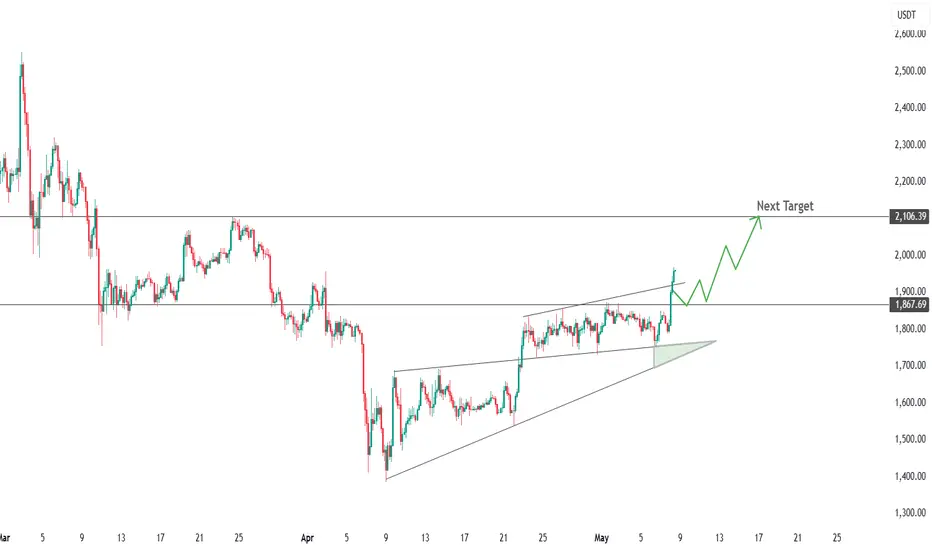
Broke the resistance levelCRYPTOCAP:ETH - wedge broken, target 2,100 USDT
After a three-week contraction, the price broke above the upper boundary of the ascending wedge and the 1,870 USDT horizontal, confirming a change of momentum in favor of the bulls.
📌 Levels
- S1 1 870 USDT - top of the wedge, retest zone
- S2 1,800-1,820 USDT - base of the formation
- R1 1 900-1 920 USDT - local obstacle near trend lines
- R2 2,106 USDT - calculated wedge height target and March supply area
📈 Scenario
Holding S1 opens the way to R1; a consolidation above 1,920 activates the march to 2,100 USDT. A run-up to 2,200 is not ruled out with strong volume.
⚠️ Risks
A failure ⇩ 1,870 would indicate a false breakout; a move below 1,800 would bring the price back to the wedge and increase the chance of a test of 1,740.