BTC – Liquidity Sweep, Fair Value Gap Reactions & Potential LongMarket context and structure
This BTCUSDT 1-hour chart from BYBIT illustrates a methodical transition from a phase of consolidation to bullish expansion, guided by smart money principles. Price initially consolidates beneath a well-defined resistance level, with an Imbalance Fair Value Gap (IFVG) forming inside the range. This IFVG signals an inefficient zone where institutional players may be positioned. The eventual breakout above this range indicates a structural shift and the beginning of a directional move, setting the stage for further bullish development.
Break of structure and liquidity sweep
Following the breakout, BTC sweeps the buy-side liquidity resting above a prior swing high. This liquidity grab is a common maneuver in smart money trading, designed to trigger stop orders and breakout entries to facilitate larger institutional fills. The aggressive price movement results in the creation of several Fair Value Gaps (FVGs), which are regions where price moved with such momentum that no overlap between candles occurred. These FVGs are crucial areas of interest where future re-entries or continuations might originate.
Fair value gaps and demand zones
The chart highlights multiple FVGs formed during the bullish impulse. The uppermost FVG, located just below the most recent liquidity sweep, acts as a shallow retracement zone and has already been partially mitigated. A mid-range FVG extends further down, providing a secondary support layer within the current price structure. The largest and deepest FVG lies closer to the breakout origin and represents a significant unfilled demand zone. These FVGs help to outline institutional footprints, revealing where unfulfilled orders may still reside and where price might return to rebalance.
Re-entry strategy and projection
An ideal re-entry area is labeled “Entry at IFVG,” situated near the recently swept liquidity. The projection suggests that price may retrace slightly into this IFVG, consolidate, and then continue its upward trajectory. This anticipated movement reflects a bullish continuation pattern rooted in the idea of reaccumulation, where price revisits areas of imbalance before pushing higher. The visual path drawn on the chart captures this idea, showing a measured retracement followed by a continuation of the trend.
Interpretation and tactical bias
The overall structure and price behavior support a smart money-based bullish outlook. The clean break of structure, the successful sweep of liquidity, and the presence of multiple fair value gaps provide a foundation for continued upside potential. Price respecting these imbalance zones on pullbacks reinforces demand and highlights ongoing institutional involvement. This setup encourages a patient, context-aware approach to trading, focusing on inefficiencies, order flow, and the narrative of price rather than arbitrary indicators.
Ethereum (Cryptocurrency)

Super bullish ETH now. ETH.D, ETHBTC, ETHUSD all bottom signalsMy forecast for ETH Dominance. I believe it will come back with vengeance relative to BTC. CRYPTOCAP:ETH.D BINANCE:ETHBTC BINANCE:ETHUSD COINBASE:ETHUSD BITSTAMP:BTCUSD

Ethereum ETH price analysisThe #Ethereum network has successfully activated the #Pectra update, one of the factors that JPMorgan previously called a bullish driver for CRYPTOCAP:ETH
The update contains 11 improvements, including: support for smart contracts in wallets (simplified use and recovery, payment of fees in different tokens), an increase in the staking limit to 2048 ETH, optimization of validators and management of withdrawals through smart contracts.
All of this should make #Ethereum more convenient, scalable, and accessible.
📊 If we look at the OKX:ETHUSDT chart, I want to believe that the price will not go below $1500-1600 and this will be the “last carriage” buying zone
📈 And then - a smooth “acceleration of a heavy locomotive”, which, let's hope, will reach the $3800 “station” already in 2025.
_____________________
Did you like our analysis? Leave a comment, like, and follow to get more

ETHEREUM, priority for growth, details in the description...The forecast is calculated for the near future for about 1.5 years
According to my calculations, the asset reached its bottom in April, but it will take more time to gain strength.
(Not an investment recommendation)

ETHEREUM SHORT TO $786! (UPDATE)ETH dumping really hard as we expected on our last analysis! Scroll up to see our previous analysis. I said we'd see a drop down to 'Minor Wave 3' before a slow down & retracement back up towards 'Minor Wave 4' & that is exactly what has happened!
$786 still remains our Wave C target of my ‘Elliott Wave Theory’ strategy.

Ethereum Prepares for Major Pectra UpgradeEthereum—the second-largest cryptocurrency by market capitalization—is set to undergo a major upgrade in May 2025, known as “Pectra.” This update promises to significantly improve scalability, performance, and user experience. But what exactly does it entail?
Pectra follows the groundbreaking "Merge" event of 2022, which shifted Ethereum from proof-of-work to proof-of-stake consensus. With that transition complete, developers have now turned their focus to making the network faster, cheaper, and more user-friendly.
The upgrade includes several Ethereum Improvement Proposals (EIPs), targeting transaction processing, wallet functionality, and validator operations. Some key highlights are improvements in staking, partial withdrawals, adaptive fee structures, and better client compatibility.
Most notably, Pectra enhances staking mechanics, allowing validators to partially withdraw funds—something that was previously restricted. This change is expected to attract more participants to Ethereum’s staking ecosystem.
Transaction efficiency is also a central focus. The upgrade aims to reduce network congestion and lower gas fees, which have long been a pain point for users of decentralized finance (DeFi) platforms and NFT marketplaces.
Investor sentiment is cautiously optimistic. Though ETH price action remains relatively stable, trading volumes have increased as traders position themselves ahead of the upgrade. Analysts suggest that a successful implementation could trigger a rally in Ethereum’s price, especially if the changes deliver on promised performance gains.
Ethereum continues to dominate the smart contract space despite increasing competition from blockchains like Solana and Avalanche. Pectra could further solidify Ethereum’s lead, especially if it improves network speed and lowers costs without compromising decentralization.
This upgrade isn’t just a technical patch—it’s a strategic move to future-proof the Ethereum ecosystem in the Web3 era. With Pectra, Ethereum reinforces its role as the foundational infrastructure for decentralized applications.

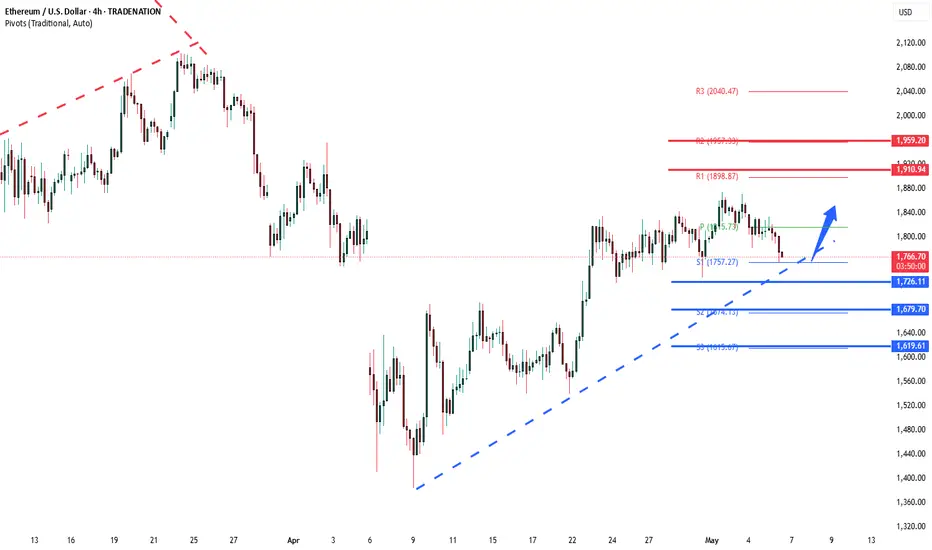
ETHUSD INTRADAY rising support retestETH/USD maintains a bullish sentiment, supported by an ongoing upward trend. However, recent intraday price action shows signs of sideways consolidation, suggesting a pause or potential setup before the next significant move.
Key Levels:
Support: 1,726 (primary), followed by 1,680 and 1,620
Resistance: 1,910, with extended targets at 1,960 and 2,020
The 1,726 level serves as a critical pivot point, marking a previous consolidation zone. A pullback toward this level followed by a bullish rebound could reaffirm the uptrend and set the stage for a move toward the 1,910 resistance. A breakout above 1,910 would likely open the path to higher targets at 1,960 and 2,020 over the medium to long term.
On the other hand, a daily close below 1,726 would weaken the bullish structure and could trigger a deeper retracement toward 1,680 and potentially 1,620.
Conclusion:
ETH/USD remains in a bullish trend, but short-term consolidation may precede the next leg up. Traders should monitor the 1,726 support level closely—its defense could signal trend continuation, while a breakdown would increase downside risk.
This communication is for informational purposes only and should not be viewed as any form of recommendation as to a particular course of action or as investment advice. It is not intended as an offer or solicitation for the purchase or sale of any financial instrument or as an official confirmation of any transaction. Opinions, estimates and assumptions expressed herein are made as of the date of this communication and are subject to change without notice. This communication has been prepared based upon information, including market prices, data and other information, believed to be reliable; however, Trade Nation does not warrant its completeness or accuracy. All market prices and market data contained in or attached to this communication are indicative and subject to change without notice.
Ethereum H4 | Potential bullish bounceEthereum (ETH/USD) is falling towards a multi-swing-low support and could potentially bounce off this level to climb higher.
Buy entry is at 1,732.25 which is a multi-swing-low support that aligns close to the 23.6% Fibonacci retracement.
Stop loss is at 1,650.00 which is a level that lies underneath a pullback support and the 38.2% Fibonacci retracement.
Take profit is at 1,938.37 which is an overlap resistance that aligns with the 78.6% Fibonacci retracement.
High Risk Investment Warning
Trading Forex/CFDs on margin carries a high level of risk and may not be suitable for all investors. Leverage can work against you.
Stratos Markets Limited (tradu.com):
CFDs are complex instruments and come with a high risk of losing money rapidly due to leverage. 63% of retail investor accounts lose money when trading CFDs with this provider. You should consider whether you understand how CFDs work and whether you can afford to take the high risk of losing your money.
Stratos Europe Ltd (tradu.com):
CFDs are complex instruments and come with a high risk of losing money rapidly due to leverage. 63% of retail investor accounts lose money when trading CFDs with this provider. You should consider whether you understand how CFDs work and whether you can afford to take the high risk of losing your money.
Stratos Global LLC (tradu.com):
Losses can exceed deposits.
Please be advised that the information presented on TradingView is provided to Tradu (‘Company’, ‘we’) by a third-party provider (‘TFA Global Pte Ltd’). Please be reminded that you are solely responsible for the trading decisions on your account. There is a very high degree of risk involved in trading. Any information and/or content is intended entirely for research, educational and informational purposes only and does not constitute investment or consultation advice or investment strategy. The information is not tailored to the investment needs of any specific person and therefore does not involve a consideration of any of the investment objectives, financial situation or needs of any viewer that may receive it. Kindly also note that past performance is not a reliable indicator of future results. Actual results may differ materially from those anticipated in forward-looking or past performance statements. We assume no liability as to the accuracy or completeness of any of the information and/or content provided herein and the Company cannot be held responsible for any omission, mistake nor for any loss or damage including without limitation to any loss of profit which may arise from reliance on any information supplied by TFA Global Pte Ltd.
The speaker(s) is neither an employee, agent nor representative of Tradu and is therefore acting independently. The opinions given are their own, constitute general market commentary, and do not constitute the opinion or advice of Tradu or any form of personal or investment advice. Tradu neither endorses nor guarantees offerings of third-party speakers, nor is Tradu responsible for the content, veracity or opinions of third-party speakers, presenters or participants.

ETH/USDT – Weekly Chart AnalysisETH/USDT Unique Technical Structure: Large Accumulation + Recovery Setup
This chart shows Ethereum’s price action over the past few years, highlighting key support and resistance areas. A strong visual signal (blue arrow) indicates bullish potential.
Chart Pattern Implications:
The pattern on this chart is not a classical shape (e.g., cup and handle), but it does show a Wyckoff-style accumulation phase followed by a failed breakout and reaccumulation:
Strong base formed between $1,000-$1,400
A series of lower highs and a range-bound structure after the 2022 peak
The bullish projection illustrated by the arrows shows a potential recovery towards the ATH again
This setup suggests that Ethereum is at a critical juncture – either:
It retests current support and begins a new uptrend.
Or it risks another test of the $1,400-$1,050 range before a breakout.
Risk-Reward: Current levels ($1,796) offer attractive long-term entries if you’re bullish.
Caution Zone: If ETH breaks below $1,400 with volume, $1,050 becomes the next key defense.
If you found this analysis helpful, hit the Like button and share your thoughts or questions in the comments below. Your feedback matters!
Thanks for your support!
DYOR. NFA

ETHEREUM: Will Go Up! Long!
My dear friends,
Today we will analyse ETHEREUM together☺️
The price is near a wide key level
and the pair is approaching a significant decision level of 1801$ Therefore, a strong bullish reaction here could determine the next move up.We will watch for a confirmation candle, and then target the next key level of 1810$ Recommend Stop-loss is beyond the current level.
❤️Sending you lots of Love and Hugs❤️

ALERT: ALT SEASON INCOMING? 🚨 ALERT: ALT SEASON INCOMING? 🚨
Take a close look at the BTC/ETH chart — we’re seeing early signs of a major rotation out of Bitcoin and into Ethereum and altcoins. Historically, when the BTC/ETH ratio starts to fall, it's a clear signal that capital is flowing into altcoins, marking the beginning of alt season.
🔍 The ratio is showing bearish divergence and approaching a key support zone. If this level breaks, ETH is likely to outperform BTC significantly — and we all know what follows: altcoins explode.
📉 BTC dominance is stalling, ETH gaining strength, and altcoins are waking up. The market is shifting. Don't get caught late.
🚀 Get ready. The alt season might just be starting now.
#AltSeason #Crypto #BTC #ETH #TradingView #CryptoTrends

HolderStat | preparing for the May saleThis smart trader withdrew 2.965 CRYPTOCAP:ETH ~$4.9K to Crypto.com—proof this trader is primed to load up on alts. With a lifetime 1832% return over 9 trades this fresh deposit signals full force into the next altcoin rally 🌟

Eth capitulation to dominationEthereum Investment Thesis: A Programmable Settlement Layer for a Decentralized Financial Future
Ethereum stands at the intersection of programmable money, digital settlement infrastructure, and financial innovation. As the second-largest blockchain by market capitalization, it is not merely a platform for decentralized applications—it is evolving into the base layer for a new global financial internet. Its value proposition rests on four structural pillars: sound monetary mechanics, scalable architecture, an expanding Layer 2 (L2) ecosystem, and dominance in developer and capital gravity.
Ethereum’s transformation from proof-of-work to proof-of-stake in 2022 was more than a sustainability milestone. It fundamentally altered the asset’s economic profile. The shift slashed issuance by over 90%, while Ethereum’s unique “EIP-1559” fee burn mechanism began removing ETH from circulation with every transaction. This combination has resulted in a low-inflation—or in some market phases, deflationary—monetary system. ETH now behaves similarly to traditional "hard money" assets like gold or Bitcoin, yet offers more utility as the fuel for a vast programmable ecosystem.
Ethereum’s roadmap is methodical and long-term focused, reflecting a credible commitment to scalability and decentralization. The March 2024 Dencun upgrade introduced “blob” transactions that drastically reduced the cost of L2 data posting, enhancing user affordability across rollups. Future upgrades, particularly Pectra (expected mid-2025), will optimize validator operations and prepare the network for more advanced cryptographic improvements like Verkle trees. These upgrades align with Ethereum’s modular design philosophy: execution happens on L2s, while security and settlement remain on Ethereum’s base layer.
The Layer 2 ecosystem is a central piece of Ethereum’s long-term strategy. Rollups like Arbitrum, Optimism, Base (by Coinbase), and zkSync handle millions of daily transactions, offering high throughput and low latency while inheriting Ethereum’s security guarantees. This design mirrors the structure of the internet itself—modular, resilient, and scalable. As these L2s commoditize blockspace, Ethereum captures value through data availability fees, settlement costs, and increasingly, from restaking services that allow ETH to secure multiple protocols simultaneously.
In comparison to Bitcoin, Ethereum provides greater expressiveness and economic utility. While Bitcoin is optimized as a non-sovereign store of value, Ethereum combines that quality with the ability to run complex financial instruments, autonomous organizations, and digital identity layers. Solana, on the other hand, prioritizes raw throughput at the expense of some decentralization trade-offs. While Solana’s network architecture allows for high-frequency applications and fast consumer experiences, it has experienced multiple outages and is secured by a comparatively smaller validator set and market cap. Ethereum’s resilience, economic security, and widespread adoption give it a stronger foundation for long-term institutional confidence.
The global macroeconomic backdrop further enhances Ethereum’s relevance. Major economies including the United States, the European Union, and China are entrenched in structurally expansionary fiscal and monetary positions. The U.S. continues to run deficits near or above 6% of GDP, while interest rate normalization is constrained by political and economic pressures. These conditions erode confidence in fiat currencies and drive demand for alternative monetary instruments and decentralized financial infrastructure.
Ethereum serves as a compelling hedge against this backdrop. Its deflationary potential and capped monetary issuance mirror qualities traditionally attributed to gold or Bitcoin, yet its programmable nature opens new frontiers. Stablecoins—digital representations of dollars—have become Ethereum’s killer app, with annual settlement volumes surpassing Visa. Crucially, every transaction paid in ETH, regardless of whether it involves native assets or synthetic dollars, contributes to the scarcity of ETH through fee burns. Thus, demand for dollar-denominated assets paradoxically increases the value of ETH.
Beyond stablecoins, Ethereum is at the forefront of real-world asset tokenization. Institutions like BlackRock and Franklin Templeton are deploying tokenized money market funds and Treasury products directly onto Ethereum or Ethereum-compatible chains. This allows global investors to access yield-bearing instruments without intermediaries or banking infrastructure, especially valuable in capital-controlled or inflation-prone economies. Ethereum, therefore, is not just a blockchain—it is the settlement rail for a parallel, internet-native financial system.
The future value of ETH is tied not only to its use as a monetary asset but also to its role in securing and settling trillions in financial activity. As L2s grow, as institutions tokenize assets, and as more economic primitives move on-chain, ETH accrues utility, security demand, and monetary premium. Ethereum becomes a synthetic sovereign infrastructure: one without borders, central banks, or inflationary mandates.
That said, risks remain. Regulatory uncertainties—particularly in the U.S.—could impact staking services or the classification of ETH. Execution risk exists with Ethereum’s ambitious technical roadmap, and competition from alternative Layer 1s or modular data availability solutions may capture segments of demand. Additionally, innovations like restaking introduce new systemic risks if not carefully governed. But Ethereum’s transparent governance, broad contributor base, and deep liquidity give it a resilient edge.
In conclusion, Ethereum represents a generational investment opportunity: a digitally native, programmable, and deflationary monetary system embedded into a decentralized global financial internet. For those seeking an asymmetric hedge against fiat debasement, combined with venture-like upside on the transformation of fintech, Ethereum remains one of the most compelling assets in the digital age.

XAU/USD: NFP has come,What's Next? (READ THE CAPTION)By analyzing the gold chart on the 1-hour timeframe, we can see that after yesterday’s analysis, the price successfully rallied from $3231 to $3268. Once it reached that zone, selling pressure kicked in, and gold has since corrected down to $3239.
If gold stabilizes below $3257, we may expect further downside. The potential bearish targets are $3237 and $3221.
Keep a close eye on the $3209–$3220 zone, as price reaction there could be significant.
Please support me with your likes and comments to motivate me to share more analysis with you and share your opinion about the possible trend of this chart with me !
Best Regards , Arman Shaban

BTCUSDT - Potential Long Setup Developing from FVG and Fib levelOverview:
Bitcoin (BTCUSDT) on the 1H timeframe is currently exhibiting a controlled retracement following a local top. This structure presents a potential opportunity for a long setup based on confluence between an FVG (Fair Value Gap) and key Fibonacci retracement levels. The chart highlights a likely scenario where price may continue to correct lower into a defined area of interest before resuming bullish momentum.
Market Context:
After a strong impulsive move upward, BTC appears to be in a corrective phase. The recent price action has formed a series of lower highs and lower lows, which is characteristic of a short-term downtrend within a broader uptrend context. This kind of pullback behavior is often necessary for healthy continuation to the upside and can offer high-probability entries for trend continuation traders.
Fair Value Gap (FVG):
A notable fair value gap has been identified in the 94,250–94,700 zone. This zone represents an inefficiency in the market where price rapidly moved without significant opposition, leaving behind a gap between wicks of adjacent candles. Price often returns to such areas to rebalance order flow before making its next decisive move.
Fibonacci Confluence:
The chart includes key Fibonacci retracement levels drawn from the recent swing low to swing high.
* The 0.618 Fibonacci retracement level lies just above the FVG, providing strong technical confluence.
* The 0.65 level is marked as the ideal entry zone and sits within the FVG, further validating it as a high-probability support region.
* The 0.786 level is also marked, and although deeper, it represents the final line of defense for this bullish scenario.
Anticipated Price Action:
A bullish projection is illustrated on the chart where price is expected to:
1. Continue declining toward the 0.65–0.618 Fibonacci confluence zone.
2. Wick into the FVG and reject from that level.
3. Form a short-term higher low structure and push back to reclaim prior structure highs.
4. Confirm bullish structure continuation with an impulsive breakout from the descending channel.
Market Structure and Liquidity Outlook:
The broader structure remains bullish on higher timeframes. The retracement into the FVG would serve the dual purpose of:
* Grabbing liquidity below recent lows.
* Mitigating unfilled buy-side inefficiency.
Such a development would suggest that institutional participants are filling long orders in the discounted price region, setting the stage for a potential continuation of the broader bullish trend.
Key Technical Zones:
* FVG Zone: 94,250 – 94,700
* Fibonacci Confluence: 0.618–0.65 retracement levels
* Liquidity Pool: Below current swing lows leading into the FVG
Conclusion:
BTCUSDT is approaching a critical decision zone. A move into the FVG combined with Fibonacci retracement confluence presents an attractive area for potential long entries. Confirmation of bullish reversal structure within this zone could offer a strong trade opportunity in alignment with the broader trend. Patience and precision will be key in waiting for the price to tap into this area and show intent to reverse.

possible short entry reversal point!Levels to keep an eye on for BOS for a high possibility short entry. In order to reach the higher levels a ABC structure is vital. looking for trendline break for confirmation.

Breakout trading point: 1861.57
Hello, traders.
If you "Follow", you can always get new information quickly.
Please click "Boost" as well.
Have a nice day today.
-------------------------------------
(ETHUSDT 1D chart)
The 1861.57 point is the HA-Low indicator point on the 1W chart.
The key is whether it can receive support and rise around the A section, that is, 1861.57.
Since the HA-Low indicator on the 1D chart is formed at the 1647.06 point, it is important whether it can receive support and rise in the 1647.06-1861.57 section.
If it shows support in the 1647.06-1861.57 section, it is a time to buy.
-
If it falls from 1647.06, there is a possibility that a stepwise downtrend will continue, so you should also consider a response plan for this.
In the case of a decline, the Fibonacci ratio section of 0 (1190.57) ~ 0.786 (1259.39) is expected to be an important support and resistance section.
-
Since the price is located below the M-Signal indicator on the 1M chart, it is recommended to conduct trading from a day trading or short-term trading perspective.
When it breaks through the 1861.57 point, a breakout trade is possible, but as I mentioned earlier, trading requires a short and quick response.
-
If the StochRSI indicator is above the midpoint, it is recommended to focus on finding a time to sell, and if it is below the midpoint, it is recommended to focus on finding a time to buy.
When creating a trading strategy by referring to the movement of these auxiliary indicators, you must check whether there is support at the support and resistance points drawn on the 1M, 1W, and 1D charts.
-
Thank you for reading to the end.
I hope you have a successful trade.
--------------------------------------------------
- Here is an explanation of the big picture.
I used TradingView's INDEX chart to check the entire range of BTC.
I rewrote the previous chart to update it while touching the Fibonacci ratio range of 1.902 (101875.70) ~ 2 (106275.10).
(Previous BTCUSD 12M chart)
Looking at the big picture, it seems to have been maintaining an upward trend following a pattern since 2015.
In other words, it is a pattern that maintains a 3-year bull market and faces a 1-year bear market.
Accordingly, the upward trend is expected to continue until 2025.
-
(Current BTCUSD 12M chart)
Based on the currently written Fibonacci ratio, it is displayed up to 3.618 (178910.15).
It is expected that it will not fall again below the Fibonacci ratio of 0.618 (44234.54).
(BTCUSDT 12M chart)
Based on the BTCUSDT chart, I think it is around 42283.58.
-
I will explain it again with the BTCUSD chart.
The Fibonacci ratio ranges marked in the green boxes, 1.902 (101875.70) ~ 2 (106275.10) and 3 (151166.97) ~ 3.14 (157451.83), are expected to be important support and resistance ranges.
In other words, it seems likely that they will act as volume profile ranges.
Therefore, in order to break through these ranges upward, I think the point to watch is whether they can receive support and rise near the Fibonacci ratios of 1.618 (89126.41) and 2.618 (134018.28).
Therefore, the maximum rising range in 2025 is expected to be the 3 (151166.97) ~ 3.14 (157451.83) range.
In order to do that, we need to see if it is supported and rises near 2.618 (134018.28).
If it falls after the bull market in 2025, we don't know how far it will fall, but based on the previous decline, we expect it to fall by about -60% to -70%.
Therefore, if it starts to fall near the Fibonacci ratio 3.14 (157451.83), it seems likely that it will fall to around Fibonacci 0.618 (44234.54).
I will explain more details when the bear market starts.
------------------------------------------------------

Why Ethereum Could 10x in the Next Few Years🚀
1. Ethereum ETF Approval
ETFs are approved in the U.S. (similar to the Bitcoin ETFs in early 2024), institutional money will flood in.
Grayscale, BlackRock, and others have already filed.
Ethereum’s price jumped significantly after similar events in the past.
2. Deflationary Supply (Post-EIP-1559)
Since EIP-1559, ETH has been burned with every transaction.
Combined with Proof-of-Stake (The Merge), ETH is now net deflationary during periods of high network activity.
3. Layer 2 Ecosystem Is Exploding
Rollups (Arbitrum, Optimism, Base, zkSync) are scaling Ethereum.
These L2s settle on Ethereum L1, driving fees and activity.
Vitalik’s "rollup-centric roadmap" is playing out — this benefits ETH long-term.
4. Real Yield from Staking
Ethereum now offers a real, sustainable yield from staking (~3–5%).
Institutions love yield. ETH becomes more like a productive asset, not just a speculative token.
5. Ethereum as the Base Layer of Web3
DeFi, NFTs, gaming, DAOs — Ethereum is still the dominant smart contract platform.
The most secure, battle-tested, and widely adopted chain.
Developers and enterprises continue to build on Ethereum over competitors.
6. Macro Tailwinds
As the U.S. moves toward looser monetary policy, risk assets (including crypto) historically benefit.
Crypto adoption is growing globally — from Latin America to Asia — and Ethereum is often the entry point.

Ethereum: Sell Or Hold? Panic Buy, Panic Sell or Panic Hold?If I were you in this situation, what would you do?
What would you do if you were not you in this situation?
Ethereum hit bottom on the 9th of April and the bottom is confirmed based on the same candle. It ended full green and with really high volume.
The action moved back above support on 22-April when the 3-Feb. low resistance was conquered. Ethereum now trades within a tight price range.
This range's support has been tested four times and it holds, Ethereum now trades higher but what will happen next? What would you do if I were me?
Market conditions can change in a day. Two days green, two days red it is all sideways, nothing changes and nothing has changed.
If you are still wondering if you should panic sell or panic hold right now all you have to do is panic buy because Ethereum is going up.
Ignore the short-term nothing because this chart isn't showing even noise. It is the consolidation of the higher low before additional growth.
Ethereum's chart looks very different to Bitcoin, it is incredible. Ethereum is no longer "#2" but more like an Altcoin, Bitcoin has its own chart while Ethereum has the chart of a medium sized Cryptocurrency pair. This is good, it tells us that Ethereum is about to grow really strong and will produce a new All-Time High in 2025. This All-Time High will be higher than 2021 because while this isn't Bitcoin it is still a very strong chart. Expect lower no more, panic buy followed by panic hold while you rest easy and relaxed because there is no panic when the market grows.
The only panic right now is on the short side because the bottom is in and the bears are gone.
Rest easy, do not let go of your coins. Hold strong.
Never ever use a stop-loss. Think long-term and the market will bless you with amazing results.
Namaste.

Ethereum is Nearing The Daily TrendHey Traders, in today's trading session we are monitoring ETH/USDT for a selling opportunity around 2,000 zone, Ethereum is trading a downtrend and currently is in a correction phase in which it is approaching the trend at 2,000 support and resistance area.
Trade safe, Joe.

Bitcoin Hype vs. Reality: A Breakdown of Bitcoin DelusionBitcoin enthusiasts often dream of mass adoption, corporate treasuries, and state-backed investments driving its price to astronomical levels. But let’s examine the actual numbers behind these claims.
🔹 The $1M Bitcoin Fantasy
Many believe Bitcoin will reach $300K, $500K, or even $1M. But what does that actually require?
💰 Bitcoin’s current circulating supply is approximately 19.5 million coins.
💰 At $830K per coin, the total market cap would be $16 trillion—which is:
✅ More than China’s entire GDP ($6T)
✅ 5x the market cap of Apple, Microsoft, Amazon, Google & Tesla combined
To put this into perspective, the entire global crypto market cap is currently around $2.99 trillion. Expecting Bitcoin alone to hit $16 trillion is beyond unrealistic.
🔹 Why Government & Corporate Adoption Won’t Skyrocket Price
Bitcoin believers often cite governments and corporations buying Bitcoin as proof it will moon. But here’s the reality:
⚠️ State & corporate purchases are OTC (Over-The-Counter) deals—they do not impact market prices like retail speculation.
⚠️ Governments negotiate strategically, they don’t impulsively buy at public prices to pump the asset.
⚠️ Treasury holdings do not guarantee higher prices—they only serve as reserves, not market drivers.
State adoption might increase legitimacy, but it won’t magically push Bitcoin past gold or global GDP levels.
🔹 Bitcoin’s Volatility vs. Gold’s Stability
Bitcoin is often compared to gold as a store of value, but its history tells a different story:
📉 Bitcoin has crashed over 80% multiple times—far from a stable asset.
📉 Extreme volatility makes it unreliable for wealth preservation.
📉 Liquidity issues create uncertainty, making it impractical for widespread adoption as money.
Gold, by contrast, has proven stability for centuries, with intrinsic value, industrial use, and universal acceptance.
🔹 Bitcoin Will NOT Absorb the Global Economy
Some claim Bitcoin will replace fiat, surpass gold, and absorb trillions in wealth. But the economic reality is:
❌ Bitcoin remains speculative, driven by market sentiment, not intrinsic value.
❌ No nation will abandon fiat for Bitcoin—they will regulate, integrate, but never replace sovereign currency.
❌ Bitcoin lacks industrial utility—gold has actual use in electronics, medicine, and aerospace.
🔹 The Crypto Dream vs. Financial Reality
Crypto thrives on believers, feeding them narratives that sound appealing but don’t match real-world economic fundamentals.
Bitcoin is not overtaking gold.
Bitcoin is not absorbing global wealth.
Bitcoin is not making every holder a millionaire.
Numbers don’t lie, but ignoring them won’t change reality. When the hype fades, speculative investors will face the harsh truth: Bitcoin is not a guaranteed path to riches—it’s a high-risk, volatile asset that operates in an unpredictable market.

ETHEREUM New Update (1D)Price has approached a supply (flip) zone. It is not expected to break this zone on the first attempt, and bears are likely to regain control for now.
If Ethereum returns once again to the lower zones marked on the chart, it could present a low-risk opportunity for buy/long positions.
The main target can be the upper supply zone.
A daily candle closing below the invalidation level would invalidate this analysis.
Do not enter the position without capital management and stop setting
Comment if you have any questions
thank you

BTC - Golden Pocket & Strong FVG Resistance for a Short SetupThe current 15-minute chart of BTCUSDT reveals a textbook bearish setup forming as price retraces into a well-defined supply zone. This analysis focuses on structural breakdowns, liquidity engineering, and key Fibonacci confluences that may lead to a short-term reversal within intraday price action.
Overview of Market Structure:
BTCUSDT has been in a clear intraday downtrend with consistent lower highs and lower lows being formed. The recent price action reflects a temporary consolidation phase following the creation of a new swing low. This minor pullback appears to be corrective in nature, moving upward toward a previously established zone of inefficiency.
At the center of this setup is a well-marked bearish fair value gap (FVG), highlighted with a blue shaded rectangle, where institutional selling is expected to have previously occurred. This FVG formed after a strong displacement candle, suggesting unmitigated sell-side imbalance left in the market.
Retracement Zone and Fibonacci Confluence:
As price retraces upward, it enters the equilibrium region of the recent bearish impulse, with notable confluences around the 0.618 and 0.65 Fibonacci retracement levels. These retracement levels are critical markers where smart money algorithms often execute continuation plays during trending phases.
Both the 0.618 and 0.65 levels fall within the center of the FVG zone, further strengthening the case for this being a valid supply area. These levels are plotted with horizontal lines on the chart and serve as ideal zones to monitor for signs of rejection or bearish order flow resumption.
The 0.786 retracement, marked just above the upper boundary of the FVG, acts as a final extremity level. This level often coincides with liquidity pools where stop hunts are engineered before the actual move begins. Its proximity to a recent swing high makes it an area of interest for potential liquidity grabs prior to a deeper move down.
Projected Price Path and Liquidity Targets:
The projected blue path illustrates an expected liquidity sweep into the FVG zone, followed by a sharp rejection. This aligns with the idea of engineered liquidity collection before continuation in the original trend direction. The move anticipates price reaching back into the area of prior support, targeting unmitigated demand near recent lows.
Of particular interest is the area around the 0.28 Fibonacci extension level, which acts as a probable magnet for price in the event of a successful rejection. The chart structure suggests that once the short-term retracement completes, there is room for a new impulse leg lower.
Internal Structure Observation:
The current lower timeframe structure shows rising momentum toward the FVG. However, this upward push lacks aggressive bullish volume and appears corrective rather than impulsive. This suggests that buyers are likely exhausting themselves as price nears the supply zone.
Additionally, the structure within this move is developing lower-timeframe liquidity pools (equal highs and tight consolidation), which could act as inducement for a sweep before the potential reversal occurs.
Conclusion:
This chart offers a well-structured short setup based on supply zone rejection, Fibonacci confluence, and a bearish market structure. The fair value gap zone between the 0.618 and 0.65 retracement levels is key, and price action within this area will be crucial in determining the next directional leg. If bearish confirmation such as an engulfing pattern or break of market structure occurs within or after tapping this zone, it would validate the bearish outlook for a short-term continuation to the downside.
This setup is ideal for intraday traders focused on precision-based entries rooted in institutional order flow principles.
