Ethereum (Cryptocurrency)

ETH at a critical Zone - Bounce or Drop?Ethereum is trading at a key level. Will we see a strong reversal to the upside, or is a deeper drop coming? What's your expectation?
Share your thoughts below!
Kindly support this idea with a LIKE👍 if you find it useful🥳
Happy Trading💰🥳🤗

HolderStat | Tracking a true ETH strategist📈 Almost $8 million made on ETHUSDT deals.
💡 Ethereum maximalist who staked his entire balance via Lido for liquid staking.

HolderStat | Smart ETH whale spotted💼 Holding 6.5 ETH (~$11,722)
💰 Invested: $1.1K → Profit: $11K (+1006%)
📉 Avg Buy: $1,289 | 📈 Avg Sell: $4,572
📌 Bought more CRYPTOCAP:ETH a month ago
🦄 Still holding BME:UNI
Knows how to ride the cycle like a pro 😎

Ethereum about to flyAs the falling channel for ethereum has broken few days ago, now the weekly MACD is about to make a bullish cross as well, and that makes ethereum to fly soon

Bearish drop?Ethereum (ETH/USD) is reacting off the pivot and could drop to the 50% Fibonacci support.
Pivot: 1,833.07
1st Support: 1,686.37
1st Resistance: 1,949.39
Risk Warning:
Trading Forex and CFDs carries a high level of risk to your capital and you should only trade with money you can afford to lose. Trading Forex and CFDs may not be suitable for all investors, so please ensure that you fully understand the risks involved and seek independent advice if necessary.
Disclaimer:
The above opinions given constitute general market commentary, and do not constitute the opinion or advice of IC Markets or any form of personal or investment advice.
Any opinions, news, research, analyses, prices, other information, or links to third-party sites contained on this website are provided on an "as-is" basis, are intended only to be informative, is not an advice nor a recommendation, nor research, or a record of our trading prices, or an offer of, or solicitation for a transaction in any financial instrument and thus should not be treated as such. The information provided does not involve any specific investment objectives, financial situation and needs of any specific person who may receive it. Please be aware, that past performance is not a reliable indicator of future performance and/or results. Past Performance or Forward-looking scenarios based upon the reasonable beliefs of the third-party provider are not a guarantee of future performance. Actual results may differ materially from those anticipated in forward-looking or past performance statements. IC Markets makes no representation or warranty and assumes no liability as to the accuracy or completeness of the information provided, nor any loss arising from any investment based on a recommendation, forecast or any information supplied by any third-party.


ETH/USD Coinbase Trading Plan. AI Prediction Apr 29, 2025 ETH/USD Trading Plan
Short-Term (24-48 Hours)
Long Entry : 1825 (Confirmed if price breaks 1830 with volume >6000).
SL : 1795 (10 points below support). TP: 1845 (just above resistance). Trailing Stop: 1.5% after TP1 (1845).
Short Entry : 1795 (Confirmed if price closes below 1800 with volume >5000).
SL : 1815 (10 points above entry). TP: 1760 (above 1750 support). Trailing Stop: 1.5% after TP1 (1760).
Long-Term (3-7 Days)
Long Entry : 1850 (Confirmed with daily close above 1840 + rising volume).
SL : 1820 (30 points below breakout). TP: 1900. Trailing Stop: 2% after price reaches 1900.
Short Entry : 1740 (Confirmed with daily close below 1750).
SL : 1765 (15 points above entry). TP: 1700. Trailing Stop: 2% after price hits 1700.
Re-Evaluate Forecasts If:
- Price stalls at key levels (1840 or 1750) for >6 hours without momentum.
- Volume drops sharply during a breakout/breakdown.
- External catalysts (news, macros) emerge.
Confirmation Tools:
Volume spikes (>6000 for longs, >5000 for shorts), candlestick reversals (hammer/shooting star), and consolidation breaks.
Disclaimer: This is not financial advice. Crypto markets are highly volatile and speculative. Always do your own research and consult a qualified financial advisor before investing. You could lose your entire investment.

ETHUSD INTRADAY sideways consolidation supported at 1726ETH/USD maintains a bullish sentiment, supported by an ongoing upward trend. However, recent intraday price action shows signs of sideways consolidation, suggesting a pause or potential setup before the next significant move.
Key Levels:
Support: 1,726 (primary), followed by 1,680 and 1,620
Resistance: 1,910, with extended targets at 1,960 and 2,020
The 1,726 level serves as a critical pivot point, marking a previous consolidation zone. A pullback toward this level followed by a bullish rebound could reaffirm the uptrend and set the stage for a move toward the 1,910 resistance. A breakout above 1,910 would likely open the path to higher targets at 1,960 and 2,020 over the medium to long term.
On the other hand, a daily close below 1,726 would weaken the bullish structure and could trigger a deeper retracement toward 1,680 and potentially 1,620.
Conclusion:
ETH/USD remains in a bullish trend, but short-term consolidation may precede the next leg up. Traders should monitor the 1,726 support level closely—its defense could signal trend continuation, while a breakdown would increase downside risk.
This communication is for informational purposes only and should not be viewed as any form of recommendation as to a particular course of action or as investment advice. It is not intended as an offer or solicitation for the purchase or sale of any financial instrument or as an official confirmation of any transaction. Opinions, estimates and assumptions expressed herein are made as of the date of this communication and are subject to change without notice. This communication has been prepared based upon information, including market prices, data and other information, believed to be reliable; however, Trade Nation does not warrant its completeness or accuracy. All market prices and market data contained in or attached to this communication are indicative and subject to change without notice.

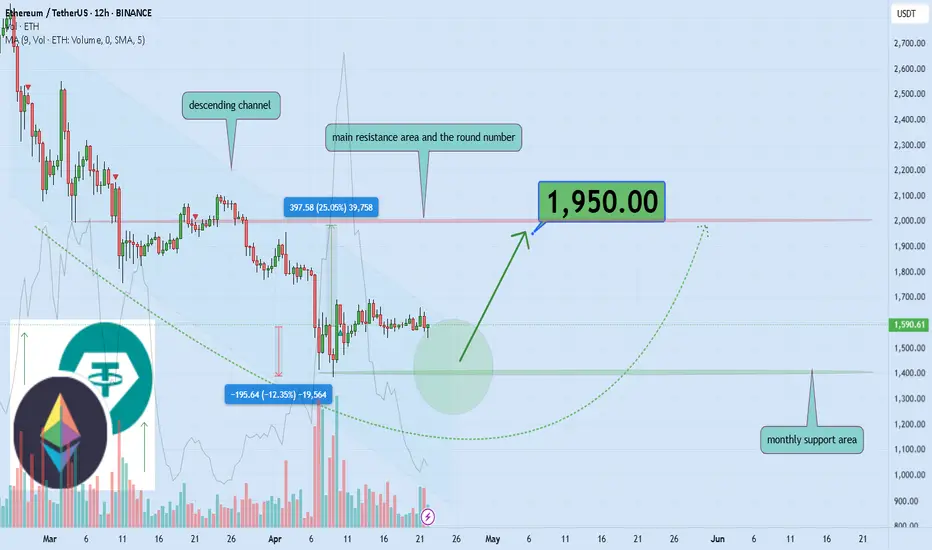
Ethereum Nears Breakout: Strong Support, $1950 Targeted NextHello and greetings to all the crypto enthusiasts, ✌
All previous targets were nailed ✅! Now, let’s dive into a full analysis of the upcoming price potential for Ethereum 🔍📈.
Ethereum has been trading within a downward cycle, but a short-term breakout above the descending channel appears likely. The price is approaching the key psychological level of $2,000, with a primary target of $1,950. This suggests a potential upside of at least 25% from a strong support zone.📚🙌
🧨 Our team's main opinion is: 🧨
Ethereum looks set to break out of its downtrend, eyeing the $2,000 mark with a main target of $1,950—about a 25% move up from strong support.📚🎇
Give me some energy !!
✨We invest hours crafting valuable ideas, and your support means everything—feel free to ask questions in the comments! 😊💬
Cheers, Mad Whale. 🐋
ETHUSD: 4H Golden Cross giving the strongest buy signal of 2025.Ethereum is about to turn bullish again on its 1D technical outlook (RSI = 54.924, MACD = 0.460, ADX = 35.736) as it completed a Golden Cross on 4H. This was the first 4H Golden Cross since October 17th 2024 and took place at the top of the 4 month Channel Down. We expect a bullish breakout next, aiming at the 0.786 Fibonacci retracement level (TP = 3,250).
## If you like our free content follow our profile to get more daily ideas. ##
## Comments and likes are greatly appreciated. ##

Ethereum CME Gaps: Inevitable Fill Zones Ahead Chart shows the daily Ethereum (ETH) futures on CME, highlighting three significant CME futures gaps—areas where price jumped due to the weekend market closure. These gaps are key zones where price has historically returned to “fill” the missing trading activity.
Gap 1 at $1,770 is the most recent and closest to the current price of $1,477, suggesting a possible short-term bullish move.
Gap 2 at $2,630 and
Gap 3 at $3,290 are higher up and reflect unfilled areas from previous market drops.
ETH is currently trading below all three gaps, creating a strong technical case for future upward movement. Sooner or later, these gaps will get filled. 🧘♀️

BTC - FVG + Golden Pocket Confluence = Short SetupA strategic high-timeframe imbalance meeting Fibonacci retracement, setting up a potential bearish reaction.
---
1. FVG + Golden Pocket — High-Value Supply Zone
The red shaded area defines a significant confluence:
- Fair Value Gap (FVG): Left behind by an aggressive drop, representing inefficiency where price is likely to react.
- Golden Pocket (0.618–0.65): High-probability Fibonacci retracement level, often acting as a magnet for liquidity before continuation.
This zone is primed to act as strong supply if price retraces into it.
---
2. 0.618–0.65 Fibonacci Retracement — Prime Rejection Zone
This Fib pocket offers:
- A technical level where aggressive buyers previously failed to hold ground.
- A common area where institutional players offload positions, triggering sell-offs.
A reaction inside this range aligns with broader bearish continuation expectations.
---
3. FVG Rebalance — Liquidity Collection
As price fills the inefficiency:
- It completes the rebalancing process, removing the incentive for further upward movement.
- Typically, liquidity grabs inside the FVG precede a sharp move back toward lower liquidity zones.
This supports the short bias post-rebalancing.
---
4. Expected Price Behavior — Liquidity Trap Mechanics
The projected move mirrors classical smart money behavior:
- Step 1: Induce late buyers into the FVG + Golden Pocket area.
- Step 2: Trigger a quick rejection after liquidity collection.
- Step 3: Resume downward pressure as imbalance is resolved.
The entire flow is designed to punish inefficient entries and reward patience.
---
5. Market Context Alignment
- FVG and Golden Pocket together strengthen the case for a precise, controlled rejection.
- Emphasis on liquidity-driven movements keeps the focus sharp on execution and timing.
---
6. Summary:
- FVG + Golden Pocket = Strong Supply Confluence
- High-Probability Short Setup Based on Rebalancing and Liquidity Collection
- Structured, Smart Money-Driven Price Behavior Expected
Tactically clean setup following liquidity engineering and imbalance theories.

Two Bullish Scenarios to Watch on ETHUSDTThis week, BINANCE:ETHUSDT has shown a significant upward movement, and there's a good chance it could continue its bullish momentum.
There are two bullish scenarios developing on BINANCE:ETHUSDT :
1. After a pullback, we could see an impulsive move that breaks the previous high (marked with the red arrow) and pushes the price towards the first target at 1,911 – 1,957.
2. The price could move sideways for a while, forming a bullish pennant pattern. In this case, a correction towards 1,756 – 1,731 might occur before the price resumes its move to the first target at 1,911 – 1,957.
Both scenarios remain valid as long as the price holds above 1,722.
If the second scenario plays out, the pullback to 1,756 – 1,731 can be considered a good buy zone (for those who are not in position yet).
Remember: wait for a confirmation candle before entering and place your stop-loss just below the confirmation candle.

Bearish drop off pullback resistance?Ethereum (ETH/USD) is reacting off the pivot and could drop to the 1st support.
Pivot: 1,808.27
1st Support: 1,451.43
1st Resistance: 2,102.09
Risk Warning:
Trading Forex and CFDs carries a high level of risk to your capital and you should only trade with money you can afford to lose. Trading Forex and CFDs may not be suitable for all investors, so please ensure that you fully understand the risks involved and seek independent advice if necessary.
Disclaimer:
The above opinions given constitute general market commentary, and do not constitute the opinion or advice of IC Markets or any form of personal or investment advice.
Any opinions, news, research, analyses, prices, other information, or links to third-party sites contained on this website are provided on an "as-is" basis, are intended only to be informative, is not an advice nor a recommendation, nor research, or a record of our trading prices, or an offer of, or solicitation for a transaction in any financial instrument and thus should not be treated as such. The information provided does not involve any specific investment objectives, financial situation and needs of any specific person who may receive it. Please be aware, that past performance is not a reliable indicator of future performance and/or results. Past Performance or Forward-looking scenarios based upon the reasonable beliefs of the third-party provider are not a guarantee of future performance. Actual results may differ materially from those anticipated in forward-looking or past performance statements. IC Markets makes no representation or warranty and assumes no liability as to the accuracy or completeness of the information provided, nor any loss arising from any investment based on a recommendation, forecast or any information supplied by any third-party.

Ethereum Potential UpsidesHey Traders, in today's trading session we are monitoring ETHUSDT for a buying opportunity around 1780 zone, Ethereum is trading in an uptrend and currently is in a correction phase in which it is approaching the trend at 1780 support and resistance area.
Trade safe, Joe.

#Ethereum + $10k Local top!#Ethereum + $10k Local top!
A real #Altcoins Season will only begin when CRYPTOCAP:ETH rises.
Whether you love it or hate it, it's just a fact and the truth is always bitter.
Ethereum Starts Moving Toward $7,000 With...Ethereum starts its next major advance towards a target of $7,000 and beyond with a full green candle this week.
This week is not only a full green candle signal it also cancels out the last two which produced a bottom and neutral signal, as well as recover more than three weeks of bearish action.
So now Ethereum is moving back to levels it traded back in late March, above $1,800. Going to this level means higher prices and this is only the start.
The 7-April week is such a strong clear reversal signal it is hard to explain. We have a Doji with a multi-year low, but this low ended with a green candle and confirmation comes this week as Ethereum turns full green. This is the last chance to get Ethereum below $2,000 and while prices are low.
When the next move happens, which is a close and confirmation above $1820, ETHUSDT will never trade at these prices and levels again, likely ever. It will grow and grow so much that nobody will be selling as much as they sold in the past. The start of a new long-term bullish cycle; the 2025 bull market.
I wanted to let you know that market conditions are green and you don't have to hold anymore. The market will start moving and produce a period of expansion that has not been seen in so long.
Even if you have experience with previous bull markets, it is hard to put in words. When it is happening it is so much different. It is not the same saying or knowing that Ethereum will grow as seeing it happen, and when it happens it goes more than what you think is possible or you are prepared for.
If for some reason you did not position yourself when the time was right, now, you will be thinking, "Why didn't I buy? The market was trading so low for long..."
You don't have to reach this point.
The charts are yours, the market is yours and you have experience.
You can take advantage of this situation and become a big winner in 2025 and beyond.
Many millionaires will be produced this year, will you be one of those?
I don't know but I am working hard.
Let's win together, we can do this with hard work, smart work and dedication.
Thanks a lot for your support.
Namaste.

BTC - Golden Pocket Confluence + FVG Sweep = Long SetupA highly refined scenario blending Fibonacci confluence with liquidity principles, setting up a controlled bullish play.
---
1. Golden Pocket + FVG Confluence — Critical Demand Zone
The blue highlighted area represents a strong confluence:
- FVG (Fair Value Gap): Imbalance left by aggressive price movement, likely to attract price for rebalancing.
- Golden Pocket: The 0.618–0.65 Fibonacci retracement zone, statistically favored for deep retracements and high-probability reversals.
Expecting strong buying interest once price taps into this confluence.
---
2. 0.618-0.65 Fib Range — Key Reversal Territory
The Fibonacci zone offers the perfect environment for engineered liquidity sweeps and smart money accumulation.
- This range often acts as a trap for retail shorts while institutions accumulate.
- A clean entry opportunity arises as price dips into this critical golden zone before expansion.
---
3. FVG Resistance Above — Initial Reaction Zone
A notable FVG resistance area is marked around 94,400–94,500:
- Upon reaching this zone, price may face initial selling pressure or short-term consolidation.
- Observing how price interacts here can further confirm bullish strength and continuation.
---
4. Smart Money Liquidity Play
The setup suggests a classic liquidity engineering move:
- Induce shorts through a pullback into the Golden Pocket.
- Absorb liquidity inside the FVG.
- Trigger a sharp bullish reversal aligned with institutional footprints.
This layered setup is clean, logical, and methodical.
---
5. Projected Price Flow
Anticipated price action structure:
- Step 1: Dip into the Golden Pocket + FVG demand zone.
- Step 2: Reversal toward the FVG resistance.
- Step 3: Breakout continuation upon reclaiming resistance, leading to further bullish expansion.
Each leg is mapped to follow high-probability liquidity behavior.
---
6. Summary:
- Golden Pocket + FVG = Prime Reversal Confluence
- Efficient Liquidity Sweep Mechanics
- Structured Bullish Progression Based on Smart Money Concepts
This plan is framed to capitalize on precision entries and liquidity dynamics without chasing price.

Ethereum Up 30% — But Is This the Start of a Trend Reversal..?Ethereum Up 30% — But Is This the Start of a Trend Reversal..?
Ethereum has seen a notable bounce this month, climbing approximately 30% from its local bottom of $1,400 to its current level around $1,800. While this rally might appear promising at first glance, a deeper look at the daily timeframe reveals a more cautious picture.
Despite the recent price surge, Ethereum remains technically in a **downtrend**. A well-respected downtrend continues to hold as resistance, and ETH is currently **retesting this trendline**. This point of contact now sets the stage for two potential scenarios:
**Scenario 1: Rejection from the Trendline**
If Ethereum fails to break above the trendline, it’s likely to face **rejection**, which could send the price back toward the $1,400 level. A revisit to this support zone would form a **potential double bottom**, a classic reversal pattern. If that plays out, we could then start to look for signs of a genuine trend reversal.
**Scenario 2: Breakout Above the Trendline**
On the other hand, if ETH manages to **break through the trendline**, that alone shouldn't be a green light to go long just yet. There’s a significant resistance level sitting around **$2,100**, which has previously acted as a ceiling for price action. A true breakout would require Ethereum not only to cross this level but also to **sustain above it for 2–3 days**. Only then could a long position be considered relatively safer, with upside targets extending to **$2,800** and even **$4,000**.
**Final Thoughts**
While the recent rally is encouraging, it's essential to remain cautious. The downtrend isn't officially over until key technical levels are cleared and held. Until Ethereum breaks above both the downtrend and the $2,100 resistance zone — and proves its strength with sustained movement — the **best strategy may be to sit on the sidelines** and let the market play out.
Patience often pays in crypto — and right now, **watching closely** could be the smartest move.

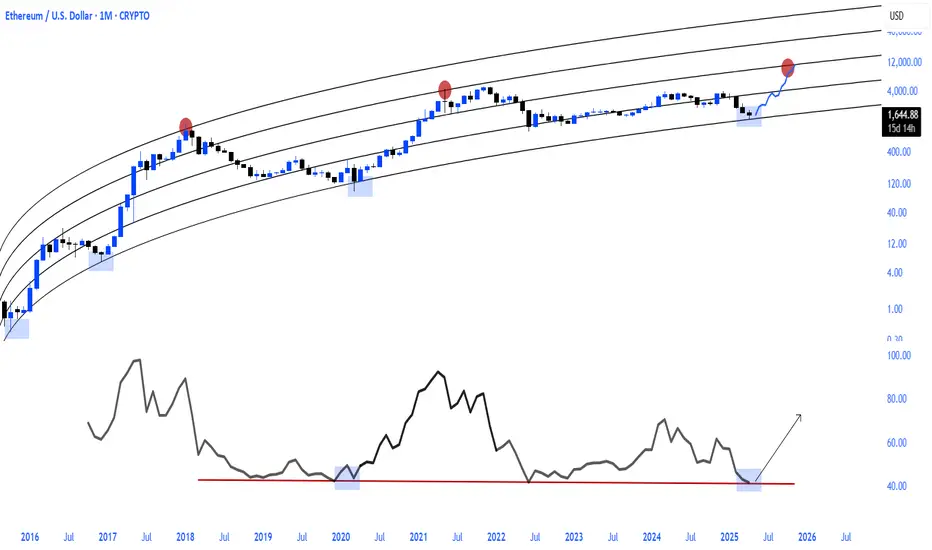
ETHBTC will supercede BTCs price growth % metrics. Time to SEED!ETH has been met with so much price gravity lately that it went to correct unbelievably from 4k+ to 1.5k.
Thats more than -3x of its peak price - an overextended trim compare to its peers like BTC which did a muted hibernation but still price remained afloat up there.
But hope is starting to arise from the latest price behavior. We are seeing some significant shift in trend. Net longs are starting to pile up from the current bargain price area -- conveying positioning of long term growth seekers. BTC is showing some massive break in structure as well showing some obvious signs of market recovery as a whole.
With this in mind, ETH metrics is becoming more and more attractive -- if we compare its possible price growth in terms of percentage and proportionality growth ratio.
ETHBTC will definitely benefit with this forthcoming growth ratio change.
Based on our diagram, we are already seeing some gradual shift -- a first sign of reversal to the upside. This can roll up soon and pace up its numbers.
Price is currently bouncing perfectly from its 6 year solid support. This is a massive hint already of things to come. GOOD THINGS.
Spotted at 0.0190
Target X10.
TAYOR. Trade safely.

Ethereum (ETH/USDT) – Elliott Wave Long-Term AnalysisBINANCE:ETHUSDT
📈 Ethereum (ETH/USDT) – Elliott Wave Long-Term Analysis
🕒 1W Chart – Macro Projection
According to my Elliott Wave count, Ethereum is currently completing a complex WXY correction in wave 4. The final leg, wave C of (Y), could drive the price down into the key support zone between $895 – $865, aligning with the 161.8% Fibonacci extension.
✅ Buy zone: $895 – $865
❌ Invalidation: sustained break below $865
🔴 Major resistance: $3,509
🚀 If the structure plays out, a powerful wave III-IV-V rally could follow, with long-term targets potentially above $9,000 by 2034.
This scenario remains valid as long as the corrective wave stays above the invalidation level. A bullish macro structure is still intact.
💬 Drop your thoughts or alternate counts in the comments!
🔁 Like & share for more ETH updates 🔥

Nobody appreciate it !!!Currently, ETH is forming an ascending triangle, indicating a potential price increase. It is anticipated that the price could rise, aligning with the projected price movement (AB=CD).
However, it is crucial to wait for the triangle to break before taking any action.
Give me some energy !!
✨We spend hours finding potential opportunities and writing useful ideas, we would be happy if you support us.
Best regards CobraVanguard.💚
_ _ _ _ __ _ _ _ _ _ _ _ _ _ _ _ _ _ _ _ _ _ _ _ _ _ _ _ _ _ _ _
✅Thank you, and for more ideas, hit ❤️Like❤️ and 🌟Follow🌟!
⚠️Things can change...
The markets are always changing and even with all these signals, the market changes tend to be strong and fast!!
