ETHUSD Market Analysis: Technical Indicators and Bearish SentimeAs of now, ETHUSD has dropped to $1,961, registering a daily decline of $94.9. Earlier, it exhibited robust upward momentum, surging past the $2,000 threshold. However, it has since experienced a pronounced downturn.
In terms of technical analysis, although the MACD doesn't clearly indicate a trend, its histogram has transitioned from positive to negative and is shrinking, suggesting that bullish strength is waning. The KDJ indicator, with a reading of 90, is in overbought territory. The 4 - hour candlestick chart reveals a substantial price drop relative to earlier levels. Even though the last candlestick is bullish, the overall market sentiment remains bearish.
Recently, trading volume has dwindled. The phenomenon of prices rising while volume falls indicates a significant weakening of upward momentum.
The market may be influenced by profit - taking from the previous rally, which has triggered a selling frenzy. Moreover, external factors like macroeconomic conditions and regulatory policies could also be at play. If key support levels, such as $1,874, fail to be reclaimed, bears are likely to retain their dominance. Investors should vigilantly monitor these support levels and prudently adjust their investment strategies.
ETHUSD
sell@1980-2000
tp:1900
buy@1850-1870
1930-1950
I will share trading signals every day. All the signals have been accurate for a whole month in a row. If you also need them, please click on the link below the article to obtain them.
Ethereum (Cryptocurrency)

Ethereum (ETH/USD) – Potential Breakout from Range Towards $2,50📊 Chart Insights:
ETH/USD is currently ranging near the $1,950 zone, following a consolidation phase.
A strong resistance zone is visible between $2,302 - $2,527, which has historically acted as a rejection point.
Support levels are established around $1,824 - $1,909, forming a strong base for price action.
A breakout above the current range could signal a bullish move toward the $2,302 resistance level, with a further target at $2,527.
📈 Trading Plan:
✅ Entry: Buy above $1,966 on confirmation of breakout.
🎯 Targets: $2,302 and $2,527 for profit-taking.
❌ Stop Loss: Below $1,909 to manage risk.
📉 Bearish Scenario: If ETH fails to hold $1,909, a retest of $1,824 is possible.
🔥 Ethereum could see a strong rally if momentum builds above resistance! Are you ready?

ETH Eyeing Bullish Targets: $2,244 & $2,380On the 4‑hour chart, ETH appears to be carving out a descending wedge pattern (often a bullish formation) while the RSI is trending upward from oversold territory. Here are the key points to watch:
1.Descending Wedge:
- Price has bounced near the lower boundary of the wedge around the mid‑$1,900s.
A break above wedge resistance (roughly in the $2,000–$2,050 zone) could trigger accelerated upside.
2.Fibonacci & Price Targets:
- Expect 1 (~$2,244): First target aligns with a measured move out of the wedge and a key Fib extension zone.
- Expect 2 (~$2,380): Second target corresponds to a higher Fib extension (2.0–2.272), marking a stronger bullish continuation if momentum holds.
3.RSI Confirmation:
- The 4‑hour RSI is turning upward, suggesting improving bullish momentum. A sustained move above 50–55 on the RSI would strengthen the case for further upside.
4.Pullback Risk:
- If ETH fails to break wedge resistance, it may retest support in the $1,900 area. A close below that could delay or invalidate the bullish setup.
Overall, ETH’s structure and momentum suggest a potential move toward $2,244 initially, with a push to $2,380 if buyers maintain control. A break above the wedge and sustained bullish RSI would be the clearest signals for continuation to these higher levels.

Falling towards pullback support?Ethereum (ETH/USD) is falling towards the pivot which has been identified as a pullback support and could bounce to the 1st resistance which acts as a pullback resistance.
Pivot: 1,940.23
1st Support: 1,827.50
1st Resistance: 2,107.47
Risk Warning:
Trading Forex and CFDs carries a high level of risk to your capital and you should only trade with money you can afford to lose. Trading Forex and CFDs may not be suitable for all investors, so please ensure that you fully understand the risks involved and seek independent advice if necessary.
Disclaimer:
The above opinions given constitute general market commentary, and do not constitute the opinion or advice of IC Markets or any form of personal or investment advice.
Any opinions, news, research, analyses, prices, other information, or links to third-party sites contained on this website are provided on an "as-is" basis, are intended only to be informative, is not an advice nor a recommendation, nor research, or a record of our trading prices, or an offer of, or solicitation for a transaction in any financial instrument and thus should not be treated as such. The information provided does not involve any specific investment objectives, financial situation and needs of any specific person who may receive it. Please be aware, that past performance is not a reliable indicator of future performance and/or results. Past Performance or Forward-looking scenarios based upon the reasonable beliefs of the third-party provider are not a guarantee of future performance. Actual results may differ materially from those anticipated in forward-looking or past performance statements. IC Markets makes no representation or warranty and assumes no liability as to the accuracy or completeness of the information provided, nor any loss arising from any investment based on a recommendation, forecast or any information supplied by any third-party.

USDT.DOMINANCE WEEKLY CHART UPDATE. Current Market Structure:
Breakout Confirmation: USDT Dominance has broken out of its descending trendline and is now in a retest phase.
50MA as Support: The 50-week moving average now acts as dynamic support, reinforcing the bullish outlook.
Rejection or Breakout? The price is currently testing resistance. If it gets rejected, a temporary pullback is likely before further gains.
If you found this analysis helpful, hit the Like button and share your thoughts or questions in the comments below. Your feedback matters!
Thanks for your support!
DYOR. NFA

The is still in a downtrend... Put it on a watch list. ETH is still in its downtrend. I am ready to flip bullish on alts as soon as I see this trend reverse. I will wait for those confirmations patiently. Market structure pivots require discipline. In the meantime DCA slowly.
Full TA: Link in the BIO
ETHUSD: Different asser, same pattern, same ending.Ethereum remains bearish on its 1D technical outlook (RSI = 40.440, MACD = -154.200, ADX = 29.206) but sits at the bottom of its 1 year Megaphone. This is the same pattern that Bitcoin traded on last year and Gold during its most recent Bear Cycle. In all instances, when the price found support on the MA50 and broke over the Megaphone, it reached the 2.0 Fibonacci. According to this, it won't be surprising if we see ETH at 9,000 by the end of the year.
## If you like our free content follow our profile to get more daily ideas. ##
## Comments and likes are greatly appreciated. ##

Bitcoin ($BTC) - Hoping for a Short-Term RolloverBitcoin bounced from the daily demand (76874.75-74306.67) that was highlighted in my "Bitcoin Uptrend Continuation" post from 5 days ago (see related post below). However, the rubber will now meet the road as BITSTAMP:BTCUSD could break higher or continue lower from current price. The in-play 1D sell zone, which is admittedly doesn't have great structure, is 86267.86-92920.42. Ideally, short-term CRYPTOCAP:BTC momentum, per the RSI, would be weaker than it is, but momentum is still soft per the daily oscillator. I'm not looking to short BTC blindly, but rather am stalking it via LTFs and will execute a confirmation short if evidence of the near-term uptrend (established 3/10) violation/termination materializes. If the intermediate-term downtrend continues, T2 = sub-$70K.
Anyway, just an idea. For those looking for longer-term buying opportunities, a near-term selloff should be viewed as a positive. Futures open in ~5 hours and can always be used to hedge longs if we get a breakdown.
Thanks for reading. Thoughts/feedback appreciated!
Jon
@JHartCharts

Bearer of Bad News - Short $XRPI originally posted this idea several days ago, but it was flagged b/c I linked one of my social media accounts. Apologies for any typos - the format of my post got jacked up after copying/pasting. Crypto's going to break one way or another from current levels. Bitcoin has a wide supply zone (not super strong) 86267.86-92920.42, so watch how it reacts...
Strictly technical setup here. Near-term demand/buy zones were good for bounces across the crypto space. However, buying has been fairly tepid. Given the technical structure for many crypto underlyings, this is unsurprising (addressed in CRYPTOCAP:DOGE ( COINBASE:DOGEUSD ), CRYPTOCAP:BTC , CRYPTOCAP:TOTAL ideas). Barring a catalyst, it seems more likely that crypto (and risk assets generally) will trade lower before higher.
Unfortunately for bulls, BITSTAMP:XRPUSD has levels of daily supply near current price. Per the 1D chart, sell zone = 2.3265-3.4106, 2.5032-2.6487. Additional sellers are likely lurking between 2.6487 and 3.0153, though LTFs need to be analyzed for identification. If the RSI is printing < 60/65 if/when price reaches the abovementioned ranges, CRYPTOCAP:XRP could roll over and commence another bearish impulse wave. Use micro-timeframes to watch for signs of uptrend violation/termination + to confirm any short entries/long exits.
To bolster positional confidence, observe other cryptos, especially larger market caps. Correlative behavior can be a very helpful trading "odds enhancer". If other majors rally w/ significant volume/momentum, XRP will likely follow. Conversely, if BITSTAMP:BTCUSD , BITSTAMP:ETHUSD ( CRYPTOCAP:ETH ), etc. fizzle out, expect XRP to do the same.
If this idea materializes and shorts regain control, daily demand = 1.5414-1.2843, 1.1222-1.0033. Fib retracements reinforce the aforementioned buy zones. Because of the explosive nature of XRP's 2024 rally, the monthly/weekly charts have "tradeable voids" (expanded-range candlesticks). While traditional technicals tout large candles, they're a double-edged sword. Their elongated nature is often reflective of limited trading and gaps in order flow, which can have a vacuum-like effect if/when prices correct. It's great when you're on the right side of the trade creating the candles, but there's also not a lot of unfilled orders to stop price from moving rapidly in the opposite direction. So, if XRP sells off, don't be surprised if price moves quickly.
I'm a fan of confirmation entries vs. "catching a falling knife". Referencing RSI momentum + using micro-TFs to ID trend reversal signals can help prospective buyers reduce risk (and/or increase position size). When volatility strikes, preservation is paramount.
Thanks for reading! Feedback/engagement welcome.
Jon

UNIUSDT Buy SignalUNI Buy signal on H1 chart. This coin has strong bullish outlook on all Timeframes. Risk reward 1/3

BNBUSDT BuyBinance coin has consolidation on H4 chart, between 560 - 630 levels. now price is on the resistance and tries to break it to reach 690 level. Risk reward 1/2

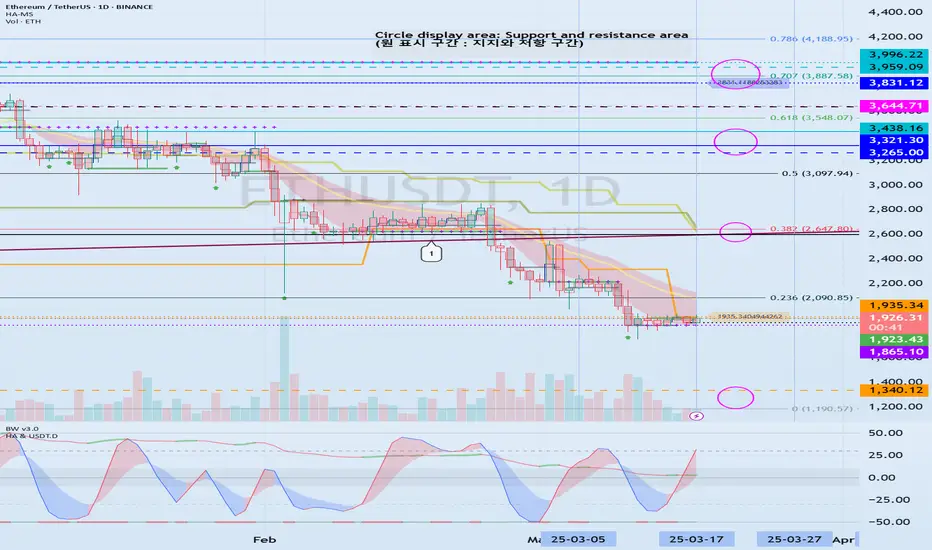
The key is whether there is support near 1935.34
Hello, traders.
If you "Follow", you can always get new information quickly.
Please also click "Boost".
Have a nice day today.
-------------------------------------
(ETHUSDT 1D chart)
The important support and resistance zones have changed as it has fallen below the long-term upward trend line (1).
After March 18, the key is whether ETH can maintain its price by receiving support near 1935.34 and rising above the M-Signal indicator on the 1D chart, that is, the Fibonacci ratio of 0.236 (2090.85).
If it falls after receiving resistance near 1935.34, it is possible that it will fall to around 1340.12, so you should also consider a response plan for this.
-
In order to turn into an uptrend, the price must rise above the M-Signal indicator on the 1M chart and maintain it.
To do so, the price must be maintained near the Fibonacci ratio of 0.382 (2647.80).
-
Therefore, if it rises after receiving support near 1935.34,
1st: M-Signal on the 1D chart (Fibonacci ratio of 0.236 (2090.85))
2nd: M-Signal on the 1M chart (Fibonacci ratio of 0.382 (2647.80))
You should respond depending on whether there is support near the 1st and 2nd above.
Currently, the StochRSI indicator is showing signs of entering the overbought zone, so even if there is an additional rise, it is expected to eventually show a downward trend.
In order to ignore this law, an explosive trading volume or favorable market news is required.
-
(30m chart)
Since the StochRSI indicator is in the oversold zone, it is highly likely to rise even if it continues to fall further.
However, since it is a 30m chart, you should respond based on day trading or short-term trading.
Since the HA-High (1936.67) indicator and the BW (100) (1944.96) indicator are located near 1935.34, we can see that it is forming a resistance zone.
Therefore, even if there is an additional rise, it seems likely to be resisted in this resistance zone (1936.67-1944.96).
If it falls below 1923.43,
1st: Heikin Ashi's Close on the 1D chart
2nd: HA-Low indicator (1885.30)
3rd: 1865.10
We need to check if it is supported near the 1st-3rd above.
-
Therefore, if it is supported and rises near 1935.34,
1st: M-Signal on 1D chart (Fibonacci ratio 0.236 (2090.85))
2nd: M-Signal on 1M chart (Fibonacci ratio 0.382 (2647.80))
You need to respond depending on whether there is support near the 1st and 2nd above.
Since the StochRSI indicator is currently showing signs of entering the overbought zone, it is expected that it will eventually show a downward trend even if there is an additional rise.
In order to ignore this law, an explosive trading volume or favorable market conditions must occur.
-
Thank you for reading to the end.
I hope you have a successful trade.
--------------------------------------------------
- Big picture
I used TradingView's INDEX chart to check the entire range of BTC.
(BTCUSD 12M chart)
Looking at the big picture, it seems to have been maintaining an upward trend following a pattern since 2015.
In other words, it is a pattern that maintains a 3-year upward trend and faces a 1-year downward trend.
Accordingly, the upward trend is expected to continue until 2025.
-
(LOG chart)
Looking at the LOG chart, you can see that the upward trend is decreasing.
Accordingly, the 46K-48K range is expected to be a very important support and resistance range from a long-term perspective.
Therefore, we expect that we will not see prices below 44K-48K in the future.
-
The Fibonacci ratio on the left is the Fibonacci ratio of the uptrend that started in 2015.
In other words, it is the Fibonacci ratio of the first wave of the uptrend.
The Fibonacci ratio on the right is the Fibonacci ratio of the uptrend that started in 2019.
Therefore, it is expected that this Fibonacci ratio will be used until 2026.
-
No matter what anyone says, the chart has already been created and is already moving.
How to view and respond to this is up to you.
When the ATH is updated, there are no support and resistance points, so the Fibonacci ratio can be used appropriately.
However, although the Fibonacci ratio is useful for chart analysis, it is ambiguous when used as support and resistance.
This is because the user must directly select the important selection points required to create Fibonacci.
Therefore, since it is expressed differently depending on how the user specifies the selection points, it can be useful for chart analysis, but it can be seen as ambiguous when used for trading strategies.
1st : 44234.54
2nd : 61383.23
3rd : 89126.41
101875.70-106275.10 (Overshooting)
4th : 134018.28
151166.97-157451.83 (Overshooting)
5th : 178910.15
-----------------
ETH to keep up with BTC?ETH has not delivered on expectations this season, not even an ATH while many of the coins and BTC went bonanza.
Currently sitting close to its local resistance, it needs a clear breakout pattern to show strength.
On the lower levels, I see $3000 as a weakened and $2800 as a strong support area which should hold.
I think everything will be green after mid Feb but lets see :)
Short term target $3800, midterm target around $5400.

MSTR: Is 300 Enough?MicroStrategy is seeing tremendous strength off the lows along with the rest of the crypto space. We are eyeing this 300 level to see if it offers a proper buy zone to coincide with Bitcoin 85,000 which has also seen tremendous outperformance relative to equities. Watch the overhead trendline drawn here as well as Bitcoin 90,000 for profit takes or continuations. We will decide which if and when we get there.

ETHEREUM -Weekly forecast,Technical Analysis & Trading IdeasMidterm forecast:
While the price is above the support 1521.00, beginning of uptrend is expected.
We make sure when the resistance at 2090.33 breaks.
If the support at 1521.00 is broken, the short-term forecast -beginning of uptrend- will be invalid.
BITSTAMP:ETHUSD MARKETSCOM:ETHEREUM
Technical analysis:
A trough is formed in daily chart at 1750.30 on 03/11/2025, so more gains maximum to Major Resistance (2090.33) is expected.
Take Profits:
2362.31
2546.73
2801.10
3042.75
3516.43
3741.60
4107.80
4500.00
4868.00
__________________________________________________________________
❤️ If you find this helpful and want more FREE forecasts in TradingView,
. . . . . . . . Hit the 'BOOST' button 👍
. . . . . . . . . . . Drop some feedback in the comments below! (e.g., What did you find most useful? How can we improve?)
🙏 Your support is appreciated!
Now, it's your turn!
Be sure to leave a comment; let us know how you see this opportunity and forecast.
Have a successful week,
ForecastCity Support Team

(JASMY) jasmycoinDGT pattern indicator featuring elliott waves. Green diamond is major oversold, green triangles is minor oversold, same for peaks only circles and so on. I'm seeing a lot of oversold signals in cryptocurrency using this indicator, including Ethereum, the blockchain Jasmy is run on as a layer 2 token IoT company.

Bitcoin's Wild Ride: Will It Moon or Crash and Burn?Ah, Bitcoin—the digital rollercoaster we all love to hate. Currently lounging around $84,000 , but what's next? Let's dive into the crystal ball of crypto predictions, shall we? 🔮
The Bullish Dreamers:
Derivatives Delight: Some analysts are giddy over derivatives metrics, suggesting Bitcoin is "poised" to reclaim the $90,000 level in the coming weeks. Because who doesn't love a good gamble?
The Bearish Realists:
Death Cross Drama: Hold onto your hats! Bitcoin is flirting with a "death cross," where the 50-day moving average dips below the 200-day. Historically, this is like the crypto version of a horror movie—cue the dramatic music.
Support Level Shenanigans: If Bitcoin can't muster the strength to stay above $81,000, we might be sliding down to $76,000 faster than you can say "HODL."
The Fence-Sitters:
FOMC Follies: All eyes are on the upcoming Federal Open Market Committee meeting. Will they hike rates? Will they cut? Will they order pizza for lunch? Their decisions could send Bitcoin on a joyride or a nosedive.
So, what's the takeaway? Is Bitcoin gearing up for a moon mission, or are we strapping in for a freefall? As always, keep your wits about you, and maybe a parachute handy. 🎢🪂
If you want the deeper breakdown (the one nobody’s telling you), drop a comment or DM me. Maybe I’ll let you in on the real insights. 👀🔥
Disclaimer: This is not financial advice. Always do your own research before diving into the crypto abyss.

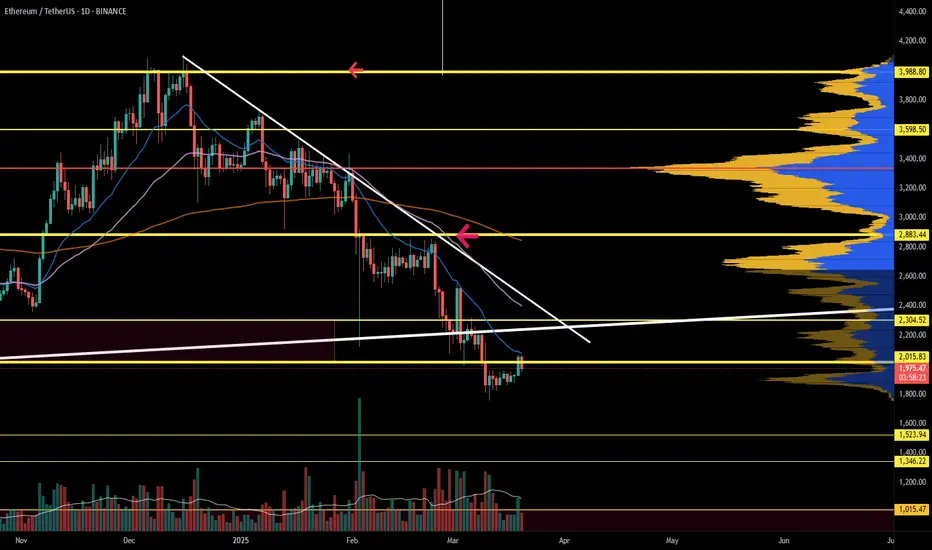
Ethereum (ETH/USD) Breakout – Next Targets $2,328 & Beyond!
Overview:
Ethereum has been in a downtrend, forming a descending channel, but it recently found strong support at $1,764 and has now broken out of a range-bound consolidation. This could be the beginning of a bullish move towards higher resistance levels.
Key Market Structure Analysis:
🔸 Previous Downtrend: ETH was trading within a bearish channel, creating lower highs and lower lows before bottoming out.
🔸 Accumulation Phase: A sideways consolidation range between $1,764 - $2,017 formed after the downtrend, signaling potential accumulation.
🔸 Breakout Confirmation: ETH has broken above the $2,017 resistance, suggesting that buyers are stepping in.
Potential Trade Setup:
✅ Bullish Scenario:
A successful breakout retest around $2,000 - $1,950 could provide an entry opportunity.
Upside targets:
🎯 $2,328.95 – Major resistance level from previous price action.
🎯 $2,559.17 – Next key resistance if momentum continues.
⚠️ Bearish Scenario (Invalidation):
A drop below $1,950 - $1,900 could push ETH back into the previous range.
Losing the $1,764 support could lead to a retest of $1,600 or lower.
Final Thoughts:
Ethereum is showing strength after breaking out of a key consolidation range. If the breakout holds, ETH could be gearing up for a strong rally toward $2,328 - $2,559. However, a retest of the breakout zone may provide a better risk-to-reward entry.
What do you think? Will ETH push toward $2,328 next? Drop your thoughts below! 🔥📈

ETH is bullish (1D)Before anything else, you should know that Ethereum's structure in higher time frames is bearish. However, we currently expect an internal pullback to higher levels because the price has reached a significant zone.
The expectation is that the price will move from the mitigated demand zone toward the targets.
A daily candle closing below the invalidation level will invalidate this analysis.
Do not enter the position without capital management and stop setting
Comment if you have any questions
thank you

ETH Looks Bullish (1D)Before anything else, you should know that Ethereum's structure in higher time frames is bearish. However, we currently expect an internal pullback to higher levels because the price has reached a significant zone.
The expectation is that the price will move from the mitigated demand zone toward the targets.
A daily candle closing below the invalidation level will invalidate this analysis.
Do not enter the position without capital management and stop setting
Comment if you have any questions
thank you

ETHEREUM Megaphone bottom like March 2020Ethereum (ETHUSD) is currently on the first week of rebound after 3 straight red weeks when it was unable to break above the 1W MA50 (blue trend-line). This is taking place on a Lower Lows trend-line, technically the bottom of a 1-year Megaphone since the March 11 2024 High.
The market is no stranger to long-term Megaphone consolidation periods like that as last time we saw this was on the June 2019 - March 2020 Megaphone, which eventually broke upwards after the brutal COVID crash Bearish Leg that touched bottom. This is quite similar to the current Bearish since late December. Notice how perfectly aligned the Fibonacci retracement levels are.
Based on this, we expect at least a 1.5 Fibonacci extension test at $6000 before this Cycle tops at the end of the year.
-------------------------------------------------------------------------------
** Please LIKE 👍, FOLLOW ✅, SHARE 🙌 and COMMENT ✍ if you enjoy this idea! Also share your ideas and charts in the comments section below! This is best way to keep it relevant, support us, keep the content here free and allow the idea to reach as many people as possible. **
-------------------------------------------------------------------------------
💸💸💸💸💸💸
👇 👇 👇 👇 👇 👇

ETH Analysis (1D)Ethereum is approaching a support level.
The risk-to-reward ratio is not very attractive since we are in a bearish trend, but we expect a reaction to the green zone.
There are two targets ahead of the price, which we have marked on the chart.
A daily candle closing below the invalidation level will invalidate this analysis
For risk management, please don't forget stop loss and capital management
Comment if you have any questions
Thank You

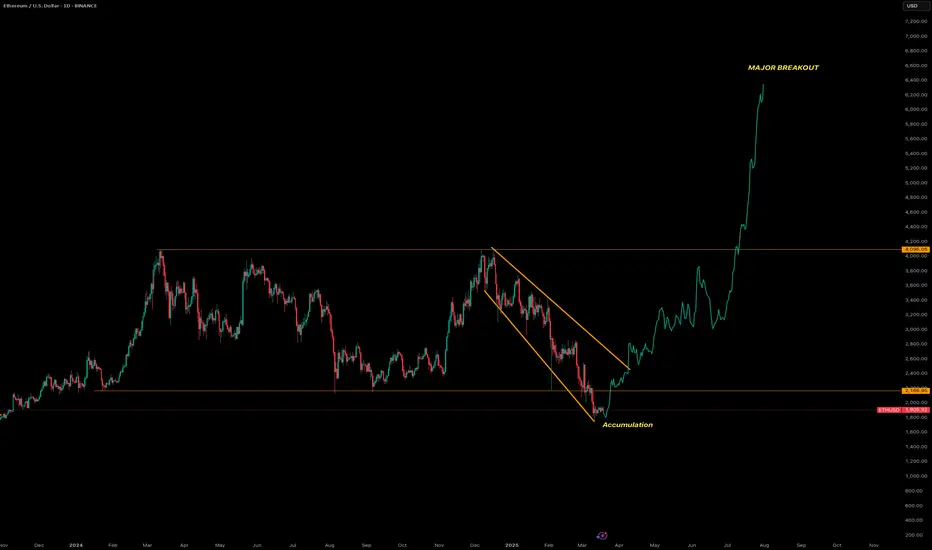
Ethereum will make a major Breakoutanalysis the chart
Let’s analyze the provided Ethereum (ETH/USD) chart on a daily timeframe from TradingView, focusing on the key technical elements and trends:
1. Overall Trend
The chart displays a significant bullish trend for Ethereum, with the price rising from around $2,200 in early 2024 to approximately $4,000 as of the latest data point (March 18, 2025).
The upward movement is marked by a sharp breakout, indicating a strong shift in momentum from consolidation to a rapid ascent.
2. Price Levels and Targets
Current Price: Approximately $4,000, with a previous support/resistance zone around $2,200.
The chart highlights a major breakout above the descending triangle pattern, suggesting potential for further upside, though no specific price target is explicitly labeled beyond the current level.
3. Technical Patterns
Descending Triangle: The chart features a descending triangle pattern, typically considered a bearish continuation pattern. However, the recent price action has broken out upward through the upper resistance line (around $2,200-$2,500), invalidating the bearish outlook and turning it into a bullish reversal signal.
Accumulation Phase: A clear accumulation zone is marked near the lower boundary of the triangle (around $2,200), where the price consolidated before the breakout. This suggests strong buying interest built up at this level, supporting the subsequent rally.
4. Support and Resistance
Support: The $2,200 level, which acted as the lower boundary of the triangle, now serves as a potential support zone if the price pulls back. This level could be retested as new support following the breakout.
Resistance: The next resistance is not explicitly marked, but the rapid upward move suggests the price may face selling pressure around previous highs (e.g., $4,500-$5,000) or psychological levels like $5,000, based on Ethereum’s historical behavior.
5. Volume and Momentum
Volume data isn’t shown, but the steep upward slope post-breakout indicates significant buying pressure and momentum. A breakout with high volume would further confirm the strength of this move.
6. Timeframe and Projection
The chart spans from late 2023 to mid-2025, with the major breakout occurring around early 2025. The sharp rise suggests this bullish momentum could continue in the short to medium term, potentially pushing Ethereum toward new all-time highs (above $4,800, its previous peak).
7. Key Observations
The upward breakout from the descending triangle is a powerful bullish signal, often indicating a reversal of prior bearish pressure and the start of a new uptrend.
The accumulation phase near $2,200 reflects a period where buyers absorbed selling pressure, setting the stage for the breakout.
Potential risks include a pullback to retest the broken resistance (now support) at $2,200-$2,500, or overextension if the rally lacks consolidation. Monitoring for overbought conditions (e.g., via RSI or other indicators) could be prudent.