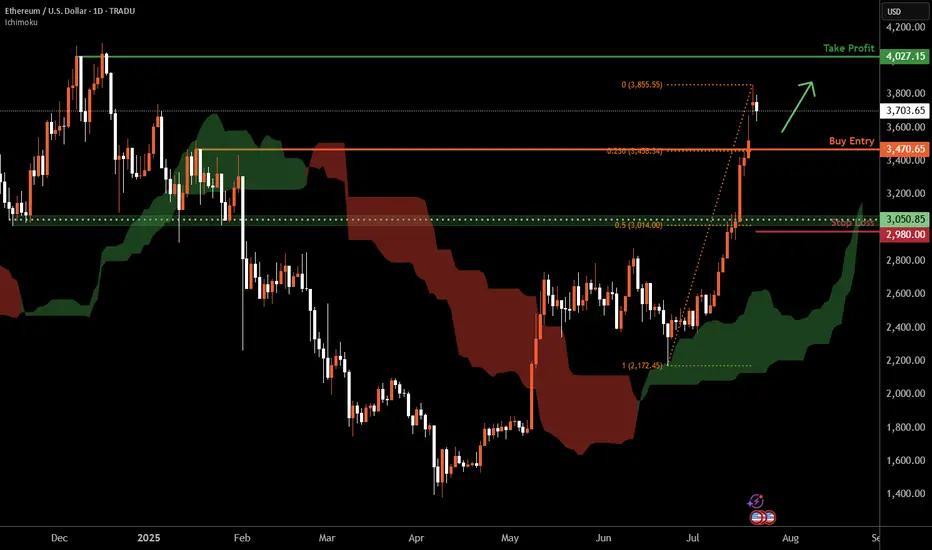
Ethereum D1 | Potential bullish bounceEthereum (ETH/USD) is falling towards a pullback support and could potentially bounce off this level to climb higher.
Buy entry is at 3,470.65 which is a pullback support that aligns with the 23.6% Fibonacci retracement.
Stop loss is at 2,980.00 which is a level that lies underneath a a pullback support and the 50% Fibonacci retracement.
Take profit is at 4,027.15 which is a multi-swing-high resistance.
High Risk Investment Warning
Trading Forex/CFDs on margin carries a high level of risk and may not be suitable for all investors. Leverage can work against you.
Stratos Markets Limited (tradu.com ):
CFDs are complex instruments and come with a high risk of losing money rapidly due to leverage. 66% of retail investor accounts lose money when trading CFDs with this provider. You should consider whether you understand how CFDs work and whether you can afford to take the high risk of losing your money.
Stratos Europe Ltd (tradu.com ):
CFDs are complex instruments and come with a high risk of losing money rapidly due to leverage. 66% of retail investor accounts lose money when trading CFDs with this provider. You should consider whether you understand how CFDs work and whether you can afford to take the high risk of losing your money.
Stratos Global LLC (tradu.com ):
Losses can exceed deposits.
Please be advised that the information presented on TradingView is provided to Tradu (‘Company’, ‘we’) by a third-party provider (‘TFA Global Pte Ltd’). Please be reminded that you are solely responsible for the trading decisions on your account. There is a very high degree of risk involved in trading. Any information and/or content is intended entirely for research, educational and informational purposes only and does not constitute investment or consultation advice or investment strategy. The information is not tailored to the investment needs of any specific person and therefore does not involve a consideration of any of the investment objectives, financial situation or needs of any viewer that may receive it. Kindly also note that past performance is not a reliable indicator of future results. Actual results may differ materially from those anticipated in forward-looking or past performance statements. We assume no liability as to the accuracy or completeness of any of the information and/or content provided herein and the Company cannot be held responsible for any omission, mistake nor for any loss or damage including without limitation to any loss of profit which may arise from reliance on any information supplied by TFA Global Pte Ltd.
The speaker(s) is neither an employee, agent nor representative of Tradu and is therefore acting independently. The opinions given are their own, constitute general market commentary, and do not constitute the opinion or advice of Tradu or any form of personal or investment advice. Tradu neither endorses nor guarantees offerings of third-party speakers, nor is Tradu responsible for the content, veracity or opinions of third-party speakers, presenters or participants.
Ethereum (Cryptocurrency)
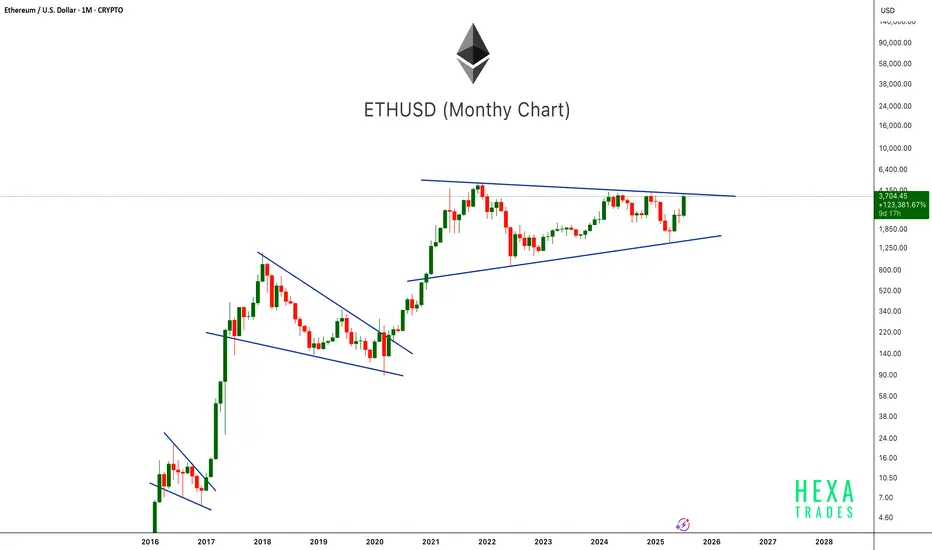
ETH Ready to Pop!ETHUSD is once again testing the upper boundary of a long-term symmetrical triangle on the monthly chart. This pattern has been forming since the 2021 peak, showing consistently higher lows and lower highs. Previous breakouts from similar consolidation patterns (2017 and 2020) led to massive rallies. With the current monthly candle showing strong bullish momentum, a confirmed breakout above this structure could mark the beginning of Ethereum's next major bull run. Keep an eye on the breakout level for confirmation.
Cheers
Hexa
12R setup forming on SUITime to send it after that big channel retest? Clean 12R setup
Entry: 4.0
SL: 3.9
Target: 5.2

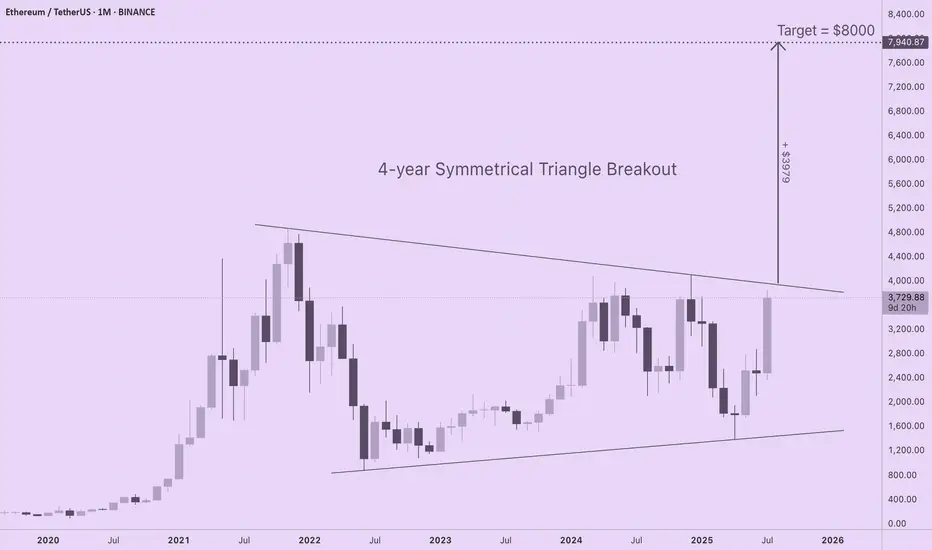
ETH Targets $8000 with 4-Year Symmetrical Triangle BreakoutIf you are seeking realistic ETH price targets based upon solid long-term market structure, check out this 4-year symmetrical triangle forming on the ETH/USD monthly chart. ETH is coiling for a major move to $8000, yet none of the CT "influencers" I follow are talking about this. I am new to technical analysis, so I am interested in learning your thoughts about this pattern and which tools or indicators you prefer for setting price discovery targets.
For those of you new to technical analysis, symmetrical triangle patterns can form on long timeframes (weeks, months, or years), indicating indecision between bulls and bears as price compresses within a continually narrowing range. A breakout from a symmetrical triangle typically follows the direction that preceded their formation, and the longer the consolidation period, the stronger the move.
The chart shows a strong euphoric phase in 2021 followed by a bear market low. Subsequent failure to reach previous ATHs is balanced by a pattern of higher lows. Since ETH was in an uptrend prior to triangle formation, odds are this is a continuation pattern, especially given profound shifts in capital flows and sentiment for the asset over the last several weeks.
With trendlines set at the price extremes, the height of the triangle is roughly $3980. If a breakout occurs at a price of $3960, ETH will target a price of $7940 (height of triangle + breakout price). A more conservative price target of $7000 is obtained by resetting the trendlines at the monthly opening and closing prices (omitting the wicks).
Regardless of the specific method for drawing the triangle, ETH is primed for a major move to the upside that has been four years in the making.
ETHEREUM Resistance Ahead! Sell!
Hello,Traders!
ETHEREUM is trading in a strong
Uptrend and the coin has grown
By more than 70% since the last low
So the coin is locally overbought
And after it retest the horizontal
Resistance of 4100$ we will be
Expecting a local bearish correction
Sell!
Comment and subscribe to help us grow!
Check out other forecasts below too!
Disclosure: I am part of Trade Nation's Influencer program and receive a monthly fee for using their TradingView charts in my analysis.

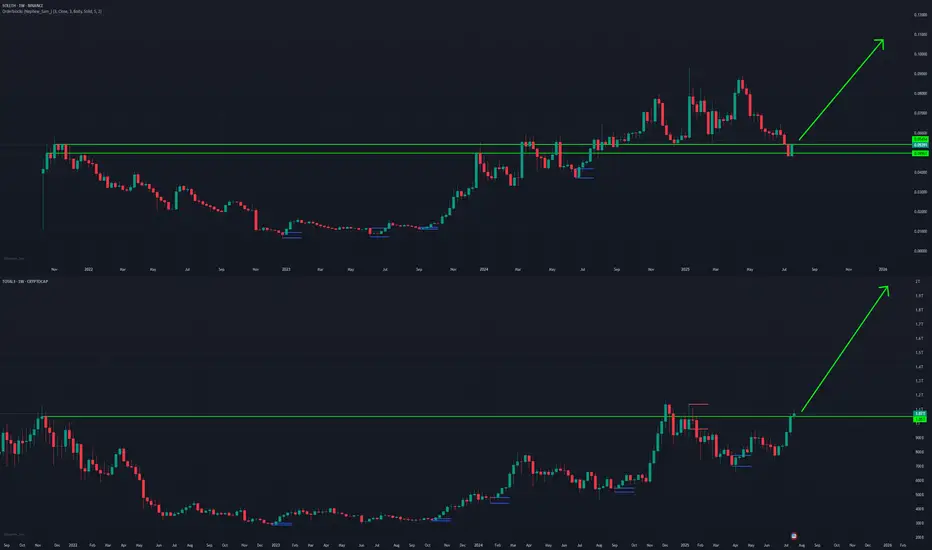
ALT SEASON Cycle Finale Special | SOL/ETH & TOTAL3Our last analysis of BTC.D ⬇️ and ETH/BTC ⬆️ () is now playing out, and we are entering the final stage of the 4-year crypto cycle -- ESCAPE VELOCITY for the rest of the crypto market.
As money flows up the risk curve, expecting SOL to outperform ETH from here, and the rest of the crypto market to outperform majors.
Welcome to the cycle finale special!
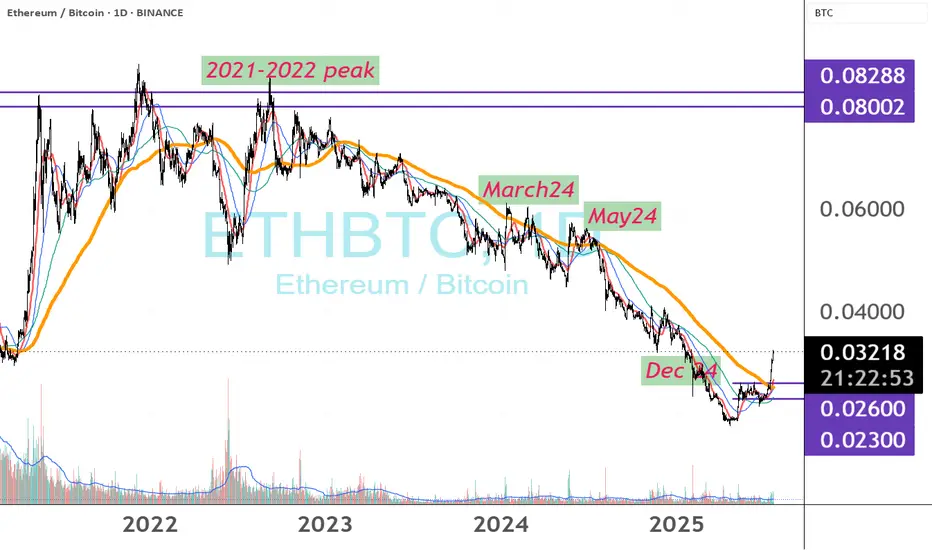
ETHBTC , what if?ETH/BTC has just pushed above 0.026 on the 200‑day MA, indicating ETH’s relative strength against BTC, despite ETH still trading under $4,000.
Unlike the $4,000 rallies in March, May and December 2024—when ETH/BTC never truly broke out—this move shows genuine outperformance.
If Bitcoin holds at about $120K, revisiting the 2021–22 ETH/BTC high would put ETH near $9.6K.
Historical peaks for reference:
2018: ETH/BTC ≈ 0.12 → ETH ≈ $14,400
2017: ETH/BTC ≈ 0.15 → ETH ≈ $18,000
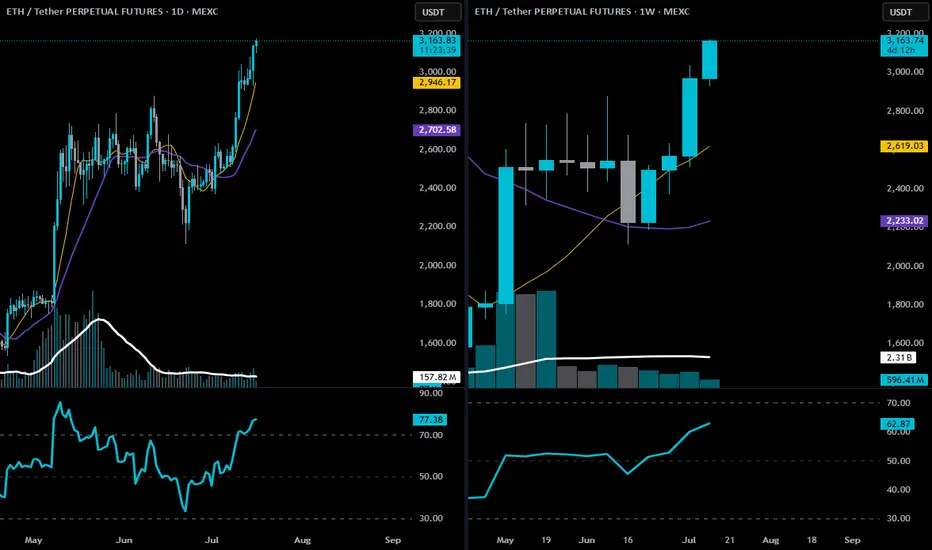
ETH-technical structure, momentum, and confirmation🕐 Daily Chart Analysis
Trend: Clear uptrend. Price is trading well above both the 9 EMA (gold) and 20 EMA (purple), with strong angle and separation.
Price Action: ETH is pressing into multi-month highs with no major resistance between here and the $3,350–$3,500 range.
Volume: Healthy increase in volume on bullish candles; recent bullish expansion looks organic, not low-volume driven.
RSI: At 77.15 — yes, overbought, but in a trending market, this is confirmation, not a sell signal. You want RSI to stay elevated during impulsive legs.
📅 Weekly Chart Analysis
Breakout Structure: This is the second full bullish candle after breaking out of a multi-month base ($2,800 range), following an accumulation period.
9 EMA Just Crossed Over 20 EMA: First time since early 2024 — bullish trend confirmation.
Volume: Large expansion bar from May shows institutional interest; current bar remains strong and building.
RSI: Pushing up to 62.75 — well below overbought, meaning there’s room to run.
🧭 Strategic Trade Plan (Swing Long)
✅ Bias: Long
Targeting $3,300–$3,500 with trailing logic to extend if momentum continues.
THIS IS NOT FINANCIAL ADVICE. Drinkin Smöökëē Whizkee. Edumacational Purpiz Only!
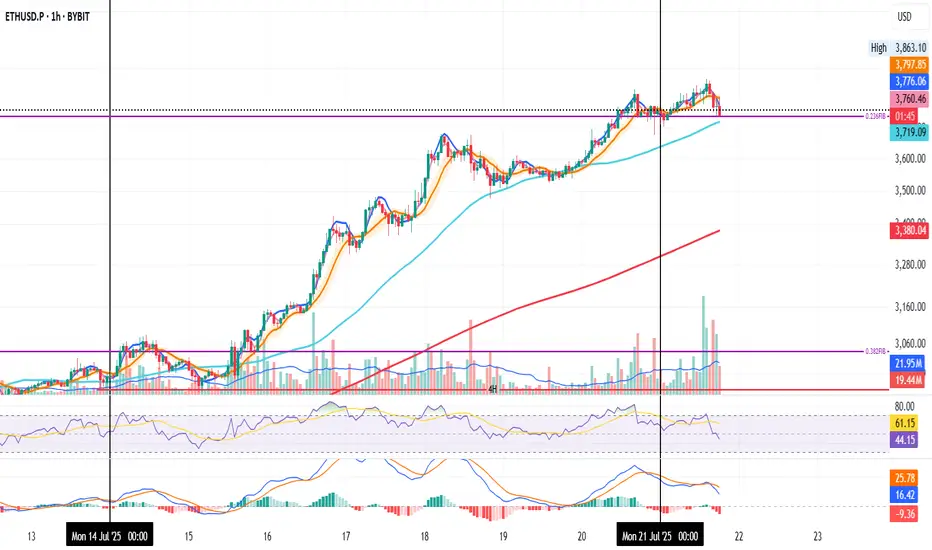
ETH on the 1H and the 0.236 Fib level
Could be a retest. Could be a fakeout. Could be the start of a move down.
RSI and MACD are both dropping.
SMA < MLR < BB Center confirms a downtrend.
50MA is sitting below the Fib level.
200MA is far below at $3,400, but rising quickly.
If tonight’s candles start closing under the Fib level, the warning gets louder.
If not, more upside remains likely.
Always take profits and manage risk.
Interaction is welcome.
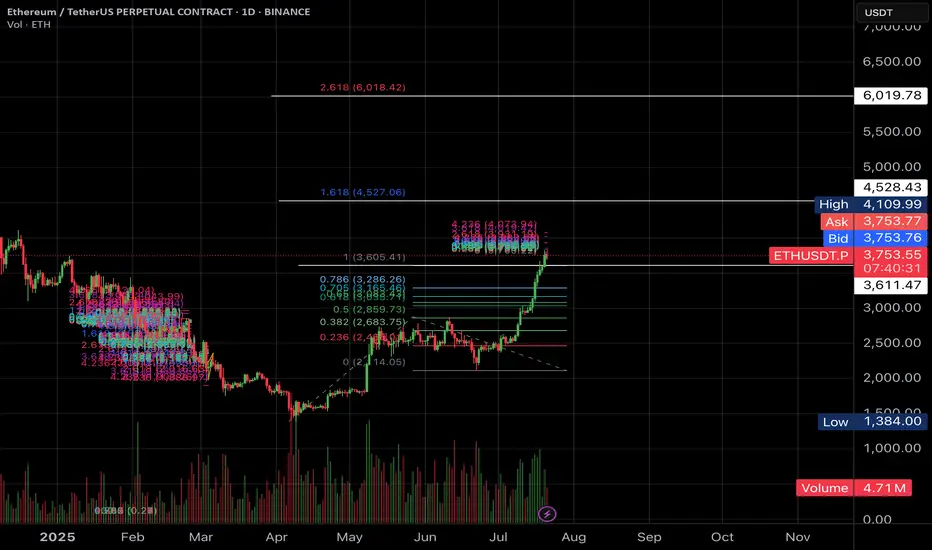
$6000 worth ETH?Hi Padawans,
ETH is showing strong bullish momentum, currently trading around $3,766. If it breaks above the resistance near $4,500–$4,900, the 2.618 Fibonacci extension points to a potential target around $6,000.
Best Regards,
CryptoObi
Ethereum: Breakout Holds Strong | Next Targets $4K, $7K+Last week, three major crypto bills cleared the U.S. House of Representatives—and Ethereum (ETH) is emerging as the biggest winner from this legislative momentum.
ETH recently broke out of a rounding bottom pattern and hasn’t looked back. Momentum continues to build, and it’s now outperforming most other major assets.
📈 Technical Highlights:
✅ Short-term target: $4,000
✅ Long-term potential: $7,000–$8,000
🛡️ Key support: $2,700–$2,800 (bullish as long as this holds)
📣 Takeaway:
Ethereum’s breakout remains intact. Pullbacks into support could offer high-probability setups for swing traders and long-term investors.
#Ethereum #ETHUSD #Crypto #Trading #TechnicalAnalysis #CryptoTrading #EthereumPrice #Altcoins #Bullish #Breakout

ETH: Huge Reversal or Correction Still in the Horizon?The recent price action in Ethereum (ETH) has left market participants questioning its next major move. With volatility high and sentiment shifting, is ETH headed for a massive reversal, or is a correction still looming on the horizon?
Key Points to Consider
Macro Environment: Global markets are facing uncertainty from shifting interest rates and regulatory developments in crypto. These factors may spark continued volatility for ETH in the near term.
Technical Analysis: ETH has many analysts watching key support and resistance areas. A clean break above resistance could signal a reversal, while a failure to hold recent gains may suggest a correction is not over yet.
On-Chain Data: Activity on the Ethereum network, including DeFi usage and staking patterns, can offer clues as to whether accumulation or distribution is taking place.
Market Sentiment: Traders remain divided, with some calling the recent bounce a bull trap, and others anticipating renewed upside momentum.
My Take
While the case for a reversal is gaining strength, the possibility of a broader correction can’t be dismissed. It’s crucial for investors to stay alert, watch the charts, and position size accordingly. I'm not longing any crypto in the short run...As for the long run, extremely BULLISH!
*not investment advice*
#Ethereum #Crypto #Investing #MarketAnalysis #Web3 #crypto #bitcoin #trading

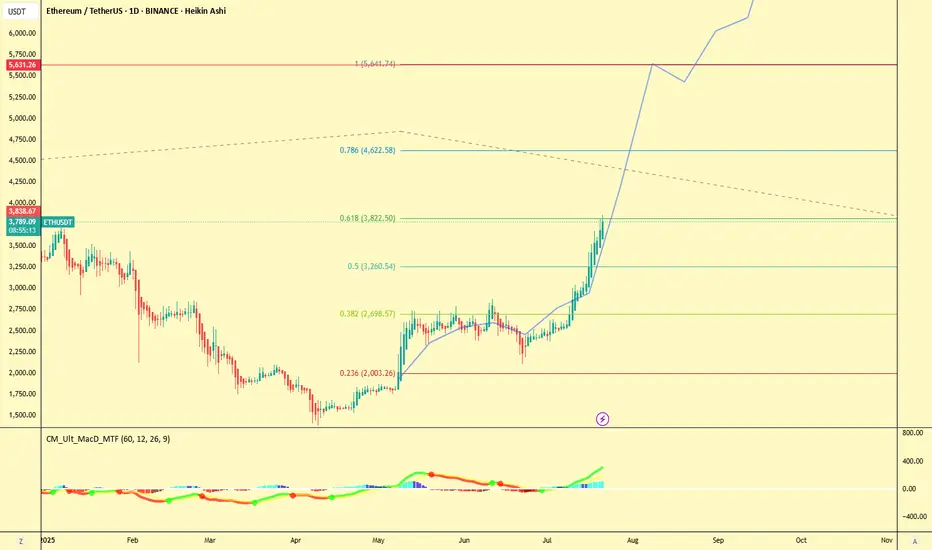
ETH not stopping at 4k > TARGET 5.6KChart displays the next cycle by combining the last cycle's path inside the fib extension tool.
Going to keep it cool and ride the whole wave up.
Good luck everyone
If this plays out, I'll share the 2 other targets.
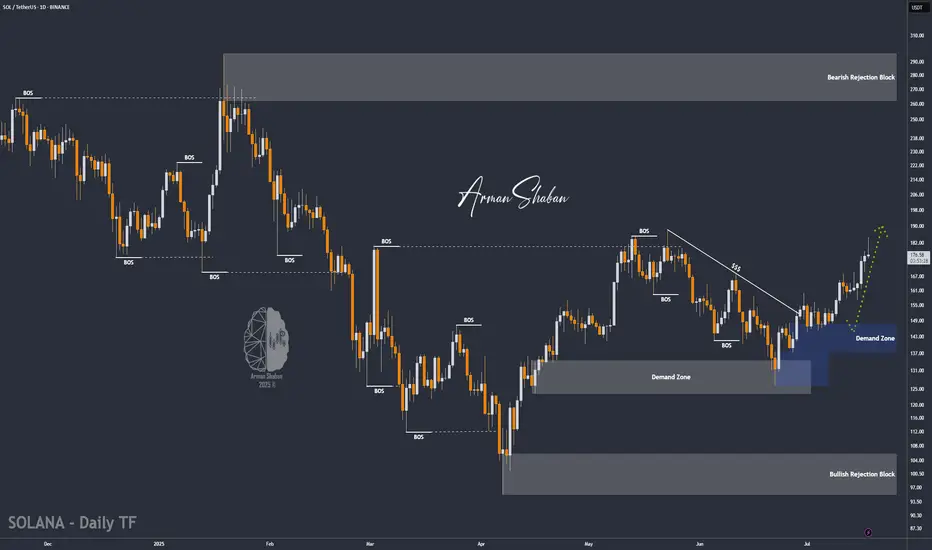
SOL/USDT | Next Bullish Leg Ahead if Key Support (READ)By analyzing the Solana chart on the daily timeframe, we can see that today the price climbed to $184, almost hitting the next target at $187, before facing a correction. It is currently trading around $176. If Solana manages to hold above the key support zone between $168 and $174, we can expect the next bullish leg to start, potentially extending up to $227. The previous analysis remains valid, with the next upside targets at $187, $220, and $263.
Please support me with your likes and comments to motivate me to share more analysis with you and share your opinion about the possible trend of this chart with me !
Best Regards , Arman Shaban
DOGE/USDT : eyes More Gains – Mid-Term Targets Up to $0.70! By analyzing the Dogecoin chart on the daily timeframe, we can see that since our last analysis around 7–8 months ago, the price started its rally from $0.10 and surged over 370% to reach $0.48. After that, it corrected back to around $0.13 and is currently trading near $0.27. If Dogecoin manages to hold above $0.25, we can expect further upside movement in the mid-term. The next targets are $0.287, $0.32, $0.41, and $0.70.
Please support me with your likes and comments to motivate me to share more analysis with you and share your opinion about the possible trend of this chart with me !
Best Regards , Arman Shaban

$Eth Ethereum nearing critical resistance....All Time High soon!This is a weekly candlestick chart of ETHUSD
Current price: 3800
CRYPTOCAP:ETH Ethereum recently broke out of a long-term downtrend, indicated by the red diagonal trendline. Price action has shifted from bearish to bullish. This is also a show of strong Momentum as recent candles are large and green, showing aggressive buying (strong bullish pressure).
If #eth continues in this uptrend then here are the resistance above to watch: 4000, 4800 and possibly new all time highs at 5600, 6400
Note worthy to know that the areas between 3800-4000 is very critical resistance.
Assuming a retracement from this resistance, Ethereum remain bullish above 2900
Invalidation of this idea is under 2900

Major Coins and Crypto Stocks Pump — Thank Landmark GENIUS BillBitcoin BITSTAMP:BTCUSD making ATHs? Old news. But Coinbase NASDAQ:COIN and Robinhood NASDAQ:HOOD hitting those record-high notes? And XRP BITSTAMP:XRPUSD dangerously close to eclipsing its own peak, while Ethereum keeps chugging along toward $4,000? Now we’re talking.
In a market-friendly twist, President Trump signed the GENIUS Act into law on Friday — a sweeping legislative win for crypto. Short for Guiding and Establishing National Innovation for US Stablecoins, the GENIUS Act marks the first major federal framework for digital assets and, more importantly for traders, triggered a firestorm of price action across the space.
Flanked by crypto executives, Republican lawmakers, and a few NFT bros in suits, Trump called the stablecoin-focused bill “perhaps the greatest revolution in financial technology since the birth of the internet.” Bold claim. But judging by what the market’s doing — he might actually be onto something.
The bill, passed 308 to 122 in the House, lays the groundwork for US banks to issue their own stablecoins and create a regulatory moat that finally separates innovation from legal whack-a-mole.
But wait, that’s not all. The House also passed the CLARITY Act and the Anti-CBDC Surveillance State Act. The first one will help determine if cryptos will be considered securities and the second one bans the Federal Reserve from issuing its own coin.
🚀 Crypto Market Cap Hits $4 Trillion
As the bill cleared Congress and Trump picked up the pen, the entire crypto market cap exploded past $4 trillion for the first time in history with the orange coin holding more than 60% of the market .
It wasn’t just Bitcoin BITSTAMP:BTCUSD making noise (although it did quietly retest $120,000 boasting a $2.4 trillion valuation, or more than that of Google parent Alphabet NASDAQ:GOOGL ).
The real momentum was coming from the stocks and altcoins — especially those with exposure to the suddenly green-lit US regulatory scene.
📈 Coinbase: To the Moon and Beyond
Let’s talk about Coinbase, ticker symbol NASDAQ:COIN , and now also, apparently, ticker symbol 🚀.
Shares surged over 8% on Friday to hit a new record session high of $445, giving the US-based exchange a market cap of over $100 billion. Not bad for a company that spent most of 2022 playing dodgeball with the SEC.
The GENIUS Act (and its siblings) cleared a path for institutional crypto adoption — and no one stands to gain more than Coinbase. It’s the go-to exchange for institutional custody and compliance. And now, with banks dipping their toes into stablecoin waters, guess who gets to facilitate those flows? Exactly.
Coinbase has now rallied over 63% year-to-date, putting it back into market darling territory — and giving early bulls a solid reason to post their PnLs again.
📊 Robinhood: Meme Stock No More?
Wait, what’s that clamor? It’s the “HOOD to $100” crowd dusting off their 2021 hats.
Robinhood NASDAQ:HOOD also saw a serious lift from the legislative push — hitting an all-time session high of $113 on Friday. The shares are up 180% in 2025 alone.
While most remember Robinhood for its meme stock legacy, the app has quietly built a towering crypto trading platform in the US. And now, with Congress cracking open the stablecoin lane and clearing legal fog, it’s suddenly a real contender in the digital asset arms race.
Add to that Trump’s pledge to dismantle crypto-hostile policies from the previous administration (many of which affected Robinhood’s crypto operations), and it’s no wonder the stock is flying.
💰 Stablecoins: Boring Coins Are Now Big Biz
You’d be forgiven for snoozing through most stablecoin headlines. After all, they don’t moonshot or do anything but sit idle.
But make no mistake — this is where the real money’s watching. JPMorgan CEO Jamie Dimon, not known for casual crypto endorsements, said last week his bank will now be “involved in both JPMorgan deposit coin and stablecoins.”
That’s a seismic shift. For years, traditional banks sat on the sidelines while Circle CRYPTOCAP:USDC and Tether CRYPTOCAP:USDT built billion-dollar stablecoin empires. Now, thanks to the GENIUS Act, the door is open for regulated banks to issue digital dollars backed by FDIC-level trust — and potentially eat into the DeFi-native players’ lunch.
Boring’s about to get very profitable.
💥 XRP: Return of the Ripple?
You know it’s a bull market when XRP BITSTAMP:XRPUSD shows up uninvited and still gets the VIP booth.
The one-time courtroom drama token surged over 60% in the past two weeks, hitting $3.50 and inching dangerously close to its all-time high. Ripple’s comeback arc may finally be getting its payoff.
With legal pressure fading and Congress setting new guardrails for digital assets, XRP’s regulatory risks just got a lot less scary. Plus, institutions looking for faster cross-border rails may find XRP’s network a bit more attractive when Washington’s no longer breathing down its neck.
🐂 Ethereum: Quietly Eyeing $4,000
Ethereum BITSTAMP:ETHUSD might not be making headlines like Bitcoin or XRP, but don't let the quiet confidence fool you.
ETH has been rising steadily, gaining almost 50% in the last two weeks, and Monday morning was trading just shy of $3,800. With regulatory uncertainty waning, and the market treating Ether more like an investment than a utility token, it’s slowly reclaiming its 2025 highs.
Factor in the growing number of ETH-based ETFs , tokenized real-world assets (hello, Treasury bills onchain), and the boom in stablecoins running on Ethereum rails… and you’ve got a slow-burn bull case building brick by brick.
🦅 Washington, WAGMI?
So, what’s the takeaway?
For the first time, Congress passed crypto legislation that didn’t come with a hidden poison pill. The GENIUS Act, along with the CLARITY Act, have made more legislative progress in a week than years of courtroom wrangling and ETF lobbying combined.
Trump, with his pro-crypto stance and deep industry ties (after all, he did launch his own coin not too long ago), just turned crypto into a political weapon — and a market darling. Is 2025 shaping up to be the year Washington went full Web3?
Let’s hear it from you : Drop your thoughts in the comments and let’s spin up the discussion.

ETHUSD heading towards the top of the D1 frame✏️ CRYPTO:ETHUSD is in a strong uptrend towards the resistance zone of the 3800 daily frame. There are not many conditions for the sellers to jump in and reverse the current trend. Wait for the price reaction at the resistance of the D1 frame to consider the SELL strategy. Because currently if BUY is too Fomo.
📉 Key Levels
Sell trigger: Rejection from 3800
Target 3400, potentially 3,380
Leave your comments on the idea. I am happy to read your views.

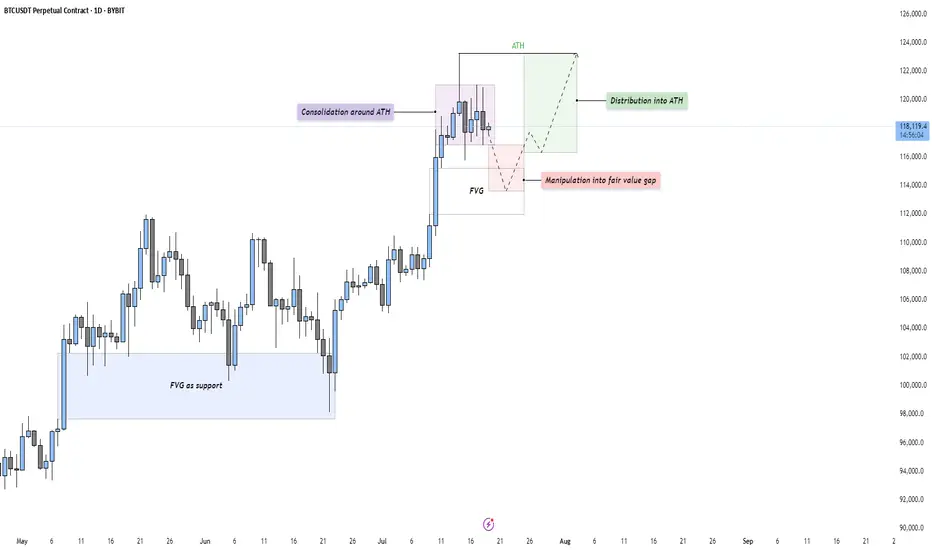
BTC - Consolidation, Manipulation & DistributionMarket Context
After a strong impulsive rally, Bitcoin is currently consolidating just beneath its All-Time High (ATH). This type of consolidation following an extended move higher often indicates indecision in the market — a pause that either leads to continuation or reversal. The current structure suggests that price is building energy for the next leg.
Consolidation and Liquidity Above ATH
The price action is tight and sideways around the ATH, which likely means liquidity is building above. Many stop-losses and breakout orders are sitting just overhead — classic conditions for a Buy Side Liquidity Sweep. This range may serve as a trap for early breakout traders, providing an opportunity for smart money to manipulate price lower before taking it higher.
Fair Value Gap Retest Scenario
Below the current range, we see a Daily Fair Value Gap that aligns with prior bullish imbalances. A move down into this Gap would represent a manipulation phase — shaking out weak longs before rebounding. The Gap also acts as a potential support level where buyers might be waiting. If price reaches into this zone and reacts strongly, it may offer a high-probability long setup.
Distribution or Reaccumulation?
While this could be interpreted as distribution beneath resistance, it’s equally valid to consider it a reaccumulation phase — a temporary markdown into demand before a fresh expansion. If the market dips into the Gap and quickly reclaims the range, it opens the door for a clean breakout above the ATH and continuation toward the 124,000–126,000 region.
Final Thoughts
Price rarely moves in a straight line. It pauses, retraces, and often tricks participants before making the real move. This type of consolidation presents opportunity — but also demands patience and clarity.
If you found this breakdown insightful, a like would be much appreciated! And I’d love to hear your thoughts in the comments — are we about to sweep down into demand, or is the rocket already on the launchpad?
Ethereum at Crucial Resistance – Will the Bulls Hold or Fade?Ethereum at Crucial Resistance – Will the Bulls Hold or Fade?”
Ethereum is currently trading near a key resistance zone around $3,800, as marked on the chart. After a strong bullish rally with clear Break of Structures (BOS) along the way, ETH has now reached an extended point where price may face selling pressure.
The Bollinger Bands are stretched, showing overextension, and the marked arrow suggests a possible correction or pullback from this level. A retest of previous support zones (~$3,400–$3,200) could be expected if the resistance holds.
⸻
Key Levels:
• 🔼 Resistance: ~$3,800
• 🔽 Support: ~$3,400 / ~$3,000
• 🔄 Price Action: Watching for rejection or breakout confirmation
This is a textbook case of price approaching a strong resistance level after a bullish wave, where caution and confirmation are key for the next move.

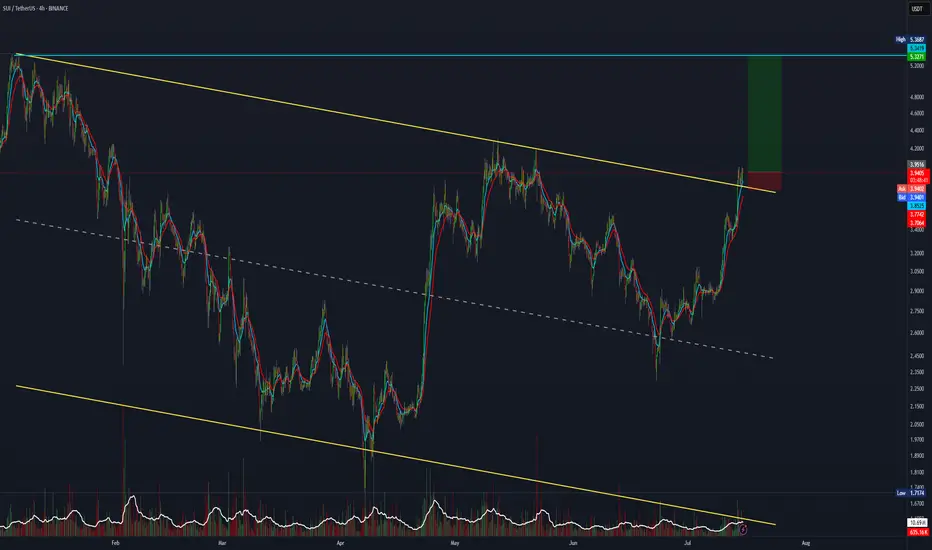
SUI trade setup with a 7:1 risk-to-reward ratio.SUI has broken out and retested the major channel. If you're bullish, this 7:1 R:R setup is worth considering.
Entry: 3.94
Stop Loss: 3.77
Target: 5.30.
ETH/USD Breaking Higher, Can Fill The Gap? Hey traders,
Some of the altcoins are recovering very nicely today, with Ethereum being no exception. In fact, we’ve seen a pretty nice consolidation on ETH over the last three weeks, and it looks like it’s breaking to the upside right now. I wouldn’t be surprised to see more gains unfolding into wave five of a five-wave advance away from the April lows.
Targets around 3000 and even 3300 could be quite interesting, especially if we consider the big gap that dates back to February.
GH

ETH-----Buy around 3600, target 3660 areaTechnical analysis of ETH contract on July 18:
Today, the large-cycle daily level closed with a small positive line yesterday, the K-line pattern continued to rise, the price was above the moving average, and the attached indicator was running in a golden cross. The general trend of rising is still relatively obvious. Recently, you can see that Ethereum is stronger than the big cake, and the continuous high-breaking prices are getting closer and closer to the previous historical highs. So this month there is a chance to touch or test; the short-cycle hourly chart rose strongly in the morning and broke the previous day's high position. The current price is above the moving average, and the attached indicator is running in a golden cross. The intraday and European sessions still depend on the trend of continuing to break high.
Today's ETH short-term contract trading strategy:
Buy in the 3600 area, stop loss in the 3570 area, and target the 3660 area;
