Bullish continuation?The Ethereum (ETH/USD) is falling towards the pivot and could bounce to the 1st resistance.
Pivot: 3,471.00
1st Support: 3,039.91
1st Resistance: 4,094.93
Risk Warning:
Trading Forex and CFDs carries a high level of risk to your capital and you should only trade with money you can afford to lose. Trading Forex and CFDs may not be suitable for all investors, so please ensure that you fully understand the risks involved and seek independent advice if necessary.
Disclaimer:
The above opinions given constitute general market commentary, and do not constitute the opinion or advice of IC Markets or any form of personal or investment advice.
Any opinions, news, research, analyses, prices, other information, or links to third-party sites contained on this website are provided on an "as-is" basis, are intended only to be informative, is not an advice nor a recommendation, nor research, or a record of our trading prices, or an offer of, or solicitation for a transaction in any financial instrument and thus should not be treated as such. The information provided does not involve any specific investment objectives, financial situation and needs of any specific person who may receive it. Please be aware, that past performance is not a reliable indicator of future performance and/or results. Past Performance or Forward-looking scenarios based upon the reasonable beliefs of the third-party provider are not a guarantee of future performance. Actual results may differ materially from those anticipated in forward-looking or past performance statements. IC Markets makes no representation or warranty and assumes no liability as to the accuracy or completeness of the information provided, nor any loss arising from any investment based on a recommendation, forecast or any information supplied by any third-party.
Ethereum (Cryptocurrency)

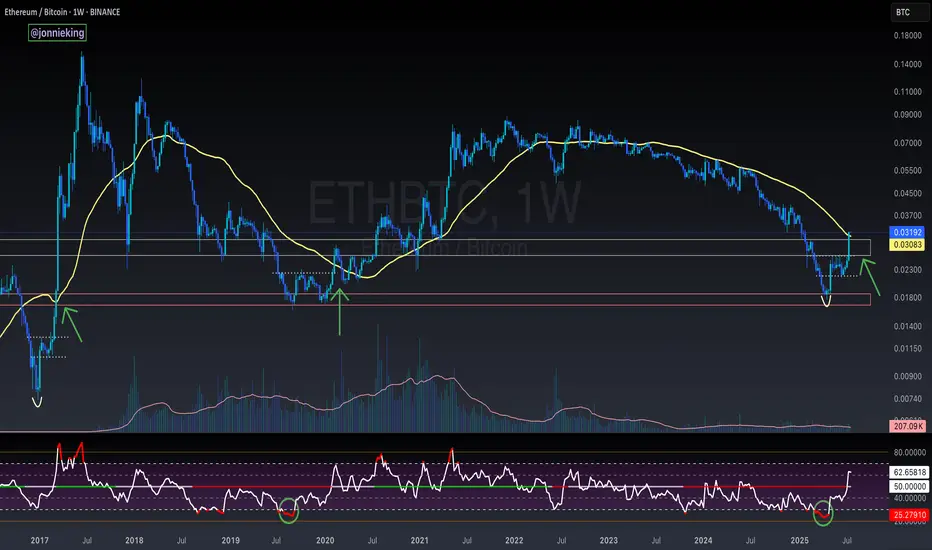
$ETH Closes Above the 50WMA - Alt Season Signal ALT SEASON ALERT 🚨
CRYPTOCAP:ETH Closed the Week ABOVE the 50WMA
Historically this has signaled the start of ALT SEASON.
*NOTE* 2020 had the pandemic hiccup.
This bottoming pattern looks very similar to the 2017 explosion.
Also the RSI matches the 2019 bottom.
Dare I call it yet bros? 🤓
ETH Weekly Recap & Game Plan 20/07/2025📈 ETH Weekly Recap & Game Plan
🧠 Fundamentals & Sentiment
Market Context:
ETH continues its bullish momentum, driven by institutional demand and a supportive U.S. policy environment.
We captured strong profits by sticking to the plan (see chart below).
🔍 Technical Analysis
✅ Price has run into HTF liquidity at $3,750
📊 Daily RSI has entered the overbought zone, signaling potential short-term exhaustion.
We may see a brief retracement or LTF liquidity grabs, which could be enough to fuel a further push higher — potentially to $4,087.
🧭 Game Plan
I’m watching two key downside liquidity levels:
$3,534 (black line)
$3,464
A sweep of either could provide the liquidity needed for continuation toward $4,087.
⚠️ I’ll wait for LTF confirmation before entering a position.
📌 Follow for Weekly Recaps & Game Plans
If you find this analysis helpful, follow me for weekly ETH updates, smart money insights, and trade setups based on structure + liquidity.

Ethereum is going to 2000 then new ATH
Alright, let's talk about what I see coming for Ethereum. I’ve been deep-diving into these charts, especially that weekly one where I’ve highlighted the past moves and percentages. I'm using these patterns as a guide to try and anticipate where Ethereum is heading next. I'm going to set aside any kind of trading advice, and focus on what I see the market doing next.
Key Observations From Past Cycles
Looking at Ethereum's history, I’m seeing a pretty clear cycle of large price swings:
Massive Rallies: Ethereum has a history of powerful bull runs, where the price can surge by hundreds, or even thousands of percent. I need to be aware of these to understand the potential of the coin.
Substantial Corrections: These rallies are always followed by substantial corrections, which range from about 30%, to upwards of 80%. This is important to see as any retracement can be devastating to a trader.
My Prediction For The Next Move:
Based on those historical patterns, here’s what I see as the most probable outcome for Ethereum's next move:
Anticipated Retracement: I’m expecting a retracement, or a pullback following the recent gains. Ethereum tends to make large retracements after a period of growth, and I am anticipating this will happen again soon. I want to see the price find a solid level of support, as this will be important to the next move up. Based on historical price action, I expect the next support levels to be somewhere around $2000 to $2500.
The Next Upside Move: After that pullback, I anticipate a strong upside move.
The magnitude of this move is unclear, but the data on the chart shows we could be looking at a move upwards of 100%, and maybe even more. I want to be watching that very carefully when it happens.

ETH 1H – Breakout or Bull Trap ?
ETH just broke above the 0.236 Fib with a strong push.
✅ Trend structure remains bullish:
MLR > SMA > BB Center.
But something feels off...
🔍 Volume surged late — likely short liquidations.
OBV didn’t confirm — it's still lagging.
RSI is extended. Structure looks tired.
Could be a liquidity grab above recent highs.
If price closes back below the Fib, momentum could fade fast.
📌 Key zones to watch on a pullback:
– 1H 50MA
– Previous support clusters
We’ll be here to watch it unfold.
Always take profits and manage risk.
Interaction is welcome.

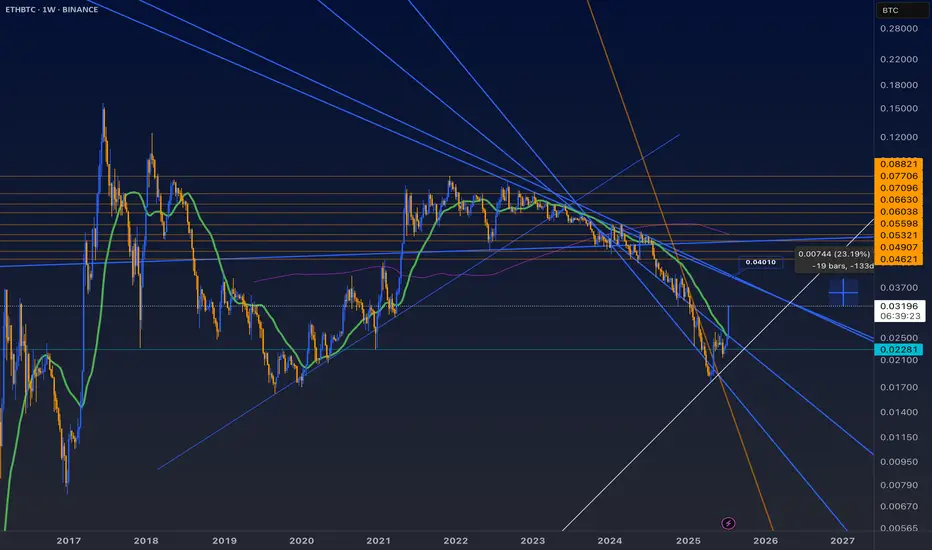
ETH/BTC 25-7-20I think there’s some clear headroom for more movement to 0.40 Ethereum per Bitcoin. Let’s see but right now is hot. Then the support after the 0.400 resistance is hit is back at 0.22, but who know what the price of Bitcoin would be at that point.
Eth and the Altcoin Season Once Etherum retest and breaks previous cycle ATH and LMACD visits the diagonal traced from previous cycles (white dot). An altcoins season might follow.

ETH Season?Well, in all of its history Ethereum’s recent lows remind me the most of December 2019 while the recovery after reminds me the most of the bull rally after March 2020. Either way I think the time for ETH and crypto as a whole is very near. Here’s my charted roadmap. If BTC hit a new high and then some over a whole year already since it hit a new high, then how do we not expect ETH to do the same and probably amplified as well as certain alt coins too. Curious to see how this thesis plays out. Not financial advice

Jul 20 | Crypto-market reviewNew Crypto-Sunday market review video, where I share my current analysis on the trend structures of BTC, ETH, SOL, XRP, HYPE and other alt- and mem-coins of interest to my, highlighting key support and resistance zones to watch in the coming sessions.
Charts featured in the video
BTC
ETH
XRP
(!) SOL
(!) HYPE
(!) TRUMP
BRETT
(!) FET
RENDER (Weekly)
(!) DOG
(!) MOG
Thank you for your attention and I wish you happy Sunday and great trading week!
If you’d like to hear my take on any other coin you’re tracking — feel free to ask in the comments (just don’t forget to boost the idea first 😉)

ETH is up about 50% Since June 2025Relying on the absolute intraday low from June to claim that ETH is “up 70%” is a textbook data‑skewing mistake often found in AI‑generated headlines. A more robust approach is to average prices over several days (or even a full week). On that basis, ETH has risen roughly 50% since June— not 70%. Don’t let a distorted headline push you into adding leverage through perpetuals just because your strategy’s returns lag spot performance; that reaction only compounds impermanent‑loss risk.

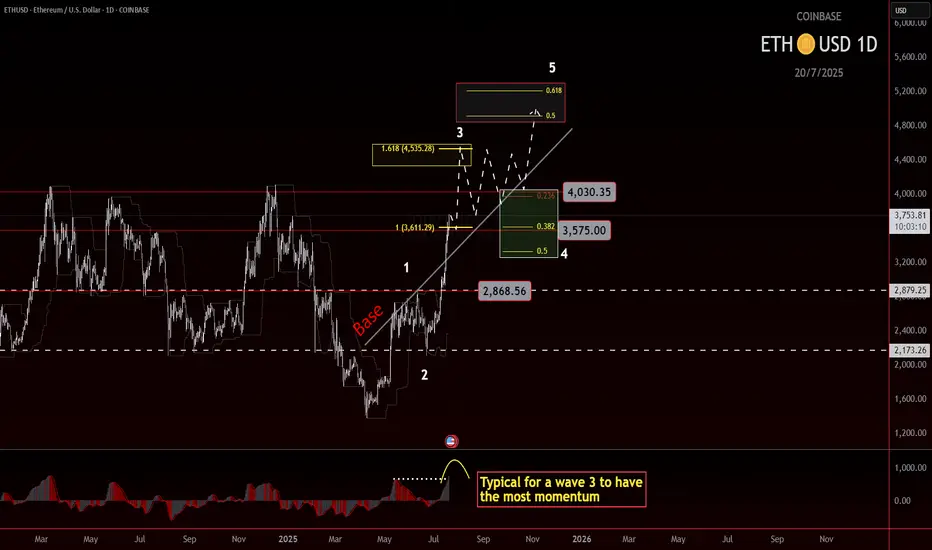
ETH roadmap to 5000!Ethereum Wave 3 in Play? Eyes on the $4500 Target
Ethereum may currently be progressing through a wave 3, which is often the strongest leg of an impulse. The structure so far supports that idea, and based on standard projections, the most likely target sits near $4500.
If price can break and hold above the 4k level, we could see a consolidation forming above the previous high. That would be a constructive sign and might set up the next leg higher.
But there’s still a chance ETH struggles to clear that level. If that happens, consolidation could form just underneath, which would still be acceptable within a wave 3 framework. What matters next is the shape and depth of the pullback.
Wave 4 will be the key. A shallow or sideways correction would keep bullish momentum intact. A deeper pullback doesn't ruin the structure, but it does mean we’ll need to watch support zones more closely.
If wave 4 behaves well and broader market conditions stay supportive, then a final wave 5 could bring ETH into the $5000 region. That’s the upper edge of this current roadmap, based on conservative assumptions.
Stay flexible. Let the structure guide the bias.
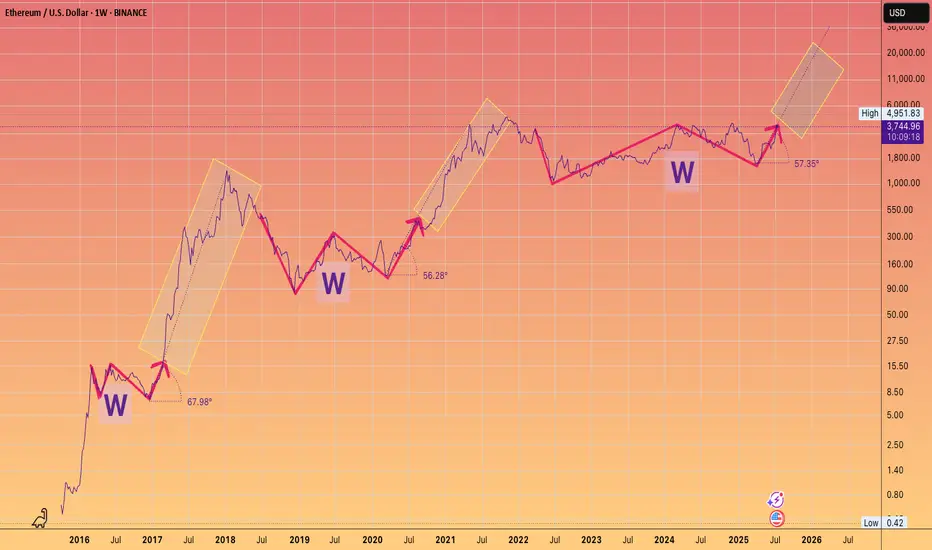
3 Wins to Glory.You guys know my long term Targets for ETH.
What I wanted to highlight is the angle of the Banana zone has been remarkably consistent on the Log chart.
Granted we only have 2 - 2.5 data points
But note how even in 2025 the run is adhering to the approx 60 degree angle of attack, after breaking out of their respective W's.
something to monitor.
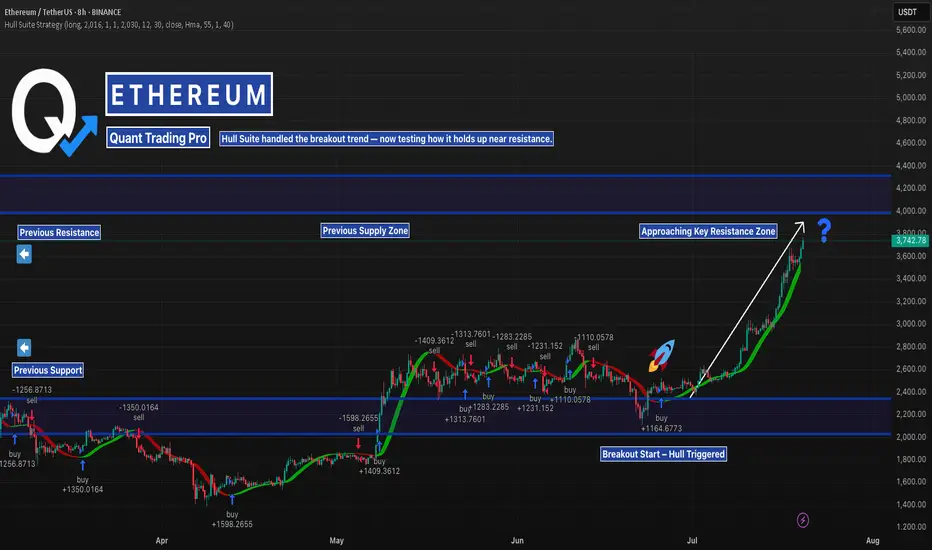
ETH in Liftoff Mode — But Resistance AheadEthereum has been trending hard — with the Hull Suite catching the breakout perfectly from the $2,200 base.
But now it’s flying straight into a key resistance zone that capped price earlier this year.
This is where many trend strategies get tested. Will Hull keep riding the wave — or will we start seeing signs of exhaustion?
📊 Watching closely how it reacts near the previous supply zone. These are the conditions where robust backtests matter most.
—
#ETHUSD #Ethereum #TrendAnalysis #HullSuite #BreakoutTrading #ResistanceZone #QuantTradingPro #TradingView #CryptoAnalysis
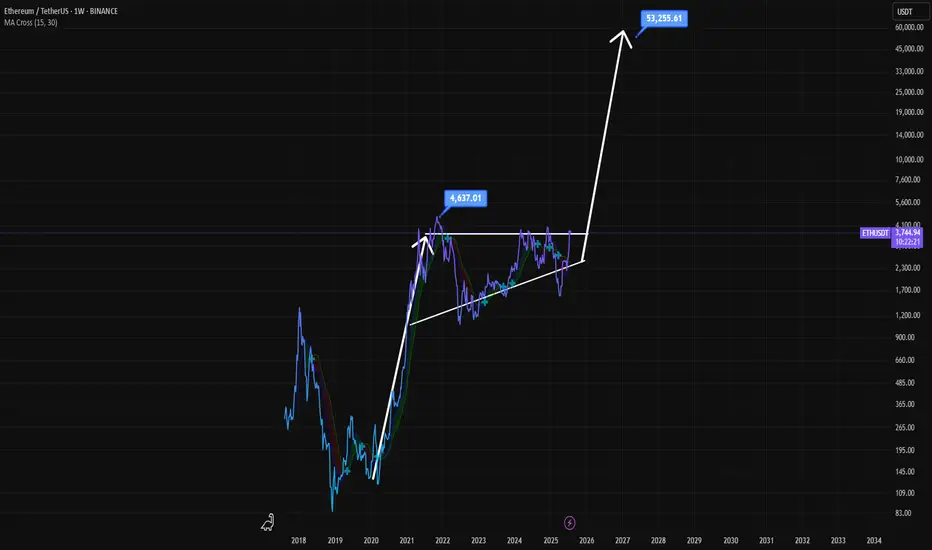
Ethereum's Path to $53,000: Multi-Year Breakout Pattern?This is a long-term technical analysis chart for the Ethereum/TetherUS (ETH/USDT) pair, presented on a weekly (1W) timeframe and using a logarithmic scale. The logarithmic scale is important as it visualizes percentage-based movements equally, which is crucial for analyzing an asset that has experienced exponential growth over many years.
Crucially, the date on the chart is "Jul 20, 2025," which is in the future. This indicates the chart is not just an analysis of past events but a speculative forecast of future price action.
Key Elements and Pattern Analysis
The chartist has identified and drawn a classic bullish continuation pattern known as an Ascending Triangle. Let's break down its components:
The Prior Uptrend (The "Flagpole"): Before the triangle formation, there was a massive upward price move starting in 2020 and peaking in late 2021. This powerful uptrend is the prerequisite for a bullish continuation pattern.
The Ascending Triangle Pattern: This is the multi-year consolidation phase that has been forming since the peak in late 2021.
Horizontal Resistance: The top of the triangle is a flat resistance line drawn at the previous all-time high, marked with a label at $4,637.01. The price has tested this level and failed to break through it, establishing it as a significant supply zone.
Ascending Support: The bottom of the triangle is a rising trendline. The price has made a series of "higher lows" since the market bottom in 2022. This indicates that despite pullbacks, buying pressure is consistently stepping in at higher price levels, showing underlying strength.
The Projected Breakout and Target: The core of this analysis is the prediction of what happens next.
Breakout: The chartist predicts that the price will continue to consolidate within this triangle until approximately late 2025 or early 2026. At that point, it is projected to break out decisively above the horizontal resistance.
Measured Move Target: The extremely bullish price target of $53,255.61 is calculated using a common technical analysis technique called a "measured move." The height of the triangle at its widest part (from the low around mid-2022 to the resistance line) is measured and then projected upward from the breakout point. This results in the highly ambitious target.
Interpretation and Narrative
The story this chart tells is as follows:
After its parabolic run in 2020-2021, Ethereum entered a necessary, long-term consolidation period.
During this multi-year phase, it has been building a massive base of support, with buyers absorbing selling pressure at progressively higher prices (the higher lows).
The chartist believes this long period of accumulation will eventually resolve to the upside, with a powerful breakout above the previous all-time high.
Such a breakout would signal the end of the consolidation and the beginning of a new major bull market cycle for Ethereum, with a projected target far exceeding the previous peak.
Important Caveats
Highly Speculative: This is a long-term forecast. Technical patterns are about probabilities, not certainties, and they can fail. The future date and extreme target price highlight the speculative nature of this analysis.
Pattern Invalidation: The entire bullish thesis is invalidated if the price breaks down below the ascending support trendline. Such a breakdown would be a significant bearish signal, suggesting a major trend reversal instead of a continuation.
External Factors: This technical analysis does not account for fundamental factors, macroeconomic shifts, regulatory changes, or other black swan events that could dramatically impact the price of Ethereum.
In summary, the chart presents a very bullish long-term outlook for Ethereum, based on the formation of a classic ascending triangle pattern. It forecasts a multi-year consolidation followed by a powerful breakout and a new, explosive bull run to over $50,000. However, this should be viewed as one possible scenario among many, with its own specific conditions for validation and invalidation.
Disclaimer: This is not a financial advise. This analysis is purely for informational purposes and should not be considered as investment advice. Trading involves risk, and you should consult with a financial professional before making any decisions.
ETH Approaching Major Resistance – Expecting Pullback Hello guys!
Ethereum has been rallying strongly within a well-respected ascending channel, pushing past key levels and now approaching a major resistance zone around $3,900–$4,000.
According to the chart structure, it looks like price could soon react from this resistance, leading to a pullback into the $3,000–$3,200 demand zone, which aligns with the midline of the channel.
This would be a healthy correction before potentially continuing the bullish trend and attempting a clean breakout toward new highs.
ETH is still bullish, but it may need to retest support before continuation.
Watch for a bounce from the $3,000–$3,200 zone for a high-probability long opportunity.

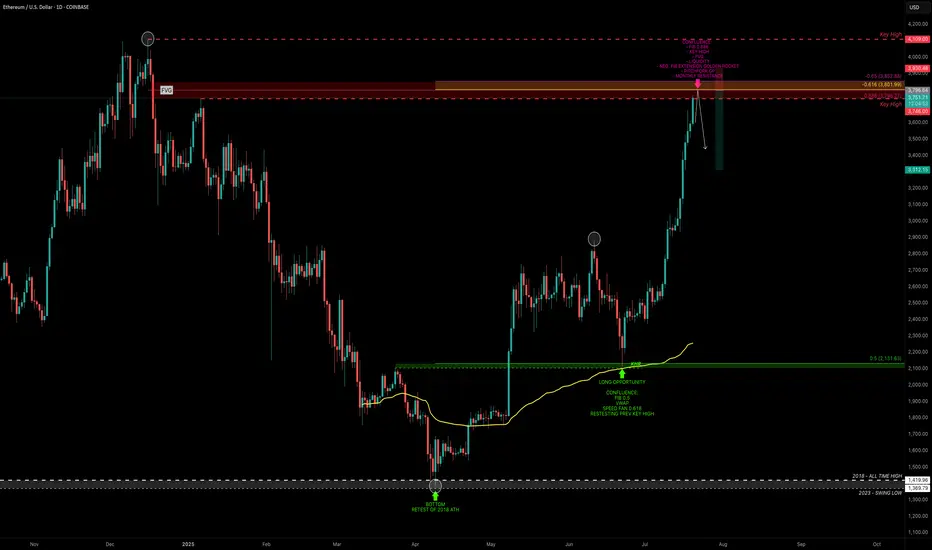
ETH — Rally Exhaustion or More Upside?ETH has been on an absolute tear. After retesting its old 2018 all-time high, it marked a bottom at $1383 — a brutal -66% correction over 114 days from the $4109 top.
From there, ETH ripped +100% in just one month, followed by 40 days of consolidation, and now, over the past 28 days, it’s surged another +76%, currently trading around $3715 — all without any major correction.
So the big question:
What’s next? Are we near a short setup, or is it time to long?
Let’s break it down.
🧩 Key Technicals
➡️ Bounce Zone:
On June 22, ETH retested the 0.5 fib ($2131.63) of the prior 5-wave Elliott impulse, with extra confluence from:
Anchored VWAP
Speed fan 0.618
➡️ Key Highs to Watch:
$3746 → recent local high
$4109 → 2021 all-time high
➡️ Fib Retracement Levels:
ETH has smashed through all major fibs, including the golden pocket (0.618–0.65) and 0.786 fib. The 0.886 fib at $3798.27 is the last major resistance, just above the $3746 key high.
At this zone, we also have:
Fair Value Gap (FVG)
Monthly Resistance
Negative Fib Extension Golden Pocket Target
➡️ Momentum Signal:
ETH is currently on its 8th consecutive bullish daily candle — historically, after 8–13 consecutive candles, price tends to cool off or correct. A sign to be cautious about longing here and consider profit-taking.
🔴 Short Trade Setup
Look for a potential SFP (swing failure pattern) at the key high $3746 to initiate a short trade.
This offers a low-risk setup with:
Entry: around $3746 (if SFP confirms)
Target (TP): ~$3300
Stop-loss: above SFP
R:R ≈ 1:4+
💡 Educational Insight: Why You Don’t Want to Long the Top
Markets often trap late longers near key highs or resistance zones — this is where smart money distributes while retail piles in emotionally.
Lesson: Look for zones of confluence (fib, VWAP, liquidity, FVG) and avoid chasing extended moves after multiple bullish candles.
Patience and confirmation at reversal points lead to higher-probability setups — you don’t need to catch every pump.
Final Thoughts
We’re approaching major highs, so this is a time for caution, not FOMO. Watch for reaction and potential reversals near $3750–$3850.
Stay sharp, manage risk — and remember, tops are where longs get trapped.
_________________________________
💬 If you found this helpful, drop a like and comment!
Want breakdowns of other charts? Leave your requests below.
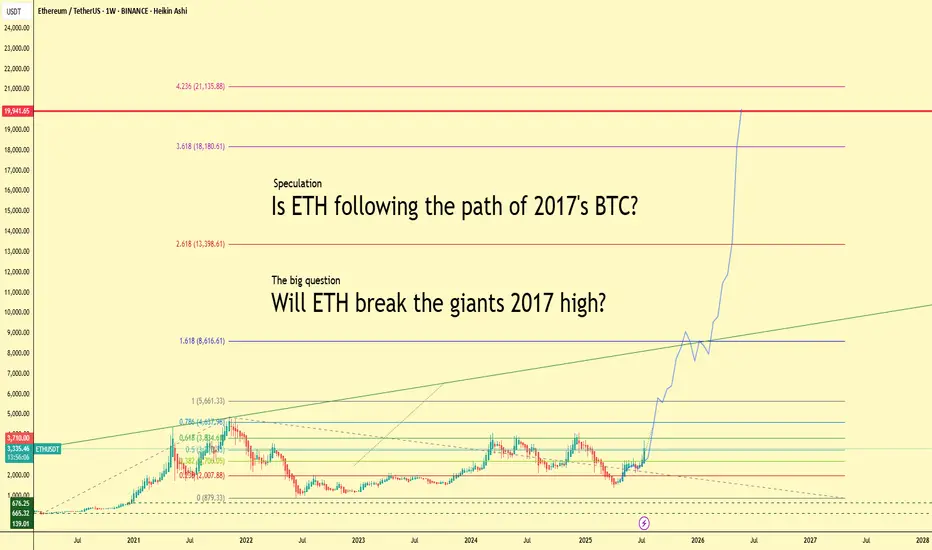
Will ETH Follow BTC’s 2017 Path? $20K in Sight?Ethereum is heating up — up more than 20% this week and currently trading above $3,300. But what if we told you this might just be the beginning?
This chart explores a bold yet exciting speculation:
👉 Is ETH repeating Bitcoin’s legendary 2017 run?
Back then, BTC went from obscurity to global headlines, smashing through $1k, then $5k, then $10k… and eventually peaking just below $20,000. Ethereum might just be lining up for a similar parabolic path.
🚀 Fibonacci Levels Say: Sky’s the Limit
The chart projects Fibonacci extensions up to:
1.618 = $8,600
2.618 = $13,400
3.618 = $18,180
4.236 = $21,135
Notice the key level: $19,941. That’s the legendary BTC high of 2017. Will ETH match or even surpass that milestone?
🧠 The Big Question:
Can ETH become the new “giant”?
While Bitcoin still leads the narrative, Ethereum’s ecosystem, real-world adoption, and institutional attention have never been stronger.
💬 Let’s Talk
Do you believe Ethereum is set to break $20K this cycle? Or is this just hopium and lines? Share your thoughts and let's compare notes.
#Ethereum #ETHUSDT #Crypto #Altseason #BTC2017 #Fibonacci #Bullrun #ETHBreakout #Parabola #CryptoSpeculation
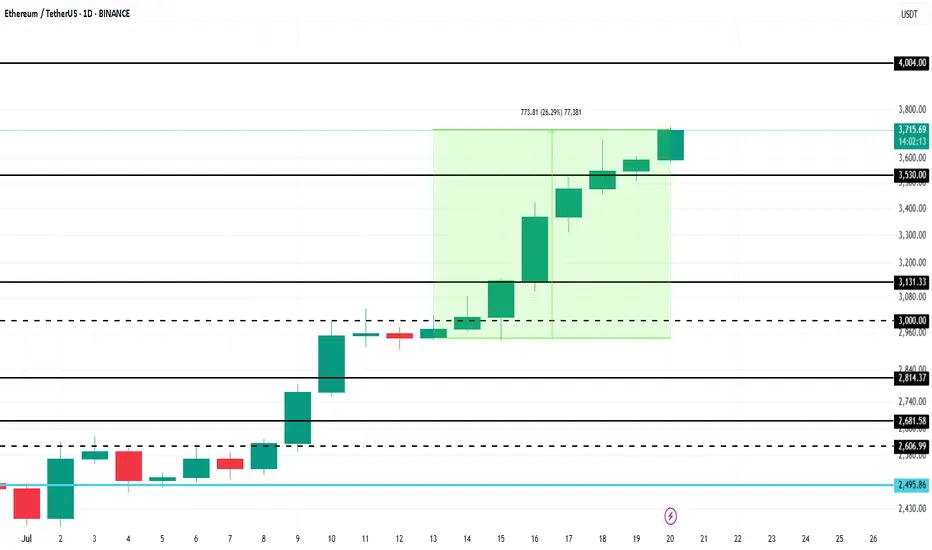
Ethereum Price Hits 6-Month High, Up Next $4,000BINANCE:ETHUSDT has managed to navigate recent market volatility with significant support from investors. As companies increasingly mirror Bitcoin’s corporate treasury use case, Ethereum is gaining traction.
BINANCE:ETHUSDT price surged 26% over the past week , reaching $3,715 and marking a 6-month high. The rally strengthened after ETH formed a Golden Cross last week. With this bullish momentum, Ethereum is now targeting $4,000 in the coming days, benefiting from investor confidence and growing institutional interest.
However, if BINANCE:ETHUSDT bullish momentum weakens and investors opt to sell, the price could decline to $3,131 . This would erase recent gains and invalidate the current bullish outlook.
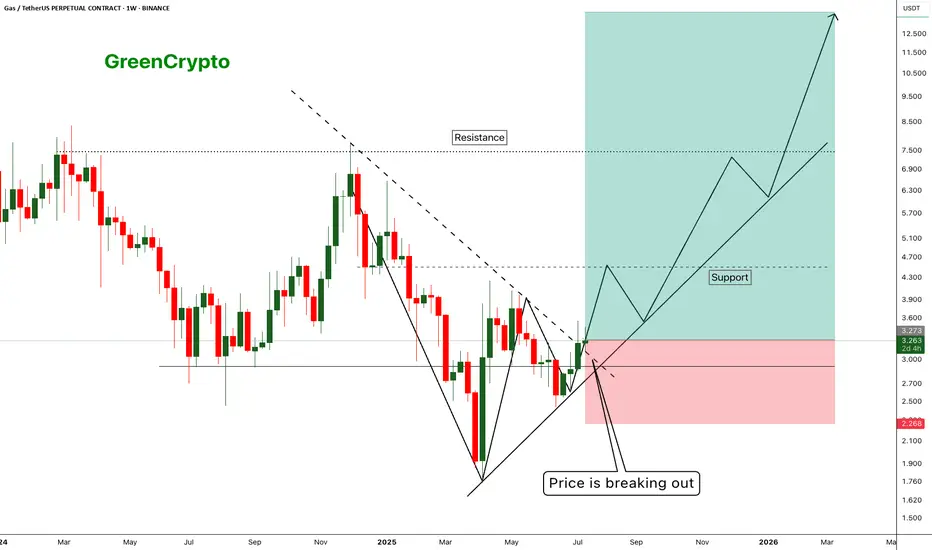
GAS - Huge Risk:Reward Trade 1:10 - Is there any Gas Left ?- Gas has finally managed to breakout from the resistance trendline and now trading just above the resistance
- I'm expecting this trend to continue along the support line shown in the chart.
Entry Price: 3.281
Stop Loss: 2.271
TP1: 3.944
TP2: 4.589
TP3: 6.775
TP4: 8.412
TP5: 13.512
Max Leverage 5x.
Don't forget to keep stoploss.
Support us by Liking and following.
Thanks and Cheers!
GreenCrypto
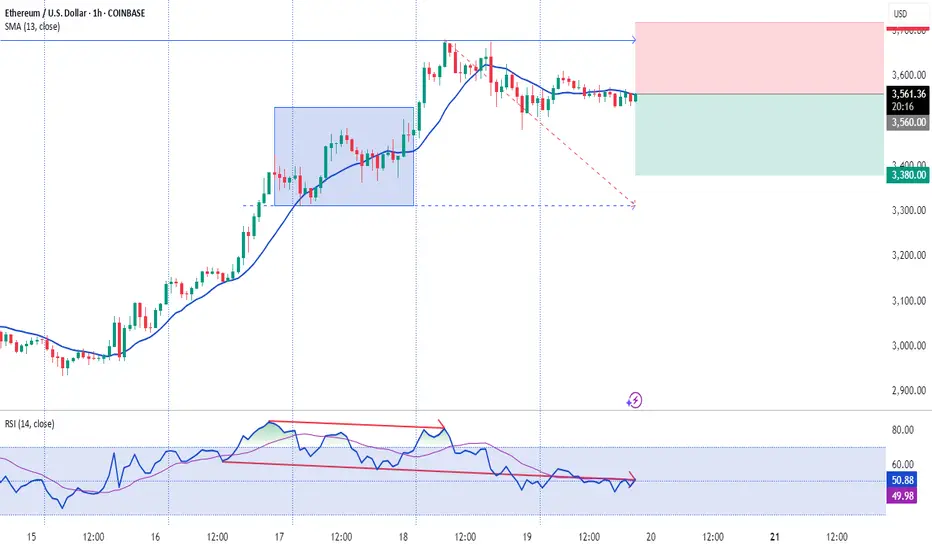
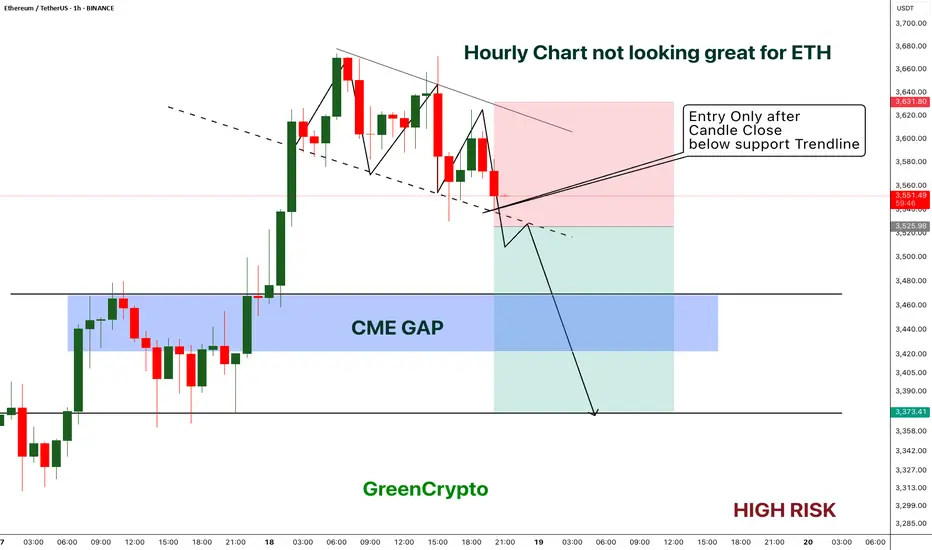
ETH - Short Trade with HIGH RISK- ETH got reject from resistance multiple times on 1H timeframe and now the price is playing near the support.
- I'm expecting overall market to cooldown this weekend, this could push the ETH to break the support
- ETH has CME gap around 3422 - 3467 range, im expecting this CME gap to be filled soon.
Entry Price: Below 3525
Stop Loss: 3631
TP1: 3471.15
TP2: 3381.76
Move SL to breakeven on TP1 hit.
Don't forget to keep stoploss.
Cheers
GreenCrypto
Link/BTC When will we see the pump Chainlink has always been one of my favorite cryptos—and pairing it with BTC just makes sense. I have strong faith in this project, and I believe the days when trendline resistance and support hold Chainlink back are numbered. This beast looks ready to break free.
We’re possibly just weeks, maybe even days, away from a breakout of this 4-year falling wedge. Once that happens, I see LINK/BTC teleporting upward—especially as quantitative tightening ends and Jerome Powell stops being a hater. The stars are aligning for Chainlink to soar. With everything going on behind the scenes between swift and Mastercard and the many more I can list I see this being the underdog.

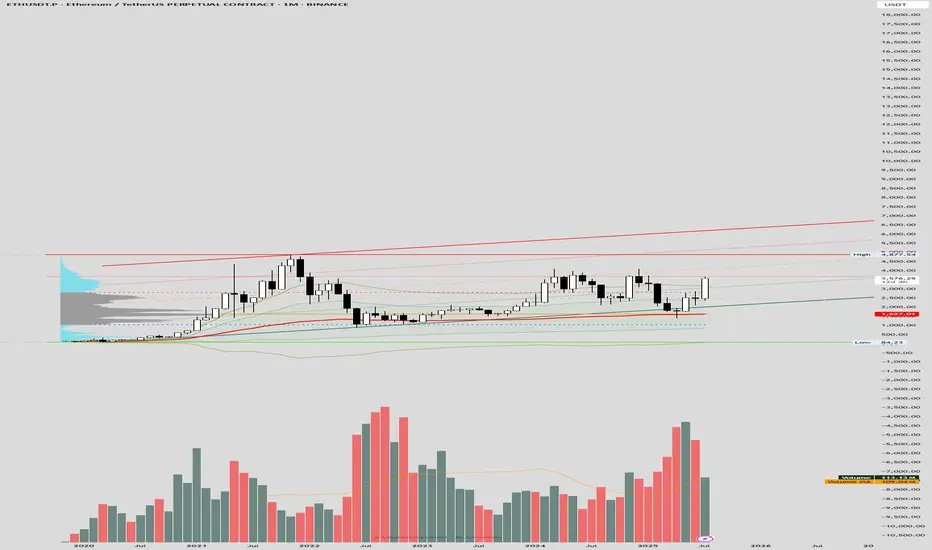
ETH Monthly Chart (AVWAP)The chart highlights a bullish structure with the AVWAP providing key dynamic support and resistance levels. The price has recently approached the upper AVWAP deviation around $4,977.54, aligning with the prior bull flag scenario's resistance zone. The red trendline indicates a potential upper boundary, while the green and orange lines suggest intermediate supports and resistances, with the current price near $3,579.48 testing the middle range. The lower AVWAP deviation near $842.23 serves as a critical invalidation level. Volume remains supportive, with spikes corresponding to price movements, and the volume moving average (109.4k) indicates steady activity.
Real-time data shows ETH trading at $3,565-$3,600, consistent with the chart's mid-range levels, driven by ETF inflows and on-chain activity. A breakout above $3,700-$4,000 with increased volume could target $3,834-$4,000 or higher, while support at $2,533-$2,700 remains vital. Sentiment on X and web sources is optimistic, though volatility persists due to external factors.