Ethereum ForecastAfter we had this support and resistance play:
and
Due to the markets condition i expect ETH Ethereum to touch the $1275 support.
Looking forward to read your opinion about it.
Ethereumanalysis

ETH descending channel#ETH/USDT
$ETH is inside descending parallel channel and now is above middle line of this channel.
🐻 breaking down from middle line will drop price to lower line around $1500.
🐮 holding the middle line as support and break out from descending resistance around $1780 and $1800 can increase price to upper line around $1900.

#Ethereum Upside Limited, ETH Bulls Stand a Chance above $1.7kPast Performance of Ethereum
Ethereum prices are racing higher, recovering from 2022 lows of around $1.7k. Bears are still in control despite firm prices and recovery from last week's lows. Traders may find entries to buy the dip at spot rates in anticipation of a recovery. Currently, ETH is up five percent versus the USDT but steady in the past trading week.
#Ethereum Technical Analysis
From the daily chart, ETH prices are stable. However, bulls are struggling to print above immediate liquidation levels from the weekly chart. Although last week was bullish, the retracement at the tail end of last week slowed bulls. Traders may find entries to accumulate at current levels provided prices are trading above $1.7k—2022 lows. Conversely, a safer approach for risk-averse traders is to wait for a clean break above May 30 highs or $2.05k. In that case, their immediate target would be $2.2k and, ideally, May 11 highs of $2.45k.
What to Expect from #ETH?
The immediate trend is bullish, as per the formation in the daily chart. Even though there are hints of strength, prices are moving below the middle BB (a flexible resistance line) and below the $2k line. In subsequent sessions, ETH prices must soak in selling pressure and rise above $2.05k if buyers are to take charge.
Resistance level to watch out for: $2.05k
Support level to watch out for: $1.7k
Disclaimer: Opinions expressed are not investment advice. Do your research.

ETH above lower line of falling wedge#ETH/USD
$ETH hold the support zone and descending support zone and now 🐮 price can increase toward resistance zone between $2200 and $2350 that is the same with descending resistance.
🐮 more rally will be appear if bulls success to break out from resistance zone to touch upper line of falling wedge that is the same with resistance zone between $2600 and $2850.

Ethereum: BlueI’m blue
Da ba dee da ba di
Da ba dee da ba di
Da ba dee da ba di
In case you won’t get this Eiffel 65 song out of your head today – sorry! However, blue is indeed Ethereum’s preferred color scheme in our chart. From its current position in the lower blue zone between $1295 and $2164, Ethereum should rise into the upper blue zone between $2305 and $2472 to finish wave (iv) in blue. Then, it should drop back into the lower blue zone, making it even as far as the overlapping yellow zone between $1743 and $589, in which wave (2) in yellow should end.

ETH Update - Next Target @ $1,600The 4 Hour chart is over bought.
Momentum is dying and it looks like ETH will be on its way down soon.
Opening longs here might not be the best idea while inside this bear flag / pennant however you want to look at it.
Small bounce expected once it hits #5.
Entry Between:
$2,053 - 1934.36
Take Profit:
TP 1 - $1,792.41
TP 2 - $1,613.06
Stop Loss:
$2122.11
If you'd like me to analyse any other crypto send me a message or leave a comment 👍🏽
Happy trading!
Not Financial Advise. Do Your Own Research.

#Ethereum Bulls Has Strong Resistance at $2.2kPast Performance of Ethereum
ETH prices are relatively stable, swinging, from a top-down analysis, in a bear formation pattern as per the candlestick arrangement in the daily chart. Even though traders are hopeful, expecting substantial recoveries, bulls should first shake off bears by closing above $2.2k in the immediate term. In that case, ETH may spring higher towards March 2022 highs.
#Ethereum Technical Analysis
There are hints of strengths going by the formation in the daily chart. After sharp losses in the first two weeks of May, ETH prices stabilized before inching higher. However, the immediate resistance lies at $2.2k, marking May 12 highs. While traders may unload on dips, selling on every pullback, optimistic traders can wait for a clean break above $2.2k before loading and riding the rising tide. Preferably, the breakout should be with rising trading volumes confirming the losses of May 12 as climactic, marking the end of the bear run. On the reverse side, losses below $1.9k would pour cold water on bullish prospects as ETH snaps back to the dominant bear formation.
What to Expect from #ETH?
ETH bulls are confident, pinning their optimism on contrarian investor sentiment and other supportive fundamentals. Nonetheless, sellers will remain dominant as long as ETH is below $2.2k.
Resistance level to watch out for: $2.2k
Support level to watch out for: $1.9k
Disclaimer: Opinions expressed are not investment advice. Do your research.

Ethbtc a sign for altseasonOn hold right now, and probably for several months we won't be seeing a "altseason". That means, most likely, no crazy rallies for our beloved coins.
Holding this triangle pattern, but rsi under 50 and price is under the bull market supportt band, mixed signals.

ETH USD WHAT A BIG MAYBE!As we still exhaling from the last move I believe there is still room to go up and re-test the previously broken structure.

Ethereum shortEthereum broke through the lower boundary of ascending triangle. Bearish movement to support level at 2020 is possible.

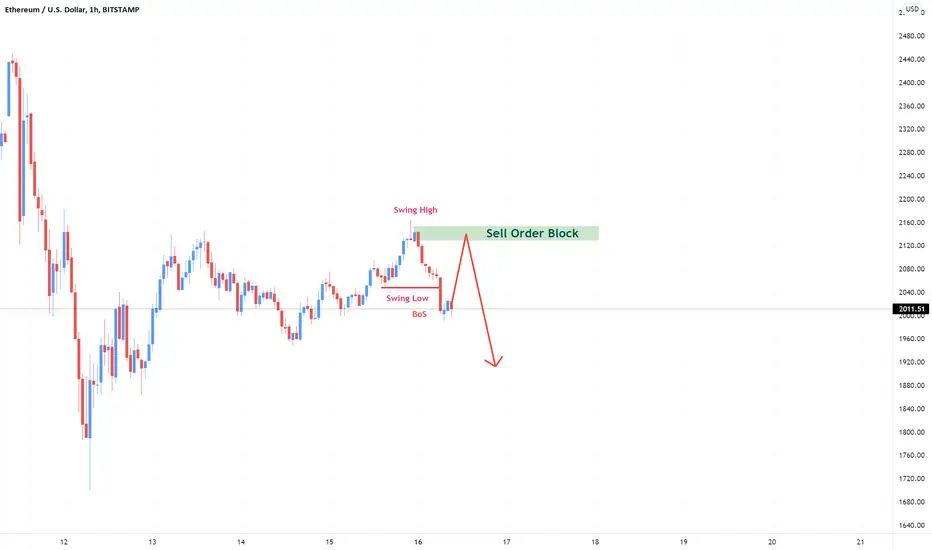
Ethereum Prediction H1Here is my view for ETHUSD on H1. The price could go down, you can put a pending order on the Order block or find an entry on LTF within OB Zone. Trade Safe!
ETH - 4 Hour looks like a trap!Bear Flag + Pennant + H&S
Looks like a trap!
Short entry point and take profits are marked on the chart.
What are your thoughts on this?

ETH falling wedge#ETH/USD
$ETH same as BTC is inside falling wedge
🐮 break out descending resistance that is the same with resistance zone between $2200 and $2370 will increase price to upper line of wedge that is the same with resistance zone between $2700 and $2900
🐻 rejection from descending resistance and break down from lower line will drop price to support zone between $1400 and $1200.

#Ethereum slides to Q1 2022 lows, Finds Resistance at $2.5kPast Performance of Ethereum
Ethereum is deep in red like most crypto assets. When writing, ETH is up four percent in the past trading day but is down 16 percent week-to-date versus the USDT. There are encouraging recoveries at spot rates. However, this is not enough to dissuade holders who were pummeled on May 9 following the sharp dump that saw ETH plunge to as low as $2.1k.
#Ethereum Technical Analysis
ETH prices bounced off from Q1 2022 lows, coinciding with the 78.6 percent Fibonacci retracement level of the H2 2021 trade range. While the rejection of lower prices on May 10 could be a net positive, sellers are still in control in the immediate term. Therefore, since ETHUSDT is in a bear breakout formation and $2.5k is a strong resistance level, sellers can liquidate on any attempt to retest this line. Cautious, risk-averse traders can wait for confirmation below $2.2k—this week's lows—before unloading, targeting $1.8k in the medium term. On the flip side, any surge above $2.5k invalidates the bear run, confirming May 9 bear bar as climactic.
What to Expect from #ETH?
Sellers are in a commanding position. However, Ethereum's ecosystem is activity and dApp dense. ETH may recover, bouncing off from $2.2k once bulls satisfactorily rewind losses of May 9.
Resistance level to watch out for: $2.5k
Support level to watch out for: $2.2k
Disclaimer: Opinions expressed are not investment advice. Do your research.

ETHUSD - Testing New Indicators This indicator shows Fibonacci levels
Right now on ETHUSD we are bottomed at the same levels as late 2018 and 2020 COVID
See how it plays out

ETH ab=cd to $1000#ETH/USDT
$ETH descending channel shows price is at middle zone.
🐮 holding this zone as support can increase price to upper line around $3k
🐻 but as we are in a sharp downtrend price can break down from this zone and drop more to lower line that is the same with 2 fib level and complete AB=CD pattern around $1000.

ETHEthereum, will it serve as a leading indicator, that bitcoin could fall further? Look how interesting, Ethereum activates the SHS and now it's just coming back to make a pullback that can activate the bearish pivot when it loses 2,203k. Outside that ETH/BTC Shows that the asset is in a drift that shows previous loss of strength. Full Alert !

DeGRAM | ETHUSDT shortEthereum has been channeling for quite some time.
ETH price is slowly gravitating down to major support levels.
The lower border of the channel is expected to be tested.
-------------------
Share your opinion in the comments and support the idea with like. Thanks for your support!

Ethereum: Greens 🥬Ethereum has resolved to eat more healthy food. Thus, it has added a lot of greens to its diet, as is visible in our chart. First, it should take a bite of the middle green zone between $2169 and $1542 to finish wave 3 in green. Then, it should climb upwards to complete the countermovement in wave 4 in green. Afterwards, Ethereum should resume the descent below the support at $1711 and into the lower green zone between $1590 and $1349, where wave 5 in green should end. However, there is a 35% chance that Ethereum could decide to take a mouthful of the upper green zone between $3249 and $3481 before moving downwards again.

ETH broke out falling wedge$ETH chart is just like BTC chart.
price broke out from falling wedge and target of this wedge is around $3400.

Ethereum in Range, ETH Bulls Stand a Chance above $2.7kPast Performance of #Ethereum
Ethereum is comparatively resilient against bears, soaking the selling pressure as per the developments in the daily chart. ETH prices are steadying above primary support, flashing with last week's lows at about $2.7k. Even so, sellers are in control from a top-down approach. ETHUSDT remains within a bear breakout formation, struggling to stay afloat and snap back to the primary trend established in March 2022.
#Ethereum Technical Analysis
ETH prices are under significant selling pressure. Overall, sellers are in control, unwinding gains posted in March. Buyers haven't reversed the steep losses of April at spot rates. Notably, ETHUSDT is within last week's trade range, with conspicuous bear bars of April 26 and 30 setting the trend. As ETH prices move horizontally, traders can trade with the primary trend, unloading every pullback provided prices are below $3k. A break below $2.7k and last week's lows may force another wave of dumping towards March 2022 lows of $2.3k. On the flip side, if ETH bulls break away from the current sideways movement above $3k, prices could soar to $3.5k—or better. This breakout would endorse the bulls of March, providing timely entries for aggressive traders to ride the wave.
What to Expect from #ETH?
Prices have support from around the 78.6 percent Fibonacci retracement level of the March 2022 trade range. A breakout above $3k would relieve optimistic buyers angling for resumption and a lift-off towards $3.5k.
Resistance level to watch out for: $3k
Support level to watch out for: $2.7k
Disclaimer: Opinions expressed are not investment advice. Do your research.

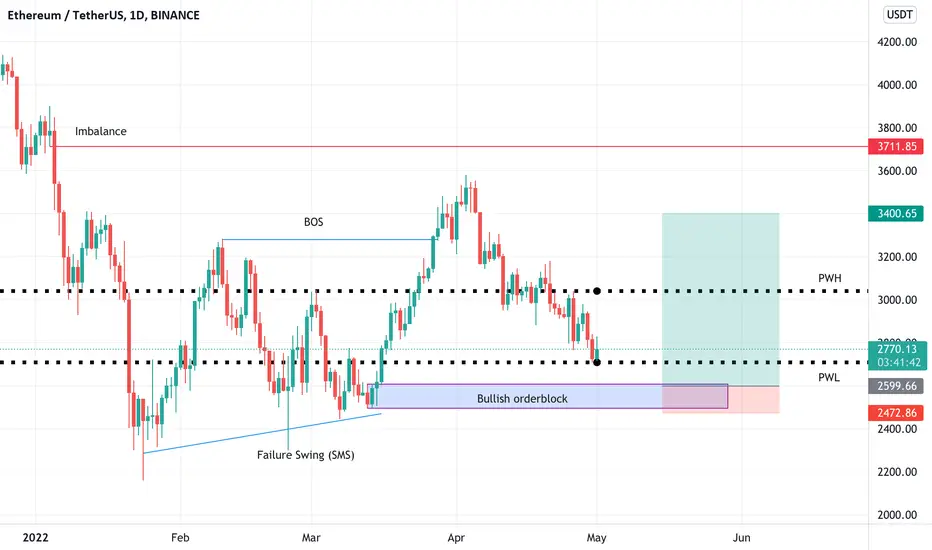
⁉️ Ethereum Weekly Analysis Here we could see SMS+BOS+RTO Pattern, as the price made a failure swing, broke the structure and now I am waiting for a return to bullish orderblock.
ETH daily trend lines#ETH/USD
$ETH trend lines show:
🐮 price can head up to resistance of cross of ascending and descending trend lines around $3600.
break out from this resistance can increase price to ascending trend line around $3600.
🐻 and rejection from resistance of $3170can drop price to lower trend line around $2650.
