ETHUSDT LongHey traders, in today's trading session we are monitoring ETHUSD for a buying opportunity around 2500 zone, once we will receive any bullish confirmation the trade will be executed.
Trade safe, Joe.
Ethereumanalysis

Ethereum Update!Little Update on our recent ETH TA like we somewhat expected we saw a rejection off of the top of this triangle that we have respected during our whole time trading within it, now theres definitely some good reason behind this rejection we have multiple layers of resistance all at the same level, first of all the top of the triangle itself, the 50 day EMA, the 0.6 FIB level are all strong points of resistance. Now on the other hand we could most definitely see a bounce off of our current spot we are sitting now we have multiple layers of support, The 20 day EMA, checked out the bollinger bands and our midline lines up perfectly with the 20 day EMA, we have the pivot point which is a pretty crucial area. Now if by chance we do see a drop below the teal pivot point tonight for our daily close, this could definitely trigger a slip to the downside which is not ideal for us trying to regain an uptrend, as far as support below our current level we have the bottom of the triangle itself, support at the top of the descending channel, and 2 additional layers of support just below the bottom of the triangle. So if we do see a downside i think it will be pretty quick for us seeing a rebound, now a likely scenario would be a false breakout to catch traders. this would look something like a break and close out of the bottom of the triangle making traders scream SHORT, before then catching support and regaining the triangle itself and likely a move to the topside, the market movers love false breakouts because it liquidates many traders. Forgot to mention but we have very solid support at the 0.786 FIB level which is also the S1 Support, so if we we're too look for a trade i would say an entry at the .786 FIB, little generous stop loss and a take profit around 2800$ (USD)! Now for the Squeeze momentum indicator we have what looks like the last stride of red (bearish) movement, we have seen a steady decrease in the red bars day after day showing bearish momentum fading away, now what we are looking for is potentially another red bar (decreased from today) before then pushing above the midline into bullish zone. The black crosses represent the bullish/bearish squeeze and when those crosses turn white that represents the squeeze release, which is the explosive part of this indicator! To see this for yourself backtest and line up the white crosses to price action itself! Not financial advice just my opinion!

Ethereum Breakout Coming Soon!!?Ethereum is on the verge of a potential breakout of this triangle, we have wicked up and above for the first time but have since came back down to just below the top. The very good news is that we are looking like we may see a daily close above the 0.6 FIB level and yesterday we had a daily close above the daily pivot point (teal) both of these are very bullish signs, now keep in mind it doesn't necessarily confirm a bullish move but we are heading in the right direction! Not even too mention the bullish breakout of the descending channel, we briefly broke out a couple times before and have fallen back in but this time could be the real deal, we will have to wait and see. Looking at our RSI we are seeing yet another very good sign, we have taken back the midline, by being and remaining above this midline it confirms an uptrend if we can hold it, falling back below will keep us in a confirmed downtrend, ideally we do want to see more upside for price action and the RSI so we can get that yellow SMA above the midline aswell for additional support! Now the Stoch RSI has rebounded very fast and is coming up shortly on the overbought zone, now this could be a sign for a little cooloff once we do reach this level but the most important thing is for the RSI to remain above that midline! Not financial advice just my opinion!

Ethereum: Not Yet…🍵 It’s a bit like sipping tea. You take the cup to your lips to check the temperature only to decide “No, not yet”, because the brew is still too hot and you must let it cool down a bit longer. (And then, you promptly forget that you have even made tea in the first place.)
Similarly, Ethereum has taken a sip of the orange zone between $2402 and $1861 but decided to not explore it further yet. Instead, it has come back to about $2700 again to finish wave 4 in green. As long as Ethereum stays below the resistance at $2837, we expect it to move back into the orange zone and complete wave 5 in green as well as wave v in orange, wave c in blue and wave ii in magenta at its bottom. After this accomplishment, Ethereum should rush upwards until the resistance at $3412, breaking the one at $2837 in the process. From there, it should have enough drive to head for the next aim at $4865 and further still.

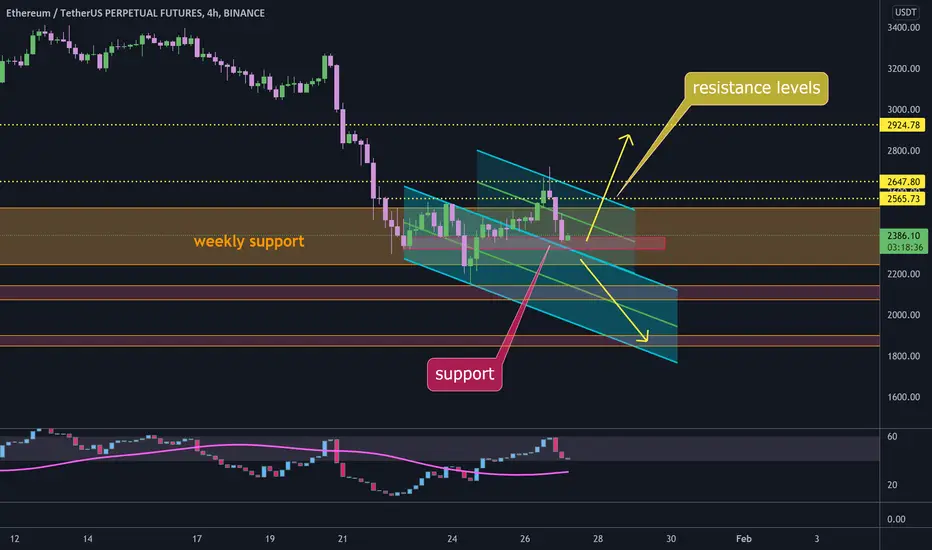
ETHEREUM 4H Analysis. Up or Down ?🟢 ETH breaks the 2700$ support area and now taking support at the 2500$-2600$ area. If ETH breaks 0.382 Fibonacci level then we see a test of the major support of the 2350$ _ 2450$ area. The
resistance is 2715$ and 2850$ area.
Use the appropriate loss limit for your trades, which has a very high possibility of emotional movement in the market.
⚠ This Analysis will be updated.
Amir Hossein
📅 02.20 .2022
⚠️ (DYOR)

ETH usdt -double top on 3200 resistanceOn the 4h chart we see a clear double top around the 3200 area.
If Ethereum can break the downtrend line from the 1 day chart we can expect to see significant price movement upwards.

ETH parallel channel#ETH/USDT
$ETH dropped to lower line of parallel channel.
🐻 if 4h candle close below lower line of channel, price will drop more to support zone around $3050 and breaking this support will decrease price to $2960 and $2880.
🐮 close of 4h candle above resistance zone around $3190 and middle line of parallel channel can increase price to resistance zone around $3400.

ETH support and resistance levels#ETH/USD
$ETH broke out from ascending trend zone and try to confirm it as support.
🐮 as you can see price is inside resistance zone, that need to break out from upper line around $3060 to head up toward resistance levels of $3250 and $3450.
🐻 rejection from this zone and break down from ascending trend zone can drop price to support zone around $2800

Ethereum ETH Bullish runThere are 3 different signs that clearly indicate bullish run of ethereum. Follow for more

Ethereum Due For a Climb Up!!?Ethereums been getting beaten down recently following Bitcoins lead and we have been trading within a descending channel like we talked about last time, we had a brief fall out of this channel but have since recovered after finding support at the 0.786 FIB level, we have also regained obvious support at the 2618$ level. We have fallen out the downside of our Bullish pennant but definitely still have the chance to regain it in the coming days. Personally i believe Ethereum is due for a very solid move to the upside sooner than later, one reason is because of the sheer downside we have seen recently, we have had quite the correction overall and an upswing is overdue. Now lets get into some better points of why i think we are due for an upswing, the mean reversion channel if you notice to the left we had a decent period of us being in the oversold area, now after backchecking this indicator we have not seen an oversold moment since earlier into 2020!!! This gives me good reason to believe a grind back upto our mean at 3850$ is overdue. Now if we also look at the RSI we notice on here aswell we were strongly oversold, we have since recovered a little bit and have some nice support below us coming from the yellow simple moving average! The whole goal here overall is too make our way back up and above the midline, this would be very key as we could regain a confirmed uptrend! However when we look at the Wavetrend this makes me feel like we could see either a little sideways movement or a possible little drop before we move back up. We are currently sitting at strong resistance where we are beginning to curl, if we can't break through here a little downside is likely, but we just came out of the buy zone which is a bullish sign so i think if we do fall down a little bit more we could likely see a quicker reversal off the second support i have drawn! Overall still bullish on Ethereum in the short term but especially the long term! Will Update going forward! Not financial advice just my opinion!

Ethereum Bullish Pennant!Ethereum is following the price action of BTC very closely but instead of a bullish triangle like BTC we are currently trading inside of a bullish pennant! ETH is making some nice gains the past week moving up day by day slowly but surely and we are coming up on some important levels, first off for resistance we are looking at the bollinger bands, ideally a break above the midline would be very key as it opens the door for a run for the top band, where like yall know we could see some explosive price action! Next level of resistance we are facing is the 0.6 FIB level at 2920$, this is definitely going to be a strong level of resistance and we haven't tested it much recently so there is a for sure chance we get rejected right away, but theres also the chance momentum picks up and we smash through, just like how we saw on the drop and fall below recently. We are also going to have some decent resistance coming from the midpoint on the descending channel and finally the goal and target would be a breakthrough the top of this pennant, we have some work to do before getting there but we have seen it happen time and time again, just a matter of time. Now the RSI is looking good we made a strong push up from the oversold zone, we are currently trending down slightly but we could be in for a bounce in the coming days, the key here is getting above that midline to get us back into a confirmed uptrend! Now the MACD, we are looking great here, we are seeing a steady rise on the histogram with our green bars growing each day showing us that rise in bullish momentum and also we have nice separation within the MA's this is key because having bigger space between the blue and orange makes it more difficult for the bears to trigger a bearish cross. Now the goal with the MACD is too just keep moving exactly how it is, climbing MA's and also that rise in green bars day after day, if the histogram starts moving flat or decreasing the chances of this current bull MACD cycle coming to an end is higher! Not financial advice just my opinion!

EthUsd approaching sell zoneAs it was normal, after reaching 2200, EthUsd has started to correct higher.
At the moment of writing, Ethereum is at 2700, exactly at last week's high, and is entering my sell zone
This resistance extends to 2950-3000 and a new dive is probable in the next days.
I still expect a visit to 1800 and only if I see sustained buying above 3k I will change my bearish opinion.

ETH rising wedge#ETH/USDT
$ETH is inside rising wedge.
there is an ascending resistance line that can reject price from here and drop it to support zone around $2300.
and if break out from current resistance it will head up more to upper line of wedge pattern then fall to $2300.

ETH Ethereum: 1D Chart Review Hello friends, today you can review the technical analysis idea on a 1D linear scale chart for Ethereum ( ETHUSD ).
The chart is self-explanatory. There are many bearish signs so be careful when considering to trade Ethereum.
Included in the chart: Support and Resistance Lines, Ichimoku Cloud, VPVR (Volume Profile Visible Range), 50 Simple Moving Average, 200 Simple Moving Average, Volume, Bear Pennant, Ascending Wedge, Descending Wedge, RSI.
If you enjoy my ideas, feel free to like it and drop in a comment. I love reading your comments below.
Disclosure: This is just my opinion and not any type of financial advice. I enjoy charting and discussing technical analysis . Don't trade based on my advice. Do your own research! #cryptopickk

ETH pullback or bigger channel#ETH/USDT
$ETH touched the upper line of clone channel and dropped to lower line that can be a pullback to broken line, so in this way it will increase toward $2900.
but more possible way is that price break down support zone and drop to lower line of channel around $1900.
Ethereum to break support, 1800 here we come!Like all crypto market, Eth has reversed strongly from my pointed-out sell zone yesterday and what took 48h to gain was erased in only 8 hours, giving us a strong clue about the bearish momentum.
At this moment the cryptocurrency is trading exactly in 2400 support and a expect a clear break under soon.
Bears can target the next important support at the 1750-1800 zone and only a daily close above 2800 would negate this scenario.

Ethereum: Make U-Turn! 🛣 If Ethereum had a satnav, it would be like: “…at the lower edge of the orange-colored zone, make U-turn and follow the road northward.”
Ethereum has finished wave iii in orange at the lower end of the orange-colored zone between $2402 and $2195 and has already started wave iv in orange. This countermovement should lead the price into the second orange area between $2710 and $3325. As long as it does not develop any new interim lows, Ethereum should ideally reach $3050 before beginning wave v and turning around again to go back though and below the orange belt between $2402 and $2195.

Ethereum Buying ZonesImportant Buying Zones for Ethereum .
BUYING ZONE 1 - $2725 - $2890
BUYING ZONE 2 - $1700 - $1855
BUYING ZONE 3 - $1274 - $1450

ETHETHEREUM WAS like BITCOIN, i think it come back as soon as possible. i show everything in the my BITCOIN analysis.

Bears should be careful of short covering (Btc&Eth outlooks)
Bitcoin (main chart):
After the false break of 42500 short-term resistance, Bitcoin dropped hard and at the moment of writing is trading at 36k, with a more than 15% drop in 48h.
Although the overall trend is grossly bearish, short-sellers should be very careful to an aggressive short-covering rebound.
I expect extreme volatility for the Crypto market and I will try to speculate on this possible rebound. 32k-25k old congestion zone can be a good zone to look for a reversal.
38500-39k zone is now resistance and extends slightly above 40k.
Ethereum:
As usual, EthUsd dives more than Bitcoin, with a more than 25% drop in 48h.
Here also a short squeeze rally is possible and a revisit of 2750 now resistance
2400 and slightly under is where I will look for speculative buys.
Keep in mind that the trend is strongly down and my suggestions are very risky
Best of luck!
Mihai Iacob

Ethereum- Higher low in place?Although it has broken under 3200 support, losses for Ethereum are limited and I don't "see" much sell power.
The crypto may have found a new low above 3k and a new leg of correction to come.
I'm cautiously bullish at this moment with more confirmation above 3200.
A daily close above 3200 could expose 3600 important resistance and 3400 is now interim resistance.
A drop under 3k would put bearish scenario back in play.
Best of luck!
Mihai Iacob

Ethereum Breakout Against BTC Soon!!Looking at our ETHBTC daily chart we notice we have been slumping quite a bit against Bitcoin and have since formed a pennant, we are currently approaching the Apex point where we will see a forced breakout, we have about 3 days before that happens so the chance to breakout before is still there. A positive thing is that we are currently holding onto the 0.2 FIB level which is strong support and we also have a few more levels of support directly below us, we have the bottom of the pennant and then we also have strong support at 0.0733, all of these levels provide a good change to rebound to the upside. As for resistance we are looking at the 0.075 level and the top of our pennant, i will say it is very hard to determine where ETH is headed over BTC but i would confidently say we are much overdue for a reversal. Looking at the Stoch RSI we are on our way down after a bearish cross but the good news is that we have support waiting for us in the oversold zone, we almost everytime see a strong reversal out of this area on its own + we have a nice support level for a likely bounce, so this could mean we could be looking at a false downside breakout on price action before then rebounding back to the upside. Now same thing with the RSI we are still currently below the midline which means confirmed downtrend but we have just caught some needed support, we decide to break below this level we have another level of support coming in a bit lower, now this is where the false downside breakout also ties in! The longer outlook goal is of course to break above the 50. mark so we can reclaim a confirmed uptrend! Not financial advice just my opinion!

ETH Price ETHEUR M15Here is my view for ETHEUR on M15. The price should go down, you can put a pending order on the Order block or find an entry on LTF within OB Zone. Trade Safe!
