Ethereum - Expecting Retraces Before Prior Continuation LowerH1 - Bearish trend pattern in the form of lower highs, lower lows structure.
Strong bearish momentum
Lower lows on the moving averages of the MACD indicator.
Expecting retraces and further continuation lower until the two Fibonacci resistance zones hold.
If you enjoy this idea, don’t forget to LIKE 👍, FOLLOW ✅, SHARE 🙌, and COMMENT ✍! Drop your thoughts and charts below to keep the discussion going. Your support helps keep this content free and reach more people! 🚀
--------------------------------------------------------------------------------------------------------------------
Disclosure: I am part of Trade Nation's Influencer program and receive a monthly fee for using their TradingView charts in my analysis.
Ethereumanalysis

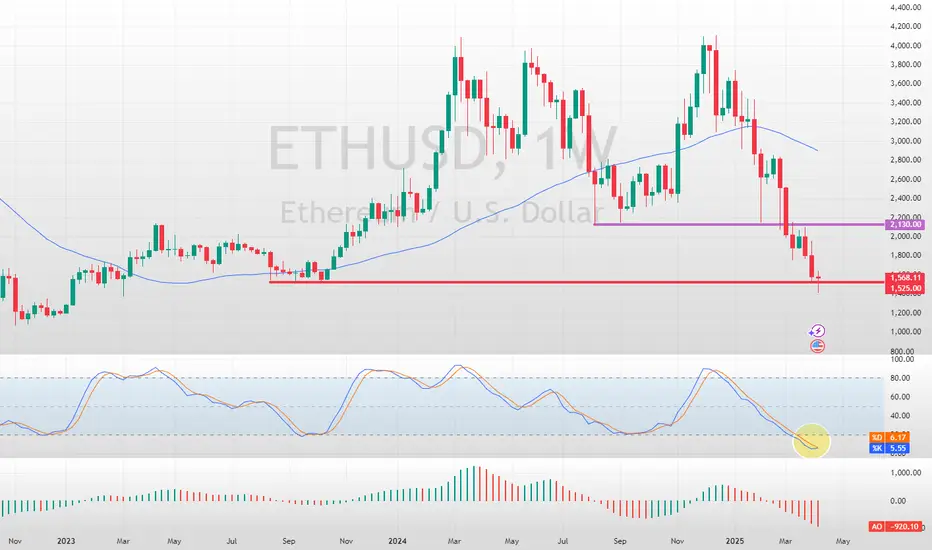
Ethereum Tests Critical Support LevelFenzoFx—Ethereum tests the critical support level at $1,525. A consolidation wave toward $2,130 could be imminent.
ETHUSDT – Eyes on the Green Line!ETHUSDT – Eyes on the Green Line!
“Momentum is building, and all signs point to the next key level—the green line is in play!”
🔥 Key Insights:
✅ Trend Remains Strong – No reason to fade the move.
✅ Green Line = Next Target – That’s where liquidity & reactions will matter.
✅ Pullbacks = Buying Opportunities – No FOMO, we wait for strategic entries.
💡 The Smart Plan:
Look for Dips to Load Up – Volume & CDV should confirm strength.
LTF Breakouts = Strong Entry Signals – Follow structure, not emotions.
Green Line = First Major Resistance – Expect reactions, manage risk accordingly.
“If momentum holds, Ethereum is headed straight for the green line—watch closely!” 🚀🔥
A tiny part of my runners;
💼 STMXUSDT: 2 Buying Areas
🐢 TURBOUSDT: Buy Zones and Buyer Presence
🌍 ICPUSDT.P: Massive Upside Potential | Check the Trade Update For Seeing Results
🟠 IDEXUSDT: Spot Buy Area | %26 Profit if You Trade with MSB
📌 USUALUSDT: Buyers Are Active + %70 Profit in Total
🌟 FORTHUSDT: Sniper Entry +%26 Reaction
🐳 QKCUSDT: Sniper Entry +%57 Reaction

Ethereum Tests Critical SupportFenzoFx—Ethereum bounced from $1,755 support but failed to create new lower lows. From a technical perspective, the downtrend triggers if bears push the price below this level.
In this scenario, the next bearish target could be the $1,525 support.

Ethereum Is About To Make Move !!!As Per current price action on Ethereum, Two Harmonic Patterns, Bat & Alt. Bat are forming on Ethereum, and right now price is at PRZ of both patterns. If price reclaims range low, then we may probably will see ethereum exploding upto mid range range high and even further beyond forming new ATH.

Awakening of #ETH – Return of the Bulls and Wedge Breakout📊 Overview of the BYBIT:ETHUSDT.P Situation on 4H and 1D Timeframes
✅ Trend and Technical Indicators:
➡️ The chart shows a strong downtrend that began in late December 2024, when the price dropped from a peak of around 3400 USDT to 1620 USDT by March 2025.
➡️ A correction followed, with the price recovering to around 2100 USDT, where it is currently consolidating.
✅ Volume: The volume at the bottom of the chart was high during the drop, confirming the strength of the bearish trend. Now, volume is decreasing, which may indicate a weakening momentum.
✅ Patterns: A Rising Wedge pattern is forming on the chart — typically a bearish signal, especially after a strong downtrend. This may suggest a potential reversal to the downside.
➡️ A Falling Wedge pattern appeared earlier, and its breakout upward gave a short-term bullish impulse.
✅ Positive Factors:
➡️ Price bounced from a strong support level at 1620 USDT, which gives bulls hope for recovery.
➡️ Declining volume may indicate seller exhaustion.
➡️ The earlier breakout of the Falling Wedge supports the current correction.
✅ Negative Factors:
➡️ The Rising Wedge now forming is a bearish pattern, and a breakdown could lead to further decline.
➡️ The overall trend remains bearish, and price has yet to break through key resistance levels (e.g., 2400 USDT).
➡️ The crypto market, especially BYBIT:ETHUSDT.P remains volatile, and external factors (news, macroeconomic conditions) could significantly impact movement.
📉 4H Timeframe:
➡️ A Rising Wedge is forming; price is testing the upper boundary of the wedge and a key resistance level at $2,101.
➡️ There's a potential retracement zone targeting $1,839 — aligned with the lower edge of the wedge and a liquidity area.
➡️ Support exists at $2,068 and $2,041, but if the wedge breaks downward, the decline may accelerate.
➡️ Volume is increasing, confirming active participation and the importance of this zone.
📈 1D Timeframe:
➡️ BYBIT:ETHUSDT.P bounced from a demand zone and is currently testing the $2,100 area.
➡️ The next strong resistance lies between $2,308–$2,367, and the previous downtrend hasn’t been fully broken yet.
➡️ There's a glimmer of strength on the daily (a +4.5% candle with notable volume), but the move is not yet confirmed as a sustained uptrend.
➡️ A breakout from the Falling Wedge is confirmed — a bullish pattern that played out.
➡️ Price has broken above the descending channel (orange line), increasing the likelihood of a trend reversal.
➡️ The measured target from the wedge breakout is around POC $3,373, aligning with previous volume accumulation — ambitious but logical.
⚠️ Risks / Limitations:
➡️ If price fails to hold above $2,101 and drops below $2,068, a return to $1,955 or even $1,839 is possible.
➡️ Volume is present but the momentum must be confirmed in the next 1–2 days.
📍Important Note:
👉 On 4H – a bearish setup is forming.
👉 On 1D – a weak recovery attempt, still under pressure.
👉 A reaction from the $2,100 zone is critical: either a rejection downward (per the wedge), or a breakout that invalidates the bearish setup.
👉 This area is a decision zone — a key point for planning potential trades.
📢 Conclusion: A breakout, retest, and confirmation of the structure and volume are visible.
🔵 Bullish Scenario:
➡️ The Falling Wedge breakout confirms a bullish impulse. The target at 3373.83 USDT looks realistic long-term, if price breaks 2100 USDT and holds above 2400 USDT.
➡️ To confirm this scenario, we need volume growth and a breakout of major resistance levels (e.g., 2400 USDT and above).
🔴 Bearish Scenario:
➡️ The Rising Wedge identified earlier remains valid. If this pattern plays out, the price may drop to 1901.73 USDT or even lower, to 1620 USDT.
➡️ The long-term downtrend (marked by a red line) is still intact, supporting the bearish outlook.
📉 LONG BYBIT:ETHUSDT.P from $2102.90
🛡 Stop loss at $2083.00
🕒 Timeframe: 1D (Mid-term idea)
✅ Overview:
➡️ BYBIT:ETHUSDT.P Falling Wedge breakout confirmed on the daily chart.
➡️ Successful retest of the $1,955–$2,041 zone.
➡️ Holding above $2,101 opens the way to higher levels.
➡️ Volume is increasing post-breakout — confirming buyer interest.
➡️ Next strong resistance block lies between $2,308–$2,522.
🎯 TP Targets:
💎 TP 1: $2112.00 — nearest resistance and key liquidity zone.
💎 TP 2: $2125.00 — a critical daily level, zone of pullback from previous drop.
💎 TP 3: $2134.00 — potential impulse target toward major POC ($3,373).
📢 If price fails to hold above $2,068 and breaks below $2,041 — the setup is invalidated.
📢 A retest of $2,101 from below may be needed before a stronger upward move.
📢 Volume support at $1,955 is critical for the bullish case.
🚀 BYBIT:ETHUSDT.P is forming a potential mid-term reversal — if price holds above $2,101, a move toward $2,200+ and beyond is expected.

ETH/USD – Bullish Breakout & Buying OpportunityEthereum has broken out of a descending channel and is consolidating near a key support zone. The price action suggests a potential bullish continuation, with a buying opportunity forming above the $2,000 - $2,100 support level.
Key Levels to Watch:
Support: ~$2,000, ~$1,800
Resistance Zone: ~$2,250
Target: ~$2,530
Trading Plan:
Buy Entry: On breakout and retest above $2,250
Stop-Loss: Below $2,000
Take-Profit: $2,530
If Ethereum successfully breaks resistance with volume confirmation, it could rally toward $2,500+, making this a strong bullish setup. Keep an eye on price action for confirmation. 🚀

Ethereum (ETH/USD) Breakout – Next Targets $2,328 & Beyond!
Overview:
Ethereum has been in a downtrend, forming a descending channel, but it recently found strong support at $1,764 and has now broken out of a range-bound consolidation. This could be the beginning of a bullish move towards higher resistance levels.
Key Market Structure Analysis:
🔸 Previous Downtrend: ETH was trading within a bearish channel, creating lower highs and lower lows before bottoming out.
🔸 Accumulation Phase: A sideways consolidation range between $1,764 - $2,017 formed after the downtrend, signaling potential accumulation.
🔸 Breakout Confirmation: ETH has broken above the $2,017 resistance, suggesting that buyers are stepping in.
Potential Trade Setup:
✅ Bullish Scenario:
A successful breakout retest around $2,000 - $1,950 could provide an entry opportunity.
Upside targets:
🎯 $2,328.95 – Major resistance level from previous price action.
🎯 $2,559.17 – Next key resistance if momentum continues.
⚠️ Bearish Scenario (Invalidation):
A drop below $1,950 - $1,900 could push ETH back into the previous range.
Losing the $1,764 support could lead to a retest of $1,600 or lower.
Final Thoughts:
Ethereum is showing strength after breaking out of a key consolidation range. If the breakout holds, ETH could be gearing up for a strong rally toward $2,328 - $2,559. However, a retest of the breakout zone may provide a better risk-to-reward entry.
What do you think? Will ETH push toward $2,328 next? Drop your thoughts below! 🔥📈

JUST IN: Ethereum ($ETH) reclaims $2,000The price of the first altcoin (I.e alternative coins) Ethereum ( CRYPTOCAP:ETH ) surged 5% to $2030 price levels reclaiminng the $2k price point. Albeit the general crypto landscape is facing consolidation CRYPTOCAP:ETH seems to break the nuance. This move by Ethereum is tandem with the incoming Ethereum upgrades called "Pectra Upgrade""
The Pectra upgrade is bringing faster transactions, lower fees, & better staking to ETH! With account abstraction (EIP-7702) & higher staking limits (EIP-7251), Ethereum is stepping up its game against Solana!
Technical Outlook
As of the time of writing, CRYPTOCAP:ETH is up 5.12% with a bullish Relative strength index (RSI) of 69 hinting at a continuous rising trend. The 38.2% Fibonacci retracement level is serving as pivot point a move to the $2300 zone would catalyse a bullish spree for Ethereum.
Ethereum Price Live Data
The live Ethereum price today is $2,027.90 USD with a 24-hour trading volume of $13,340,876,260 USD. Ethereum is up 7.20% in the last 24 hours. The current CoinMarketCap ranking is #2, with a live market cap of $244,618,878,972 USD. It has a circulating supply of 120,626,703 ETH coins and the max. supply is not available as per data from CMC.

Ethereum's Current Consolidation: Will It Move Up or Down...?BINANCE:ETHUSDT Ethereum Consolidating Between $1820 and $1950: Will It Break Upside or Downside..?
Ethereum has been trading in a consolidation range between the $1820 and $1950 levels since last week. As the price oscillates within this range, market participants eagerly await a breakout in either direction. The big question is: will Ethereum break upwards or downwards? Let's analyze two potential scenarios based on key price levels and liquidation points.
Scenario 1: Upside Breakout and Potential Rally
One key level to watch is the $1950 resistance. Ethereum has struggled to break past this level, but if the price manages to break above and sustain above $1950, there is a significant upside potential.
Why? At the $1994 level, there is approximately $1.16 billion in liquidations waiting to happen. If Ethereum pushes past the $1950 resistance and approaches this $1994 mark, the surge of liquidations could provide the momentum for a continued rally.
In this scenario, a good strategy would be to wait for a retest of the $1950 level as support, confirming the breakout. If the price holds above this level, it may be a good time to enter a long position, riding the potential bullish move.
Scenario 2: Downside Breakout and Further Decline
On the other hand, if Ethereum fails to hold above the $1820 support and breaks below this level, a downside move could be on the horizon. The next significant support lies around the $1785 level, where around $900 million in liquidations are waiting.
A break below $1820 could trigger a sharp decline toward this liquidation point at $1785. In this case, entering a short position after a retest of the $1820 resistance-turned-support could offer a solid opportunity for traders looking to capitalize on the downtrend.
Conclusion
Ethereum’s consolidation between the $1820 and $1950 levels presents two distinct scenarios. If the price breaks above $1950 and sustains that level, there is upside potential, with liquidation at $1994 offering a bullish catalyst. However, a break below $1820 could open the door for further downside, with liquidations at $1785 triggering a possible downtrend.
Traders should keep a close eye on these levels for confirmation and act accordingly based on the direction Ethereum takes in the coming days.

Ethereum at Critical Levels – Breakout or Breakdown for ETH?Ethereum (ETH) is looking heavily overextended right now 📊, with price action pressing into key support zones on the daily and weekly charts ⏳. The market is at a critical juncture, and a sharp pullback 📉 could be on the cards.
This could present a short-term counter-trend buying opportunity on the lower timeframes 💰, but if ETH pushes higher, it may offer a prime short setup 🎯.
⚠️ Not financial advice – trade smart and manage risk accordingly! 🚀

ETH → Gearing Up for $10,000!? Or $1,200? Let's Answer.Ethereum finally fell into my buy zone this past week and I was able to buy with an average price of $2,185.18. This is a target I've been watching for months in anticipation. The best part is that it may go lower!
How do we trade this? 🤔
ETH has landed on a key support area of $2,100 and is now flirting with falling to the .236 Fib level at $1,800. A final target would be around $1,500 which brings us back into the bear market range. ETH formed a triple top over the course of 2024 and as expected, it pulled back hard with the alt market.
Bitcoin Dominance has been in a bull trend since the last cycle and hasn't shown any signs of weakness yet. Currently at 62%, it could jump up to 70% easily. Until it drops, ETH and the alts are going to remain bleeding out.
I'm targeting the previous all-time high for a first profit target, around $4,800. Whether I take profits at that level depends on the price action leading up to it. If we get a strong push with strong candle closes leading up to that price, I'll likely hang on. Otherwise, I may take 25% of my position off the table and look for a potential re-entry.
Final target price is $6,750, just below the 1.618 Fib level. This level also corresponds with a measured move target if the price attempts $4,000, pulls back to the 3-Year Support, then moves up again. I believe $10,000 ETH is absolutely possible for this run, but given how slumpy the alt market is, I don't see that probability being as high as the previous high of $7,000. This is why I'm taking my profits before that 1.618 Fib level is hit.
💡 Trade Idea 💡
Long Entry: $2,185.18
🟥 Stop Loss: $700
✅ Take Profit #1: $4,800
✅ Take Profit #2: $6,750
⚖️ Risk/Reward Ratio: 1:3
🔑 Key Takeaways 🔑
1. 2024 Triple top led to a retrace down to the 2023 range.
2. First buy at $2,185.18, potential buy at $1,800 and $1,500
3. Stop loss at $700 below the 2022 bear market low
4. Holding the position until the previous all-time high around $4,850 where the first take profit waits. $6,750 is the second take profit just before the 1.618 fib level
5. Weekly RSI is near 34.00 and below the Moving Average. This is a good level to buy.
💰 Trading Tip 💰
Ascending Wedges signal an increased probability of a bear breakout. Combined with three pushes up in a bull trend and strong sell bars (candles with large wicks on their tops), creates conditions where a counter-trend trade is reasonable.
⚠️ Risk Warning! ⚠️
Past performance is not necessarily indicative of future results. You are solely responsible for your trades. Trade at your own risk!
Like 👍 and Follow to learn more about:
1. Reading Price Action
2. Chart Analysis
3. Trade Management
4. Trading Psychology

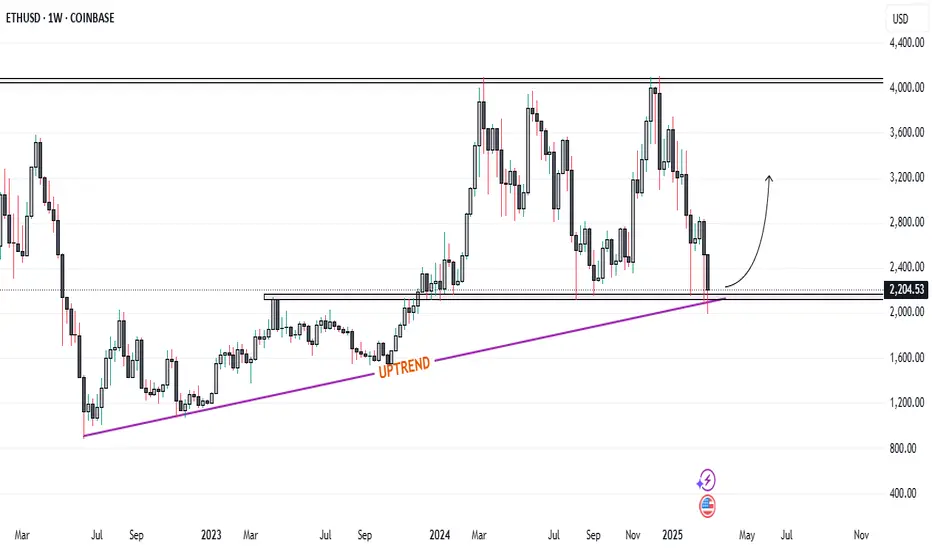
Ethereum Holds Key Support at Weekly Trendline: What's Next...?Ethereum Holds Key Support at $2,100: Could a Rally to $4,000 Be Coming? Altcoin Season and Trump’s Crypto Summit as Potential Catalysts
Ethereum is currently finding support at a critical juncture, with the price holding steady at the weekly uptrend line and an important support level around the $2,100 mark. Historically, every time Ethereum has tested this support zone, it has bounced significantly, often making strong moves toward the $4,000 level. The question now is whether history will repeat itself.
At this point, Ethereum’s ability to maintain this support level is crucial. With the market in a generally cautious state, Ethereum's resilience at this key level could signal the potential for a powerful rally in the near future. The broader crypto market is also awaiting the highly anticipated "altcoin season," where altcoins—especially Ethereum—could see a surge in demand, potentially driving prices higher.
Adding to the excitement, former U.S. President Donald Trump is set to host a crypto summit at the White House on March 7. This event could serve as a major catalyst for the next crypto rally, especially if significant regulatory or institutional insights emerge. The combination of Ethereum holding its critical support, the potential for altcoin season, and the White House summit could create the perfect storm for a significant price movement in Ethereum.
As Ethereum continues to hover around the $2,100 mark, traders and investors are closely watching for any signs of a breakout. If the rally to $4,000 materializes, it could set the stage for further gains, with the broader crypto market potentially following suit. The next few weeks could prove to be pivotal for Ethereum and the cryptocurrency space as a whole.
Ethereum 2000$ INCOMING!!!According to range trading rule on Ethereum, sweep and reclaim of range low at ethereum is expected which will finally make alts to boom

ETH in ICT (Bullish, Buy Area)1. We have a swing low.
2.+MSS (Market Structural Shift) on the hour Internal Structure)
3. Back to the Fib Golden Zone - after the MSS.
4. and now it has a good reaction from that area.
This is invalided IF BREAKS UNDER THE SWING LOW!!
Your opinions matter?????

Ethereum Analysis Ethereum Analysis
Ethereum is currently exhibiting a pattern similar to the one observed in Shiba Inu, with a clear downtrend that has led to the breakdown of a key support level. As of now, it seems to be retesting this broken support, though confirmation will only be possible once the current candle closes.
In my opinion, patience is critical in this scenario, and it would be wise to wait for the candle to close before considering any short positions. The broader trend still appears to be bearish, suggesting that Ethereum may not have exhausted its downward momentum just yet. However, market dynamics can shift rapidly, and it is important to remain vigilant and adapt to new information as it unfolds.
I would appreciate your thoughts on Ethereum's current price action and whether you agree with the assessment of a potential continuation of the downtrend. As always, thorough analysis, risk management, and due diligence are essential before making any trading decisions.
Cheers!

ETHEREUM NEAR ABOUT TO EXPLODE !!!We may see Ethereum drop upto 2700. where maximum chances are of completing it's C wave of micro wave (ii).

Ethereum's Downtrend: Flag and Pole Pattern Set for Breakout...Ethereum is currently on a downtrend from the 4100 resistance level, forming a flag and pole pattern. The next strong support level is at 2800, where we could see a positive move arise from either a breakout of the trendline, support at the 2800 level, or both co-occurring. It's important to patiently wait for a signal before making any decisions.

Executive Order 5555.Trump DeFi Force (TDF) has issued your orders.
You have 1 year to comply.
All your technical analysis are belong to us.
#PulseChain

Ethereum 4-Hour Analysis: Ascending Triangle Points to a BullishWhat’s Happening with Ethereum?
The trend is BULLISH, and we’re seeing a triangle pattern that could be the key to our next big trade. Let me break down my strategy so you can take full advantage of this move!
My Strategy:
Pattern Identification: We’ve spotted an ascending triangle on the 4-hour chart with a key resistance at $3,472.
Entry (Buy Limit) $3,472: If the price breaks this resistance with strength, we’ll place a buy order and aim for $3,878.
Risk Management: To protect ourselves from unexpected reversals, we’ll set a Stop-Loss at $3,095.
Key Confirmation: We’ll only enter if there’s increasing volume to avoid false breakouts.
Why This Strategy? An ascending triangle like this often signals a continuation of the bullish trend. With solid risk management, we’re aiming for a strong risk/reward ratio while staying aligned with the market’s momentum.
Disclaimer: This content is for informational and educational purposes only. It is not financial advice. Always do your own research and consult with a licensed financial advisor before making any investment or trading decisions. Trading involves significant risk, and past performance is not indicative of future results.

ETHEREUMUSDT | Risky Hedge ShortIn our previous ETHUSDT analysis, we mentioned the importance of the $4102 level and the possibility that our rapid entry into the range with its manipulation could lead to bad possibilities.
The price has entered the range again and continues to fall, but it is not nice that the liquidity remaining above is very open. Still, taking a short hedge is not a bad trade by taking the possibility of a losing 1R from here.
I keep my charts clean and simple because I believe clarity leads to better decisions.
My approach is built on years of experience and a solid track record. I don’t claim to know it all, but I’m confident in my ability to spot high-probability setups.
My Previous Analysis
🐶 DOGEUSDT.P: Next Move
🎨 RENDERUSDT.P: Opportunity of the Month
💎 ETHUSDT.P: Where to Retrace
🟢 BNBUSDT.P: Potential Surge
📊 BTC Dominance: Reaction Zone
🌊 WAVESUSDT.P: Demand Zone Potential
🟣 UNIUSDT.P: Long-Term Trade
🔵 XRPUSDT.P: Entry Zones
🔗 LINKUSDT.P: Follow The River
📈 BTCUSDT.P: Two Key Demand Zones
🟩 POLUSDT: Bullish Momentum
🌟 PENDLEUSDT.P: Where Opportunity Meets Precision
🔥 BTCUSDT.P: Liquidation of Highly Leveraged Longs
🌊 SOLUSDT.P: SOL's Dip - Your Opportunity
🐸 1000PEPEUSDT.P: Prime Bounce Zone Unlocked
🚀 ETHUSDT.P: Set to Explode - Don't Miss This Game Changer
🤖 IQUSDT: Smart Plan
⚡️ PONDUSDT: A Trade Not Taken Is Better Than a Losing One
💼 STMXUSDT: 2 Buying Areas
🐢 TURBOUSDT: Buy Zones and Buyer Presence
🌍 ICPUSDT.P: Massive Upside Potential | Check the Trade Update For Seeing Results
🟠 IDEXUSDT: Spot Buy Area | %26 Profit if You Trade with MSB
📌 USUALUSDT: Buyers Are Active

Ethereum's Pivotal Crossroads: Will Bulls or Bears Prevail?Ethereum is currently testing an intraday resistance level at $4,015, with market sentiment hinting at possible volatility in the near term.
A pullback to below $3,916 followed by a strong rebound would suggest buyers are still in control, potentially driving the price higher (Dashed Green Projections).
Alternatively, a clear break above $4,015 would confirm bullish momentum, opening the path toward the next resistance zone between $4,174 and $4,413, providing opportunities for further upside (Solid Green Projections).
On the other hand, a failure to hold $3,916 could indicate weakness, increasing the likelihood of a drop toward the support at $3,733.22. A breach below this level might signal the start of a broader corrective move, inviting short-term bearish pressure into the market.

ETH / USDT : Breaking out from trendline resistance ETH/USDT: Breaking Out from Trendline Resistance – A Bullish Surge Ahead?
Ethereum (ETH/USDT) is showing signs of strength 📈 as it breaks out of a critical trendline resistance zone 📊. After a period of consolidation, the price has successfully surpassed this key level, setting the stage for a potential bullish rally 🚀. The breakout indicates renewed buyer momentum, making ETH a pair to watch closely.
Key insights:
1. Trendline breakout: ETH/USDT has breached a significant trendline resistance that has acted as a barrier for weeks. This breakout could trigger a sustained upward move.
2. Volume confirmation: A noticeable surge in trading volume during the breakout is a positive signal, indicating strong buying interest 🔥.
3. Bullish indicators: Momentum tools like RSI and MACD are pointing upwards ⚡, adding further conviction to the breakout scenario.
Steps to validate the breakout:
Look for a confirmed 4H or daily candle closing above the trendline 📍.
Check for increased volume during the breakout to verify buyer strength 📊.
A successful retest of the broken resistance as new support can confirm the move’s credibility ✅.
Stay alert for potential fake breakouts with wicks above the trendline or sharp reversals ⚠️.
Risk management tips:
Place stop-loss orders below key support zones to safeguard your capital 🔒.
Adjust position sizes to align with your risk appetite and trading strategy 🎯.
This analysis is for educational purposes only and is not financial advice. Always conduct your own research (DYOR) 🔍 before making investment decisions.
