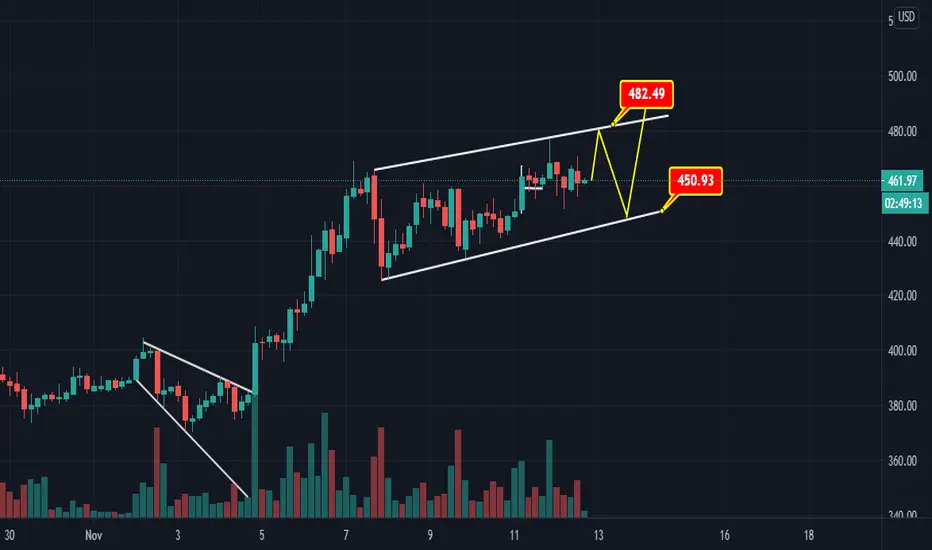
#ETHUSD ANALYSIS.. BEARS ARE READY.. I think investors should pay attention to death cross that took place in Ethereum a while ago, in this context, the possibility that the trend might reverse for Ethereum should not be ignored..
Death cross can have an effect like a short upward movement firstly and a deep correction phase for a long time.. In the technical indicators, the T3 curve may return to negative in the near future, and the coppock curve has turned its direction downward.. There is no clear sell signal yet, but in my opinion there are some leading indicators that the bears will take control the market.. I expect a price movement in #ETHUSD as I mentioned in the chart..
Disclaimer: What I wrote is not investment advice.. Please do your own due diligence when it comes to crypto-investing.. Never put in money that you cannot afford to lose.. Invest at your own risk..
I wish you all the best..
Ethereumanalysis
ETH|USD - TRADE SET UPS/OVERVIEWPrice activity is nearest the 50-bar MA (4-hourly) at 162.37 and the 50-bar MA (Hourly) at 173.28.
Technical Support is expected around 153.22/ 149.31/ 146.77 with Stops expected below.
Technical Resistance is expected around 185.38/ 196.54/ 206.29 with Stops expected above.
On 4-Hourly chart, SlowK is Bearishly below SlowD while MACD is Bullishly above MACDAverage.
On 60-minute chart, SlowK is Bearishly below SlowD while MACD is Bullishly above MACDAverage.
Ethereum (ETH/USD) gave back some gains in today’s North American session as the pair peaked around the 185.38 area. Stops were reached above the 177.39 area, a downside price objective related to selling pressure that emerged around the 252.99 area in March, and this represents ETH/USD’s strongest showing since then. Additional Stops were elected above the 184.01 area, an upside price objective related to buying pressure that originated around the 90.00 area, and intensified around the 148.08 area. Some buying pressure emerged around the 170.04 area during a pullback in Thursday’s North American session and yesterday’s Asian session, a level that represents the 76.4% retracement of the depreciation from 176.82 to 148.08. Below current price activity, traders will be curious to see how price activity will react around the 154.57 and 149.31 levels, representing the 61.8% and 76.4% retracements of the appreciation from 140.81 to 176.82. Another important range that traders are monitoring is the appreciation from 123.82 to 176.72, with the 150.27 level representing the 50% retracement and the 144.00 level representing the 61.8% retracement.
Another very important level that traders are watching is the 159.62 level, an upside price objective related to buying pressure that emerged around the 90.00 level in March. If the pair is able to resume its upward trajectory above current price activity, additional upside price objectives include the 196.54 and 206.29 levels. Below current price activity, downside price objectives include the 144.00, 140.81, and 136.25 levels. Chartists are observing that the 50-bar MA (4-hourly) bullishly continues to indicate above the 100-bar MA (4-hourly) and 200-bar MA (4-hourly). Also, the 50-bar MA (hourly) bullishly continues to indicate above the 100-bar MA (hourly) and 200-bar MA (hourly).
#ETHUSD.. DOMINATION OF BEARS WILL END SOON BUT FIRST... Bears will dominate the whole market for a while, but I firmly believe that these are the last zig-zags before a new market cycle..
We see wedge pattern on #ETHUSD weekly chart and I think, as I mentioned in the graphic, we will find the bottom we have been looking for for a long time.. I think the reference value of rsi 50 is very important, in this context, we can see a fractal as the leading indicator that sales will get harder soon, we will wait and see.. Also, the value of 0.95 for vortex has worked quite meaningfully from the past to the present, as it can be seen in the weekly chart of Ethereum, the value in question produces important clues for us and should be watched carefully in the future..
All these arguments point to a negative process in the medium term, my personal opinion is that Ethereum will drop up to $ 47 and gives a serious buying opportinuty before a new market cycle..
Sometimes you need to break your knees a bit more to jump higher..
Disclaimer: I am not a financial advisor.. Please do your own due diligence when it comes to crypto-investing.. Never put in money that you cannot afford to lose.. Invest at your own risk..
I wish you all the best..
ETH/USD LONG SET UP TO RETEST $176.00Title :ETH/USD BUY LIMIT ORDER
Asset : Crypto Symbol : ETH/USD
Type : Limit Order Time Frame : 4hr
Entry Price 1 : $148.86 Entry Price 2 : $144.48
Stop Loss : $139.48
Take Profit 1: $153.86 TP 2: $158.46
TP3: $163.86 TP.4 $176.48
Price activity is nearest the 50-bar MA (4-hourly) at 159.57 and the 100-bar MA (Hourly) at 163.28.
Technical Support is expected around 153.22/ 149.31/ 146.77 with Stops expected below.
Technical Resistance is expected around 164.56/ 167.45/ 176.82 with Stops expected above.
On 4-Hourly chart, SlowK is Bullishly above SlowD while MACD is Bearishly below MACDAverage.
On 60-minute chart, SlowK is Bullishly above SlowD while MACD is Bullishly above MACDAverage.
ENLA Auto Indicator called the Short on ETH for around 8% ProfitPossible Head & Shoulders with pump back in the upcoming week.
Crypto was build for Financial Crisis but the actually Situation is not just a financial crisis, it is more like the people need the Money for life and to protect theyr Businesses.
NO FINANCIAL ADVISE
ETH/USD LONG SET UP ON PULLBACKLast week’s major sell-off saw ETH/USD experience one of its most dramatic sell-offs ever, a move that exacerbated the downturn from the 290.00 area that began in February. Traders exited long positions and decoupled from risk associated with ETH/USD and a series of major Stops were triggered during the crushing move lower at many levels. These price areas included the 177.39, 161.62, 154.03, 133.40, 130.67, 105.18, and 101.76 levels. Additional downside price objectives include the 111.69, 103.40, 95.66, 90.00, and 80.60 levels.
MavRich Premium Signals (Faris Issa)
Title :ETH/USD BUY LIMIT ORDER
Asset : Crypto Symbol : ETH/USD
Type : Limit Order
Time Frame : 1Month
Entry Price 1 : $96.68
Entry Price 2 : $82.50
Stop Loss : $72.68
Take Profit 1: $120.68
TP 2: $132.50
TP3: $140.50
TP.4 $160.68
Price activity is nearest the 50-bar MA (4-hourly) at 158.83 and the 50-bar MA (Hourly) at 120.51.
Technical Support is expected around 100.15/ 95.66/ 80.60 with Stops expected below.
Technical Resistance is expected around 125.08/ 133.37/ 140.95 with Stops expected above.
On 4-Hourly chart, SlowK is Bearishly below SlowD while MACD is Bullishly above MACDAverage.
On 60-minute chart, SlowK is Bullishly above SlowD while MACD is Bullishly above MACDAverage
ETH 4H DivergenceBullish divergence on the 4H chart, this may result in a short term upside. My 'bait' wick analysis was incorrect, and i apologize to anyone that entered a trade. I will link it. This divergence shows promise for the short term, and margin / leverage traders however. Fortune favors the bold! Currently analyzing the success rate of these divergences.
Don't miss the great buy opportunity in ETHUSDTrading suggestion:
. There is a possibility of temporary retracement to suggested support line (238.70). if so, traders can set orders based on Price Action and expect to reach short-term targets.
Technical analysis:
. ETHUSD is in a Uptrend and the Continuation of uptrend is expected.
.The price is above the 21-Day WEMA which acts as a dynamic support.
. The RSI is at 80.
Take Profits:
TP1= @ 275.30
TP2= @ 319.45
TP3= @ 362.75
SL= Break below S2
Ethereum - $ETH - Heads-Up! I am Very optimist. The price close weekly above $166.75 a green candle in $ETH is coming.
Would be impressive though...
I really thought that we would see a retracement... but here we are... Welcome to trading.
Next levels to focus on are $167.4 and $174.
Reaching $174 will be a bullish heads up! Come on $ETH!
#ETHEREUM #CRYPTO
Don't miss the great buy opportunity in ETHUSDTrading suggestion:
. There is a possibility of temporary retracement to suggested support line (146.85). if so, traders can set orders based on Price Action and expect to reach short-term targets.
Technical analysis:
. Ethereum/US Dollar is in a range bound and the beginning of uptrend is expected.
.The price is above the 21-Day WEMA which acts as a dynamic support.
. The RSI is at 65.
. The RSI downtrend #1 is broken, so the probability of beginning of uptrend is increased.
Take Profits:
TP1= @ 163.30
TP2= @ 191.75
TP3= @ 223.20
SL= Break below S2
ETHEREUM 1/20 MOON TARGET DATEHello personal traders,
This is no secret.
Ethereum is on the rise.
Check ETH/BTC if you need reference, as well as market caps.
My logic is shown clearly on the graph with my indicators.
Buy and Hold Ethereum is my final call.
Thank you,
-dysonring2050
#whatwhalesdon'twantyoutoknow
Don't miss the great buy opportunity in ETHUSDTrading suggestion:
. There is a possibility of temporary retracement to suggested support line (147.35). if so, traders can set orders based on Price Action and expect to reach short-term targets.
Technical analysis:
. ETHUSD is in a range bound and the beginning of uptrend is expected.
. The price is below the 21-Day WEMA which acts as a dynamic resistance.
. The RSI is at 38.
Take Profits:
TP1= @ 168.00
TP2= @ 191.75
TP3= @ 224.15
SL= Break below S2
Ethereum Analysis: Daily Timeframe Conclusion for today's Ethereum Analysis: Price closing below ~176.49 implies more downside momentum in Ethereum.
The Daily timeframe (log scale) is examined in today's Ethereum analysis. Chart patterns examined that are plotted include a bearish price channel and a bullish trendline. The 200 day moving average is also plotted to help provide perspective for future development of price action. December 15, 2018 price swing that reached the 363.30 price peak (on June 26, 2019) has since been followed by a downtrend in Ethereum.
Part of the current downtrend includes a July 16, 2019 break below the long term bullish trendline that lasted over 6 months. Price action also did break below the 200 moving average after closing below the bullish trendline, adding to a current bearish bias in Ethereum.
Price levels plotted on the chart offer areas of support (188.81 to 167.64) and resistance (363.74 to 307.08) for Ethereum and need to be monitored closely for bullish or bearish swings. A close above the 200 day moving average is bullish and implies price resuming an uptrend that should reach the resistance zone at the minimum.
A break below 176.49 on the other hand improves the chances of continuing the downtrend from June 26, 2019.
ETHUSD formed bullish Butterfly | A long opportunityPriceline of Ethereum / US Dollar cryptocurrency has formed a bullish Butterfly pattern and entered in potential reversal zone.
This PRZ area should be used as stop loss in case of complete candle stick closes below this zone.
I have used Fibonacci sequence to set the targets:
Buy between: 181.73 to 180.32
Sell between: 182.82 to 185.47
Regards,
Atif Akbar (moon333)