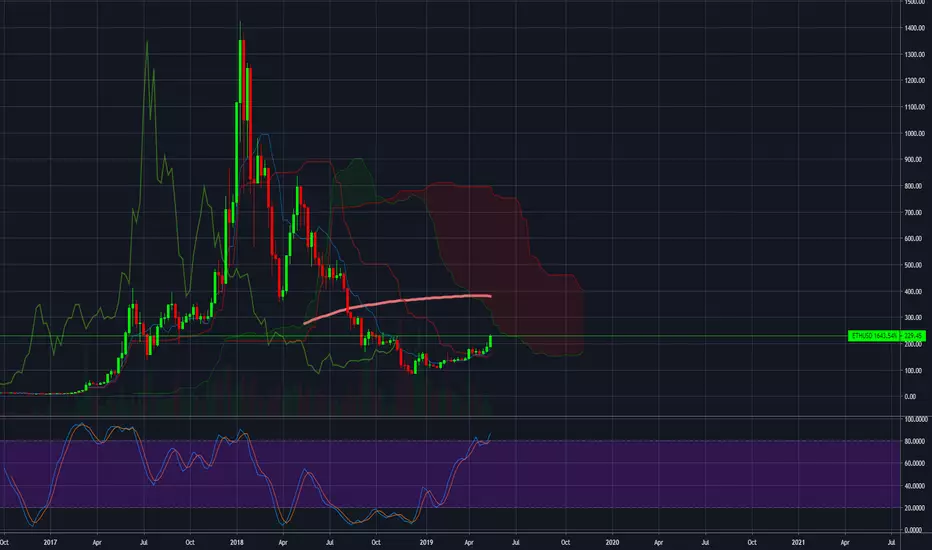
Ethereum analysis: Daily Timeframe Chart Patterns and 3 Things YConclusion for today’s Ethereum technical analysis: Key support for Ethereum lies between 123.87 and 139.31. A break below 123.87 implies more selling ahead...
The Daily timeframe chart is used in today’s Ethereum analysis (log scale) to provide the alternatives for future price action.
The previous uptrend in Ethereum from December 2018 to June 2019 has been broken to the downside (i.e. confirmation or close of price outside of bullish channel) and price remaining in the current downtrend.
The following are 3 important ideas and/or areas to focus on for future development in Ethereum price.
(1) Current falling wedge chart pattern (tentative): The downside motion of price from the June 25, 2019 peak to current date is captured using a falling wedge (or falling diagonal).
Eventual resolution to the upside is anticipated i.e. a break above the upper boundary of the wedge. This therefore presents a foundation for considering long positions from a conservative point of view with risk: reward ratios calculated accordingly before attempting a long (bullish) trade.
(2) Action of the 200 Day and 50 moving average: The 50 day moving average did cross below the 200 day moving average on September 4, 2019. This implies bearish sentiment in Ethereum is still active and reduces the chance of bullish momentum developing. Price action at the minimum should therefore close above the 50 moving average before the potential for any bullish trade can be considered. Even better is a close above the 50 moving average and also its slope turning upwards.
(3) Support at 123.87 and 139.31: The support region is crucial for Ethereum and requires monitoring to see if price gives way to the downside or if there is consolidation at or close to the support region. The aforementioned support region also coinciding with the bottom of the falling wedge signifies the validity of the region as support.
A break below the lower boundary (123.87) reduces the chances of any bullish price swing developing and rather argues for more downside action in Ethereum. Momentum indicators can also provide additional guidance.
Above all, the best course of action is to wait to see what transpires before pulling the trigger (long or short).
Ethereumanalysis

Is ETH beacon of hope?
Ethereum is right now exchanging at the estimation of $172.47 and its worth is expanding by 0.91%. The market capitalization of the money is $18,707,468,198 and the 24-hour volume of the cash is $7,158,803,681. The flowing inventory of the money is 107,953,283 ETH and the ROI of the cash is 6,019.90%.
Recently has been intense for the money as it experienced a great deal of high points and low points in the market. The worth arrived at the low estimation of $167.00 at 21:00 UTC, nonetheless, the money recuperated the worth and accomplish the estimation of $169.56. Then again, the money likewise exchanged at the high estimation of $175.43 at 15:39 UTC yet it doesn’t remain there for long and esteem before long began diminishing and reach up to the $167. The money is consistently under bearish weight this week, it begins the week with the high estimation of $200 however the cash began exchanging under bearish weight.
News Source: TheCoinRepublic

Ethereum Technical Analysis: Bearish Momentum Slowing Down?Conclusion for today’s Ethereum Analysis: Price closing above ~204.18 implies higher Ethereum price.
Ethereum Analysis for today is provided on the 6 hour (intraday) timeframe that covers over 9 months of market action. The bullish channel in Ethereum that started in December 2018 and reached a price peak of 363.18 on June 26, 2019 is plotted on the chart.
A reversal candle marked the end of the channel with Ethereum selling off to not only test the lower boundary of the channel, but break and close below it. A falling wedge chart pattern is indicated on the chart to provide perspective for the meandering price action from the June 26, 2019 peak to date. The falling wedge is ideally bullish and implies price eventually breaking the upper boundary of the pattern and moving upwards.
The 200 moving average along with the 50 moving average both maintain a down trending slope which suggests that bearish force in Ethereum is still very active and therefore provides chances for more downside action. Any movement to the downside would be expected to test the lower boundary of the wedge and should not move past if any bullish momentum is to develop.
Alternatively, price moving past ~176.58 that goes on to break the upper boundary of the wedge (confirmation of pattern) should produce fresh bullish momentum in Ethereum.

ETH Bears Continue to Push ETH Price Down?In the ongoing fall of the Crypto advertise, Major Cryptos have declined in the exchange against USD. Ethereum has indicated major Bearish conduct from the previous week, Ethereum is positioned at #2 in the crypto showcase and has an all out inventory of 107,885,087 ETH. It has a net market top of $18,234,913,436 USD .
Ethereum is presently exchanging at $169.02 USD, and in the previous 24 hours, its volume is seen at $13,159,465,485 USD with a coursing supply of 107,885,087 ETH. Ethereum hit a record-breaking high of $1,432.88 USD on the thirteenth of January 2018, likewise its least worth was estimated at $0.420897 USD on the 21st of October 2015. In the previous day, Ethereum exchanged its most astounding at $203.50 USD and the least at $162.73 USD. As thought about today, Ethereum has diminished a sum of - 16.71%, which is $-33.73 USD.
News Source: TheCoinRepublic

Ethereum Price Analysis - ETH Most Likely to Stay Above $200
Relative Strength Index: The RSI is currently at a healthy 41 points. This signals some sideways trading up ahead.
Bollinger Bands: The price is also within the bands' range, however it's touching the lower band. This means the price will try to rebound slightly, at least until the MA line.
Volume: There is very little volume for Ethereum at the time of writing, most likely attributed to the fact that it's the weekend. This means the market most likely won't make any major moves anytime soon.
Ethereum Price Prediction
The RSI, BBs and Volume are all signalling a sideways market up ahead. Combine that with the news that Ethereum is gearing up for ETH 2.0, and we should anticipate some bullish momentum in the coming weeks.
My prediction is that ETH will trade at the $200-$210 level for the next few days, before testing new support at higher levels.
Read Full Ethereum Price Analysis and Prediction: Cryptomode

ConsenSys Announced Kavita Gupta Left her Role As Founding partn
Consensys is one of the main blockchain innovation firms, it is a New York-based firm established in 2014 by Joseph Lubin. Kavita Gupta leader of the ConsenSys joined the organization, ConsenSys Venture in 2017 as it was propelled in San Francisco, administrating the financial limit of $50 million subsidized by the Co-author of the Ethereum and ConsenSys, Joseph Lupin.
As of late, in the report distributed in The Block that Kavita Gupta has left the place of employment of the leader of the ConsenSys Venture. This news turns out as a stun to the individuals in the digital currency industry. She has worked for such a long time for the ConsenSys Venture and had real jobs in the undertakings, for example, startup Blockfi, the blockchain framework firm StarkWare. She has eminent association in giving the organization status as one of the main firms in the blockchain organizations.
News Source: TheCoinRepublic

Ethereum Technical Analysis: Bull move on the move...Conclusion for today’s Ethereum Analysis: Price breaking below ~177.65 implies continuation of the current downtrend in Ethereum.
Ethereum analysis for today is carried out on an intraday (4 hour) timeframe candlestick chart that focuses on price action since the last week of June of current date. A head and shoulders top pattern (ideally bearish) that confirmed on a break below its neckline did provide a topping action in Ethereum with lower prices following afterwards.
The 50 moving average also crossing below the 200 moving average on July 14, 2019 did provide additional bearish bias favoring lower Ethereum price. Signs of bearish hesitation are indicated on the chart by horizontal green lines which mark an area of support for Ethereum price.
A price low of 163.62 was achieved on August 29, 2019, while a second attempt at pushing price lower only reached the 165 price level (September 06, 2019). The implication therefore of price holding at support favors a bullish momentum to the upside.
Also worthy of note is the current action of the moving averages which shows the 50 moving average attempting to cross back above the 200 moving average (since its July 14, 2019 cross below). A successful completion of a cross will provide additional bullish momentum and argue therefore against selling Ethereum.
A close below ~177.65 poses a challenge to the bullish analysis for Ethereum and rather suggests a possible resumption of the current downtrend in Ethereum price.

ETHUSD forming a bullish gartley | A good long opportunityPriceline of Ethereum / US Dollar is forming a bullish gartley and soon it will be entered in potential reversal zone insha Allah.
We have a golden cross formation expected below the PRZ are between 100 simple moving average and 200SMA.
I have used Fibonacci sequence to set the targets:
Buy between: 180.27 to 178.55
Sell between: 181.61 to 184.85
Regards,
Atif Akbar (moon333)

ETHUSD formed bullish BAT | A good long opportunityPriceline of Ethereum / US Dollar cryptocurrency has formed a bullish BAT pattern and entered in potential reversal zone.
I have defined the targets using Fibonacci sequence:
Buy between: 175.64 to 174.67
Sell between: 177.96 to 181.45
Regards,
Atif Akbar (moon333)

now we got confirmation to buy ether !!take action fast as possible we have very secure stop loss
good luck join our team soon !!
#bank trader

Ethereum Good opprtunity to buy now (ETHUSD)Hello Traders,
in this chart i'm sharing Ethereum analysis good long opprtunity now,
You can place buy bid with SL and before invest also do your own research as well.
Our previous success analysis:
Legal disclaimer: I am not a financial advisor, You trade at your own risk and nobody can guarantee you results.
Global Rashid
The Guide To The Right Path

Ethereum Technical Analysis:Break below bullish trendlineConclusion for today’s Ethereum analysis: Price closing above ~246 is bullish for Ethereum price.
Ethereum price analysis for today is carried out using a log scale on the Daily timeframe. A candlestick chart is used with price action displayed from the January 2018 to current date.
The previous bearish trendline in Ethereum is indicated on the chart prior to a successful break above its upper boundary in March 2019. The bullish swing also since December 2018 is also represented with the use of a bullish trendline.
Resistance for Ethereum price is currently marked between 307.08 and 363.74, with the latter representing a price level where a change of polarity can be observed on the Daily timeframe. In essence, the 363.74 price level will be key to watch and will be important for future price development.
A break below the Daily timeframe bullish trendline that lasted over 6 months implies bearish implications. Adding to the current bearish bias is also a consolidation of price just below the trendline. However, the 200 Day moving average (MA) plotted on the chart offers support for Ethereum price, as well as the upper boundary of support between 188.81 and 167.64.
As a result, price moving to the upside from 200 Day moving average and price capturing closing above ~246 will argue for a bullish bias in Ethereum.

#ETHUSD#Ethereum, Operating instructions for AugustWe have been stuck for a month between $ 197 and $ 233 and we expect it to continue for another month.
So what can be done by then? Buy as close as possible to support $ 197 and sell as close to resistance as $ 233.
If you are a trader who wants to trade only with the trend then wait for the price to approach $ 233 and then sell.

we found it good to take action ether usd in bank level buy zone ,
hopefully reach our target soon
good luck

Ethereum bearish But not much!ETHBTC have broken the blue support line but no volume followed. it seems ethereum is ranging and does not care about ressitance. so a conclude that this blue line support is no longer valid. i think ethereum will surprise us rallying to the up side. i drew a support area. may be ethereum will bounce from these levels.

ETH Ethereum Buy The Bounce Or The Breakout!What ill be waiting for to play out this week with Ethereum is waiting for a Bounce above previous resistance or buying a breakout!

Ethereum Technical Analysis: Intraday Bearish Chart PatternConclusion for today’s Ethereum price analysis: Lower price is expected in Ethereum with ~239.74 as the minimum expectation.
Ethereum analysis for today is carried out on the 4 hour timeframe using a candlestick chart. May 11, 2019 to current date is examined with the duration including a bullish trend from ~168 to 363.18 on June 26, 2019.
Ethereum sell off after reaching the June 26, 2019 peak involved the formation of a Head and shoulders top pattern that is not yet complete. Confirmation of the bearish implication of the pattern occurs when price closes below the neckline as highlighted on the chart.
Trajectories for the price of Ethereum are also drawn on the chart which includes price continuing to sell off to the expected target or a quick move to test resistance at the 326 price level prior to resumption of bearish strength.
Projection of target for Ethereum can be carried out by measuring the vertical distance from the peak of the head and shoulders pattern to the origin of the neckline at ~275.05. Same distance is projected below the breakout below the neckline when the pattern becomes confirmed
Price moving instead above the 326 price level as well as the June 26, 2019 peak in price invalidates the above analysis.

Not the end of the ups! #ETHUSD#EthereumThe Ethereum range from 228 support to 288 resistance, because we are very close to support we recommend Buy, according to the Stochastic the Ethereum has reached the bottom and the rallies on the way
Take profit: 288

Ethereum Price Analysis: 6 Hour Timeframe Chart PatternsConclusion for today’s Ethereum technical analysis: Price closing above ~325.30 implies further bullish strength in Ethereum.
Ethereum analysis for today is presented on a 6 hour timeframe candlestick chart with major focus on the uptrend in Ethereum (ETHUSD) since December 15, 2018. Context is provided for price action ever since then using a bullish price channel.
Ellipses on the chart indicate price pivots used to draw the channel with the most recent pivot i.e. (148.88) occurring on April 25, 2019. The most recent peak in Ethereum achieved on May 16, 2019 at ~279 failed to test the upper boundary of the channel and is therefore a sign of weakness in bullish strength.
Also indicated close to the recent peak in price action for Ethereum is a pennant structure which is ideally a continuation pattern, and in this case, bullish. On the other hand, price closing below ~224.77 further decreases the chance of a bullish move and suggests the bottom of the channel at ~186.84 as the next target.
Trading Ethereum for a bullish (long) position(s) is considered most conservative if an order(s) is placed upon break above ~325.30. This ensures that price has successfully ejected from the bullish channel and also the pennant structure would have been confirmed.
Less conservative strategies would seek to buy as soon as pennant is confirmed by price closing above ~262.25 since the implication of the chart pattern in a continuation position is the resumption of the previous trend.
On the other hand, price closing below ~224.77 further decreases the chance of a bullish move and suggests the bottom of the channel at ~186.84 as the next target. 156.73 and 148.43 represents immediate support for Ethereum below the bullish channel and price closing below 148.43 indicates further bearish strength.

Ethereum Makes a Bullish crossover against BitcoinPast week has been quite crazy in terms of the crypto market with Bitcoin dominance rising, but now overall we see a trend of altcoins rising and this seems to be confirmed by the bullish cross over by Ethereum. The Bollinger bands suggest that ETH did hit the resistance line and then bounced back and has crossed the neutral line to the outer band. The RSI Indicator also is on the rise and is at 61 which confirms the Momentum.
The next target price seems to be 0.035 against BTC, but it wouldn't come without the necessary corrections in between as the ETCHBTC is hovering around 0.032.
Please note that the trade calls are the authors opinions based on technical analysis and hence readers are requested to do their own in depth study before investing.

Simple logic why we are on the way to 370 #EHT/USDIn recent years, Bitcoin has set the tone for all other currencies, including the Ethereum.
A few days ago, the Bitcoin began a big climb and after a few days, the rest of the cryptocurrency joined the party.
On the weekly chart of the Bitcoin we can see that the Bitcoin has already crossed the 100 moving average line and here too we believe that it will at least touch it and perhaps even cross it.
Therefore our signal is a buying signal with a target of 370.
A trading opportunity to buy in ETHUSDMidterm forecast:
While the price is above the support 162.650, beginning of uptrend is expected.
We make sure when the resistance at 264.800 breaks.
If the support at 162.650 is broken, the short-term forecast -beginning of uptrend- will be invalid.
Technical analysis:
While the RSI support #1 at 44 is not broken, the probability of price decrease would be too low.
A trough is formed in daily chart at 148.700 on 04/26/2019, so more gains maximum to Major Resistance (264.800) is expected.
Price is above WEMA21, if price drops more, this line can act as dynamic support against more losses.
Relative strength index (RSI) is 74.
Trading suggestion:
. There is a possibility of temporary retracement to suggested support zone (187.50 to 162.65). if so, traders can set orders based on Price Action and expect to reach short-term targets.
Beginning of entry zone (187.50)
Ending of entry zone (162.65)
Entry signal:
Signal to enter the market occurs when the price comes to "Buy zone" then forms one of the reversal patterns, whether "Bullish Engulfing" , "Hammer" or "Valley" in other words,
NO entry signal when the price comes to the zone BUT after any of the reversal patterns is formed in the zone.
To learn more about "Entry signal" and the special version of our "Price Action" strategy FOLLOW our lessons:
Take Profits:
TP1= @ 264.800
TP2= @ 309.100
TP3= @ 348.800
TP4= @ 393.550
TP5= @ 475.300
TP6= @ 534.700
TP7= @ 630.500
TP8= @ 822.550
TP9= @ 970.450
TP10= @ 1229.700
TP11= @ 1415.950
TP12= Free

Ethereum Technical Analysis: Next Bullish Target.... Conclusion for today’s Ethereum price analysis: Price closing above ~252 implies more bullish upside in Ethereum.
Ethereum chart provided for this analysis is a Daily timeframe candlestick chart that uses a logarithmic scale. Previous Ethereum analysis focused on the 6 hour timeframe and the chart pattern formations (tentative) to be aware of for future price development.
The main goal for today gives major consideration to the chart pattern developing on the Daily timeframe to understand the tendencies for price action. A rising wedge (diagonal) chart pattern is identified to provide context for Ethereum price from the low achieved on December 14, 2018 to current date.
The above mentioned chart pattern is ideally bearish. However, price trading currently between 192 and 194 at the upper boundary of the wedge implies a potential breakout to the upside and bullish momentum strengthening.
Of important notice also is 192.30, which is the lower boundary of horizontal resistance coinciding with the upper boundary of the wedge. A close above the aforementioned price level presents 252.84 as the next challenge for continuation of bullish momentum.
Buying on a breakout above 252.84 is thus considered a conservative strategy to go long (buy) Ethereum while buying prior to that is less conservative. Lastly, the Average Directional Index (ADX) shown at the bottom of the Daily timeframe Ethereum chart shows the ADX line with a positive rising slope with the +DI line well above –DI line.
This implies that current trend strength favors Ethereum bulls and prices should keep moving higher.
Price closing below ~148 and also the bottom of the wedge implies an increase in bearish strength that could lead to price closing below its December 14, 2018 low of ~80.96.
