ETH/USD "ETHEREUM" Crypto Market Heist Plan on Bullish SideHi there! Dear Money Makers & Robbers, 🤑 💰
Based on Thief Trading style technical analysis, here is our master plan to heist the ETH/USD "ETHEREUM" Cryptocurrency market. Please adhere to the strategy I've outlined in the chart, which emphasizes long entry. Our aim is the high-risk Red Zone. Risky level, overbought market, consolidation, trend reversal, trap at the level where traders and bearish robbers are stronger. So Be Careful, wealthy and safe trade.
Entry 📈: Acceptable anywhere; I advise placing buy limit orders within a 15-minute Chart. The entry for the Recent/Nearest Low Point should be in pullback.
Stop Loss 🛑: Using the 4H period, the recent swing low
Goal 🎯: 4600.0
Scalpers, take note: only scalp on the long side. If you have a lot of money, you can go straight away; if not, you can join swing traders and carry out the robbery plan. Use trailing SL to safeguard your money 💰.
Warning : Our heist strategy is incompatible with Fundamental Analysis news 📰 🗞️. We'll wreck our plan by smashing the Stop Loss 🚫🚏. Avoid entering the market right after the news release.
Take advantage of the target and get away 🎯 Swing Traders Please reserve the half amount of money and watch for the next dynamic level or order block breakout. Once it is resolved, we can go on to the next new target in our heist plan.
💖Supporting our robbery plan will enable us to effortlessly make and steal money 💰💵 Tell your friends and family to follow, like, and share. Boost the strength of our robbery team. Every day in this market make money with ease by using the Thief Trading Style.
I'll see you soon with another heist plan, so stay tuned 🫂
Ethereumanalysis

Crucial Moment for ETH/BTC- ETH/BTC is approaching the end of a symmetrical triangle formation on the daily chart, which began back in July 2022.
- The CM Williams Vix and Ultimate RSI indicators suggest that the bottom was established in late March 2023.
- Currently, ETH/BTC is testing a significant resistance line that has held strong since July 2017.
Additionally, considering the Bitcoin Dominance nearing a resistance point (see attached analysis below), it wouldn't surprise me if we witness a breakout for ETH/BTC, resulting in a decreasing Bitcoin dominance and Ethereum outperforming BTC at the moment.
I will conduct further analysis below using other timeframes

Ethereum Momentum- Very quick update.
- Ethereum is nearing a critical breakout from this triangle.
- Once it breaks, it could go parabolic, potentially soaring to $15,000
- Altcoins will follow.
- brace yourself as time is ticking.
Happy Tr4Ding !

Like altseason arrived: ETH follows bullish chart patternsHello,
Like altseason arrived, Ethereum established a bullish trend in the green channel. Furthermore, the price has been in the consolidation of a symmetrical triangle (green triangle), which seemingly broke upward. The bullish channel and the symmetrical triangle indicate the optimal risk-reward ratio for a long position. If the break isn't a bull trap, ETH might continue going up until the $4500 psychological resistance, which aligns with the top of the channel. Breaking the channel upward could send ETH to $5300.
Following a bearish scenario, ETH might be rejected from the current price (top of the triangle), in which case, it might find support at $3400 - the middle of the channel.
Regards,
Ely

Healthy growth on EthereumEthereum is in an uptrend according to the Exponential Moving Averages (EMAs), but more importantly, the current price ($3700) is about EMA 20. Buying Ethereum at an average price has a positive risk-reward ratio. In a bearish scenario, ETH could bounce from EMA 200 ($3350) at the latest and still maintain a bullish trend. Anything below EMA 200 would have a bearish indication. If the current bullish trend persists, Ethereum eyes the $4000 psychological resistance.

ETH/USD "ETHEREUM" Crypto Market Heist Plan on Bullish SideHello!! My Dear Robbers / Money Makers & Losers, 🤑 💰
This is our master plan to Heist ETH/USD "ETHEREUM" Crypto Market Market based on Thief Trading style Technical Analysis.. kindly please follow the plan I have mentioned in the chart focus on Long entry. Our target is Red Zone that is High risk Dangerous level, market is overbought / Consolidation / Trend Reversal / Trap at the level Bearish Robbers / Traders gain the strength. Be safe and be careful and Be rich.
Entry 📈 : Can be taken Anywhere, What I suggest you to Place Buy Limit Orders in 15mins Timeframe Recent / Nearest Low Point take entry should be in pullback.
Stop Loss 🛑 : Recent Swing Low using 4H timeframe
Attention for Scalpers : Focus to scalp only on Long side, If you've got a lot of money you can get out right away otherwise you can join with a swing trade robbers and continue the heist plan, Use Trailing SL to protect our money 💰.
Warning : Fundamental Analysis news 📰 🗞️ comes against our robbery plan. our plan will be ruined smash the Stop Loss 🚫🚏. Don't Enter the market at the news update.
Loot and escape on the target 🎯 Swing Traders Plz Book the partial sum of money and wait for next breakout of dynamic level / Order block, Once it is cleared we can continue our heist plan to next new target.
💖Support our Robbery plan we can easily make money & take money 💰💵 Follow, Like & Share with your friends and Lovers. Make our Robbery Team Very Strong Join Ur hands with US. Loot Everything in this market everyday make money easily with Thief Trading Style.
Stay tuned with me and see you again with another Heist Plan..... 🫂

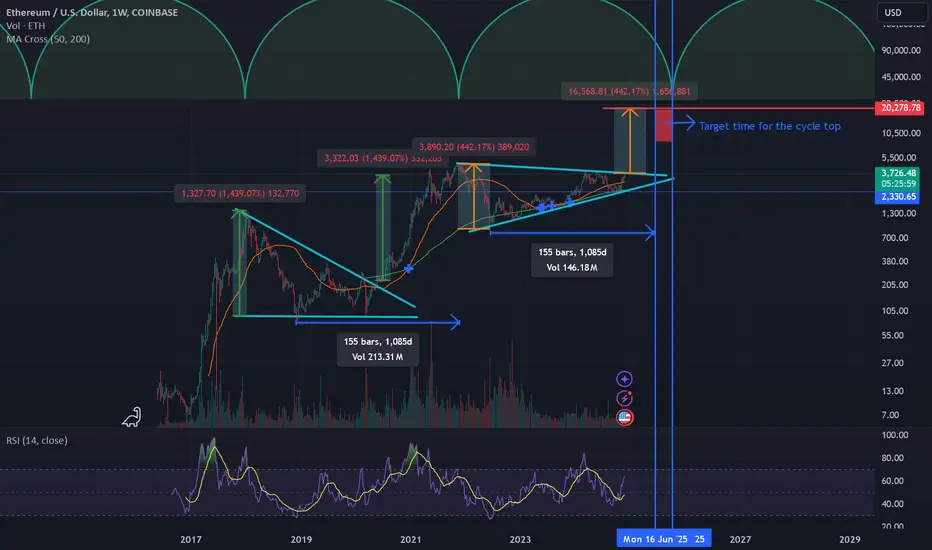
Ethereum potential move to 20,000Hi everyone,
Pattern: Ascending triangle is formed in weekly time frame for Ethereum (2022-2024). The triangle pattern was formed in the previous cycle (2018-2020).
Pattern breakout and target price: Once the price break out of the triangle pattern the target will be the triangle height, measured from break out point. This happened in the last cycle and the target price was reached. If happens in this cycle, we are looking at target price of 20K after the breakout.
Time analysis: If we are analyzing the time from cycle top to cycle top, we will be looking at end of Sep 2025 as the target time for the target price. If looking at cycle bottom to cycle bottom, the target will be mid June 2025. So, we can set our target time anywhere from June to Oct 2025 for this cycle top.
Let me know what you think! Cheers!
Why Is Ethereum Going Up? Technical and Fundamental Price AnalysEthereum, the second-largest cryptocurrency by market capitalization, has seen a significant surge in recent weeks, outperforming Bitcoin and other major cryptocurrencies. This article delves into the technical and fundamental factors driving Ethereum's upward momentum.
Technical Analysis: Bullish Signals
Ethereum's price chart is currently painting a bullish picture, with several technical indicators pointing to continued upward movement:
1. Rising Momentum: The Relative Strength Index (RSI) is above 50, indicating bullish momentum. A sustained increase in RSI suggests that buying pressure is outweighs selling pressure.
2. Breaking Resistance Levels: Ethereum has successfully broken through several key resistance levels, demonstrating strong buying interest from investors.
3. Bullish Candlestick Patterns: The formation of bullish candlestick patterns like the bullish engulfing pattern and the hammer pattern signals potential upward price movement.
4. Increasing Trading Volume: Higher trading volume often accompanies price increases, indicating increased market interest and participation.
Fundamental Analysis: Positive Catalysts
In addition to technical factors, several fundamental factors are contributing to Ethereum's price surge:
1. Network Upgrades and Scalability: Ethereum's ongoing network upgrades, such as the Shanghai upgrade, are aimed at improving scalability, reducing transaction fees, and enhancing the overall user experience. These upgrades can attract more developers and users to the Ethereum ecosystem, driving demand for ETH.
2. Growing DeFi Ecosystem: Ethereum remains the dominant platform for decentralized finance (DeFi) applications. The rapid growth of DeFi protocols and the increasing adoption of decentralized applications (dApps) on the Ethereum network can boost demand for ETH.
3. Institutional Adoption: Institutional investors and corporations are increasingly recognizing the potential of blockchain technology and cryptocurrencies. As more institutions allocate capital to Ethereum, it can further fuel price appreciation.
4. Positive Regulatory Sentiment: While regulatory uncertainty remains a concern for the cryptocurrency industry, positive regulatory developments can have a significant impact on market sentiment and price. For instance, the departure of SEC Chair Gary Gensler, who has been critical of the cryptocurrency industry, could lead to a more favorable regulatory environment for Ethereum.
5. Bitcoin's Relative Weakness: Bitcoin's recent price decline and lower volatility have shifted investor attention to Ethereum. As Ethereum's dominance in the derivatives market increases, it can attract more capital and drive price appreciation.
Conclusion
Ethereum's recent price surge can be attributed to a combination of technical and fundamental factors. The strong bullish signals on the technical charts, coupled with positive developments in the Ethereum ecosystem, indicate that the upward momentum may continue in the short to medium term. However, it's important to note that the cryptocurrency market is highly volatile, and prices can fluctuate rapidly. Investors should conduct thorough research and consider consulting with financial advisors before making investment decisions.
Disclaimer: This article is for informational purposes only and should not be construed as financial1 advice. Investing in cryptocurrencies2 involves significant risk, and it's essential to do your own research before making any investment decisions.

ETHUSDT.P | Where to Retrace ?I believe we will retrace there and come up. Let's what will next week show us.

Ethereum will continue in Jan/Feb 2025Fractal analysis similar to the ones I make for Bitcoin. Let's try this.

ETH/USD Daily Chart: Ready for a BreakoutEthereum’s price action on the daily timeframe is showing signs of a potential breakout. As indicated on the chart, I have added a second position to this trade. Unlike my typical strategy, I will not take partials on this trade—I plan to close one full position instead.
Technical Analysis:
• Retracement to Key Fibonacci Levels: On the weekly timeframe, Ethereum retraced to the 0.6 Fibonacci level, a strong support zone that has shown a significant bullish rejection. This deep retracement hints at potential strength, setting the stage for an upward move.
• Resistance Zone at $2.5K: If ETH manages to break and close decisively above the $2.5K mark, it could confirm a healthy bullish continuation, signaling a possible retest of the upper ranges around $2.8K-$2.9K. However, if the price stalls, we may be entering a range trading scenario, fluctuating between $2.1K and $2.9K. In this case, I’ll close both positions around $2.8K-$2.9K, depending on how price reacts to those levels.
• Trendline Break: The daily chart shows that ETH is attempting to break a descending trendline. A confirmed break above this trendline would add more weight to the bullish case and indicate that ETH is gaining momentum.
Risk Management:
• I’ve set the stop-loss slightly below key support zones, minimizing downside risk if the market turns. As always, managing risk is the key factor. Should the price dip below the critical areas of support, I will consider closing both positions to limit losses.
Fundamental Insights:
1. Monochrome’s Ethereum ETF Launch: Monochrome has launched the first Ethereum ETF (IETH) on Cboe Australia today, adding a significant bullish catalyst to Ethereum’s price action. With in-kind Ether redemption and subscriptions, this ETF offers better tax efficiency for institutional investors, potentially increasing demand for ETH.
2. Institutional Activity: There’s a notable accumulation of ETH by institutional players. A wallet linked to Longling Capital recently added another 5,000 ETH ($12.34M) to its balance, pushing its total holdings to 68,064 ETH ($168M). This kind of movement underscores strong confidence in Ethereum’s price trajectory. With institutional players coming back into the market after the liquidation event in 2022, we are seeing a resurgence of interest in Ethereum, especially as it holds above the $2.5K mark.
3. Ethereum Price Action: Ethereum is gaining momentum, climbing over 3% today and trading above $2,500, aligning well with the overall rally in the crypto market. This rally is also supported by Bitcoin’s strength, as it trades near $65,000, further bolstering the sentiment in the crypto space.
Market Sentiment & Conclusion:
Despite some slowdown in institutional demand for crypto ETFs in the U.S., Ethereum’s price action and the recent ETF launch in Australia add positive momentum to this setup. If Ethereum continues to hold above $2.5K and follows through with a breakout, the next target will be around $2.8K-$2.9K. If the breakout stalls and range trading ensues, I’ll close my positions accordingly.
ETH traders should keep an eye on price action around $2.5K. The key takeaway is that even in uncertain market conditions, sticking to a well-defined plan, like the one outlined here, helps ensure proper risk management while seizing potential opportunities.
Let’s continue to monitor how this plays out!
Note: Please remember to adjust this trade idea according to your individual trading conditions, including position size, broker-specific price variations, and any relevant external factors. Every trader’s situation is unique, so it’s crucial to tailor your approach to your own risk tolerance and market environment.

ETH through prism of Fib and Elliot wave theoryHello everyone.
Today I will talk about ETH, the one ALT to rule them all.
It is best if we look at the big picture and forget about day-to-day movements, news and all the other noise. Let us just look at the chart through basic Fibonacci levels paired with Elliot Wave Theory.
First lets go through Elliot waves.
Wave 1 started in 2017, first bull run.
Wave 2 was in 2018, bear market.
Wave 3 2019-2022, bull run.
Wave 4 was short bear market in first half of 2022.
We are currently in Wave 5.
I have added to this chart Trend-based Fib extensions to help predict the possible top.
Wave 3 ended just below 3.618 Fib extension. I like to be more on the conservative side so I will be looking for this run to end at max 2.618 Fib extension, which currently projects a price of 13k USD per ETH, making it a potential 4x profit.
Remember, this is not a financial advice. This is just my thinking, shared with you.
If you like my work, give it a boost and check my other ideas. If you find value in them, subscribe.
Good luck!

ETHEREUM (ETH) on the Rise! Key Targets Await on 1H ChartETHEREUM (ETH) Technical Analysis:
Ethereum (ETH) has confirmed a long entry at 2586.77 on the 1-hour timeframe, backed by bullish momentum and support from the Risological Dotted Trendline . The trade setup is promising, with well-defined targets positioned to capture potential gains as ETH continues its upward move.
Trade Summary:
Entry Level: 2586.77
Target Levels:
TP1: 2729.39
TP2: 2960.16
TP3: 3190.93
TP4: 3333.55
Stop Loss: 2471.39
With the entry level secured, Ethereum is primed to approach each target. Traders should monitor price action closely as ETH strives toward these lucrative levels.

Ethereum - Looking To Sell Pullbacks In The Short TermH1 - Bearish trend pattern
Currently it looks like a pullback is happening.
Until the two strong resistance zones hold I expect the price to move lower further after pullbacks.

ETHUSD 1HR TF LONG SETUP 2RRICMARKETS:ETHUSD looks good for a long setup, considering this is forming a perfect bullish pattern, is on a positive order block and the last 2 main dips have already occurred, TP should be around the strong high, close accordingly.

Will Ether Rebound After the August 7th Death Cross?Disclaimer: This article is intended for informational purposes only and should not be construed as financial advice. Cryptocurrencies are highly volatile assets, and investing in them carries significant risks.
On August 7th, 2023, Ethereum (ETH) experienced a death cross, a technical indicator where the 50-day Simple Moving Average (SMA) crosses below the 200-day SMA. Historically, this pattern has often signaled bearish trends, leading many investors to question the future trajectory of Ether.
Understanding the Death Cross
Before delving into the potential rebound, let's clarify what a death cross signifies. It is a technical analysis tool that suggests a potential downward price movement. However, it's essential to remember that it's not a definitive predictor of future price action. Market conditions, fundamental factors, and other technical indicators should be considered alongside the death cross.
Factors Influencing Ether's Recovery
Several factors could influence whether Ether can rebound from the August 7th death cross:
1. Market Sentiment: The overall cryptocurrency market sentiment plays a crucial role. If the broader market experiences a bullish trend, Ether might benefit from the positive momentum. Conversely, a prolonged bearish sentiment could hinder its recovery.
2. Regulatory Environment: Regulatory clarity and favorable policies can significantly impact cryptocurrency prices. Positive developments in the regulatory landscape could boost investor confidence and drive Ether's value upward.
3. Network Developments: Ethereum's network upgrades and advancements, such as the transition to proof-of-stake, can influence investor sentiment and demand for ETH. Positive developments in this area could support a price rebound.
4. Institutional Adoption: Growing institutional interest in Ethereum can provide price support and drive demand. Increased adoption by large financial institutions could contribute to a bullish trend.
5. Macroeconomic Factors: Global economic conditions, interest rates, and inflation can impact investor risk appetite and cryptocurrency prices. Favorable macroeconomic factors could create a positive environment for Ether's recovery.
Technical Analysis: Beyond the Death Cross
While the death cross is a notable technical indicator, it's essential to consider other technical analysis tools to assess Ether's potential rebound. These may include:
• Support and Resistance Levels: Identifying key support and resistance levels can help determine potential price targets for a rebound.
• Relative Strength Index (RSI): The RSI can indicate whether Ether is oversold, which could suggest a potential buying opportunity.
• Moving Average Convergence Divergence (MACD): The MACD can provide signals about changes in momentum, helping to identify potential trend reversals.
Cautious Optimism
It's important to approach any prediction about Ether's rebound with caution. The cryptocurrency market is highly volatile, and past performance is not indicative of future results. While a rebound is possible, it's equally likely that Ether could continue its downward trend or experience sideways consolidation.
Investors should conduct thorough research, consider their risk tolerance, and diversify their portfolios before making any investment decisions. Stay informed about market developments, technical analysis, and fundamental factors to make informed choices.
Ultimately, the success of a rebound depends on a combination of technical, fundamental, and market factors. While the death cross is a significant event, it's just one piece of the puzzle. By carefully analyzing various indicators and considering the broader market context, investors can make more informed decisions about their Ether holdings.

Ethereum Short Term Sell IdeaH4 - Strong bearish momentum
Lower lows
Currently it looks like a pullback is happening
Until the two strong resistance zones hold my short term view remains bearish here.

ETH target over 100001D time frame
-
TP: $7306 / $10,000
-
(1) $2100 is the best entry if fell again
(2) ETH is running Elliott Impulse Wave, and just completed the 1st and 2nd wave
(3) 3rd wave will come around 9/E, and reach its high in Jan ~ March 2025
(4) The low of 4th wave can be seen in April ~ June 2025
(5) The high of 5th wave can be seen in Oct ~ Nov 2025
(6) Keep being patient

Ethereum Value Slashes by 99%Though this episode of crypto winter is very soon due to be a thing of the past, just a regular seasons do, it will come around again! Considering the all-time structure of Ethereum's price chart, I believe the next crypto winter will be especially bad for Ethereum.
While many altcoins are due for very sizeable runs (100x - 500x and more) over the next couple of years, I think Ethereum will top out near the $6000 mark, giving it a 3.6X push from current price levels. Beyond this, there is great chance that the sloping formation begins to drastically slip. Despite completing 2 sizeable five-swing moves and a correction between the two, its unlikely that this equates to a truly impulsive formation being developed.
The tell-tale sign for me is the extreme shallow correction that we see in the boxed area. Some would classify this as Wave 2 but I'm more inclined to believe it to be a Wave B instead. While it is possible for Wave 2 to find support/terminate near the 0.38 fib level, it is quite rare and even when it does, generally it still makes a return to the previous sub-wave 4. In this case of Ethereum this has not manifested.
If not in an impulsive wave, as the price action suggests, there are 2 options as to how this could play out:
1 - it Luna bombs and eventually makes new all-time lows.
2 - it drops to 0.618 - 0.89 fib levels (compared to the size of Waves A and C combined) and finds support there before resuming upside.
With this in mind, support at/near $20 is the very best outlook for Ethereum's mid-term future. From $6K-$7K, this would equate to a massive 99% drop and this is a very perfect reason why its important to study and understand the science of price action. The last macro crypto pattern I've seen resemble this form was Luna. I thought it would find support at $1.50 but instead it dropped to $0.0000. My Luna prediction was shared well before the drop came. We will see in the years ahead if Ethereum follows suit or if bulls make a stand.
Until next time, stay safe and don't drown. Peace!

TECHNICAL ANALYISIS WITH TRADE PLAN ETH /USDT ON 1H TIMEFRAME BIAscending Channel:
The chart shows Ethereum moving within an ascending channel, which generally indicates a bullish trend. The price recently broke below the ascending channel, suggesting a potential correction.
Support and Resistance Levels:
Support levels are identified around 3,300 and 3,200 USDT.
Resistance levels are around 3,400 and 3,600 USDT.
Indicators:
VMC Cipher B Divergences: Mixed signals with some bearish and bullish divergences. The current state suggests a bearish divergence.
RSI (Relative Strength Index): Currently at 49.51, indicating a neutral position. No clear overbought or oversold condition.
Stochastic RSI: Shows an oversold condition with a value of 17.22, which might indicate a potential buying opportunity soon.
Trading Plan:
Intraday Trading:
Entry: Look for long positions if the price shows a strong support bounce around 3,300 USDT.
Exit: Target the first resistance level around 3,400 USDT.
Stop Loss: Place a stop loss slightly below the support level at 3,280 USDT.
Strategy: Monitor shorter time frames (e.g., 15-minute chart) for bullish candlestick patterns or momentum indicators turning positive before entering.
Scalping:
Entry: Enter long positions at support levels identified on the 5-minute chart, especially if there is a double bottom or strong reversal pattern.
Exit: Quick profits at minor resistance levels or key moving averages on the same chart.
Stop Loss: Tight stop loss just below the immediate support levels, such as 3,290 USDT.
Strategy: Use high-frequency trades to capitalize on small price movements, considering both support and resistance levels.
Swing Trading:
Entry: Consider entering long positions if the price bounces from 3,300 USDT support level, confirming a reversal.
Exit: Aim for the resistance level around 3,600 USDT.
Stop Loss: Place a stop loss around 3,200 USDT to protect against deeper corrections.
Strategy: Hold the position for a few days to a week, allowing the trade to develop. Use the daily chart to identify entry and exit points.
My advice:
Long Position: Favor long positions at current levels, given the oversold conditions on the Stochastic RSI and the presence of support around 3,300 USDT. Watch for a confirmed reversal signal before entering.
Short Position: Consider short positions if the price fails to hold the 3,300 USDT level and breaks lower, aiming for the next support at 3,200 USDT.
Risk Management: Always use stop losses to manage risk and protect capital. Adjust stop loss levels according to the volatility and trade timeframe.
Overall, the current technical setup suggests a cautious long bias, waiting for confirmation of support holding and potential reversal signals before entering trades.

Ethereum(ETH) Analysis===>>15 minute time frameEthereum(ETH) has succeeded in breaking the lower line of the Symmetrical Triangle .
According to the theory of Elliott waves , Ethereum(ETH) seems to be completing corrective wave s.
I expect Ethereum(ETH) to fall at least to the Potential Reversal Zone(PRZ) .
Note: An important point you should always remember is capital management and lack of greed.
Ethereum Analyze (ETHUSDT), 15-minute time frame ⏰.
Do not forget to put Stop loss for your positions (For every position you want to open).
Please follow your strategy; this is just my Idea, and I will gladly see your ideas in this post.
Please do not forget the ✅' like '✅ button 🙏😊 & Share it with your friends; thanks, and Trade safe.

ETHEREUM - NEW BREAKOUT 🚀Hello Traders !
After a Huge Bullish Move, The ETH Broke a Strong Resistance Level (3729.16 - 3646.38).
This Key Level Becomes a New Support Level !
So, I Predict a Bullish Move📈
---------------
TARGET: 4002.00🎯

Brief ETH Analysis | Bearish Trend? Key S & R Levels 1D TFThe 1D TF chart for Ethereum shows a consolidation period following a significant uptrend. Key events include the publication of the U.S. Consumer Price Index (CPI) on May 12 and circulating news about the upcoming approval of the Ethereum spot ETF, which caused heightened market activity. On May 20, Ethereum's price surged by 21% in a single day, a significant movement compared to the typical 9 - 11% increases. This sharp rise was driven by speculative news and positive sentiment surrounding the potential ETF approval and favorable CPI data.
After this spike, the price entered a range, characterized by increased trading volumes but low volatility candles, indicating market indecision. Recently, an "Inside Bar" pattern has formed: the middle candlestick is a small bearish candle enclosed within the previous large bullish candle, with a potential bullish candle forming today. This pattern highlights market indecision and suggests a potential breakout in either direction.
Currently, Ethereum is testing a critical resistance level around $4K. A breakout above this level, accompanied by increased volume, could signal further upward movement. Conversely, failure to break this level might lead to a pullback towards the support zones.
The current chart analysis shows that ETH is approaching a significant resistance level around $4K, marked by a descending trend line. This resistance has been tested several times, underscoring its importance.
The volume profile indicates consolidation between key support and resistance levels:
◼️ Resistance Levels: Around $3.9K and $4.1K.
◼️ Local Support Levels: Around $3.7K and $3.5K.
◼️ Bullish Scenario: A breakout above $3.9K, accompanied by increasing trading volumes, could signal the continuation of the bullish trend towards the next resistance level around $4.1K.
◼️ Bearish Scenario: If the price fails to break through the resistance and falls below the $3.5K support level, it could indicate a potential bearish reversal or an extended consolidation phase.
Monitoring trading volumes and price movements around these key levels will be critical in predicting the next significant move.
Disclaimer: Content for seasoned traders only. Not financial advice. You bear sole responsibility for trading outcomes. ➖ DYOR 🧠 💡
