Ethereum: On the green ⛳️Ethereum is on the green or rather in the green zone between $1754 and $1457, still hesitating to advance further. Technically, the requirements for completing the current movement are thus fulfilled. However, we expect the cryptocurrency to ideally hole wave 2 in green around the middle of the green zone. This done, Ethereum should turn upwards, aiming for the resistance at $2138, which should be conquered in due time.
Ethereumanalysis

ETH not dead yetLooking for a bullish count here on ethereum as we seem to be looking to continue higher.
The down move off the 2140$ high seems to be a corrective move as it is a three wave move, therefore not trend establishing.
Looking for further upside as we could moving sideways in a triangle in wave (iv).
Questions are more than welcome, trade safe!
Feel free to check out my other post here on Tradingview!

💎 Ethereum (ETH) is on the rise! 💎 The price surged by an impressive move on May 28 surpassing a key resistance level and consolidating around $1,894 since then.
💎 This consolidation phase provides an excellent opportunity for Paradisers to consider accumulating ETH, especially if there is a pullback towards the stable support level at $1,853.
💎 The bullish thesis for Ethereum price would be invalidated if it breaks down below the $1,829 support level.
💎 As Ethereum continues its journey, it's essential to closely monitor these key levels and market dynamics Stay tuned and make your moves wisely! 💪💎

Ethereum highest price in this bear4h time frame
-
We see a potential harmonic structure(shark pattern) on 4h time frame.
The potential reversed point is around 2195
Plus, if measre the price pumped range from the wedge structure, we can also have the same price around 2195
We might see Ethereum reach 2195 soon, and do not be FOMO there.
Stay prepared to open short!

Ethereum - my trading plan revealed!Hello, everyone!
In my opinion Ethereum is showing much more interesting potential setups than BTC. Today I am going to show you my trading plan for $BINANCE:ETHUSDT. As you already know from my previous analysis I expect huge dump on Bitcoin and entire cryptomarket in the upcoming days.
Looking at the price chart I can conclude that ETH has finished it's corrective wave represented as a zigzag ABC. Now it's printing the impulsive wave 3. Wave 1 inside this wave has been already finished. I assumed this because we can see the reversal bullish squat bar at the very bottom. Now I am waiting for this bullish bar confirmation to open long trade with the target at 0.61 Fibonacci retracement, approximately at $1940. This trade is risky because it's trading on corretive waves, but I will take it.
From $1940 I expect the impulsive wave 3 which can reach even $1654. I am also going to catch this move.
Best regards, Ivan
__________________________________
Follow me and never miss an update👍

Ethereum critical support 18352h time frame
-
Ethereum creating a rising channel, the next critical support is around 1835
We can set a good trade there, and target is 2030

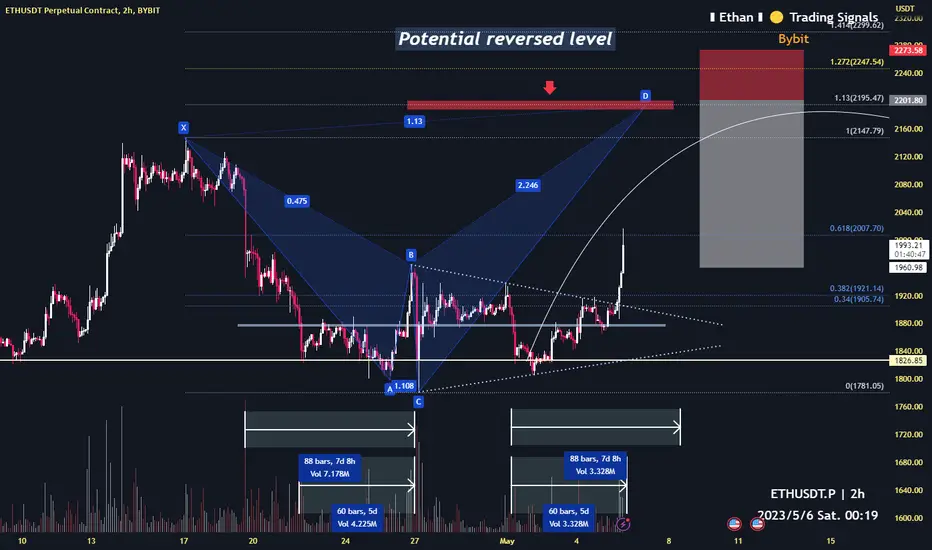
Ethereum as we predicted (pump this week)Potential reversed level as analysis on chart
Stay prepared
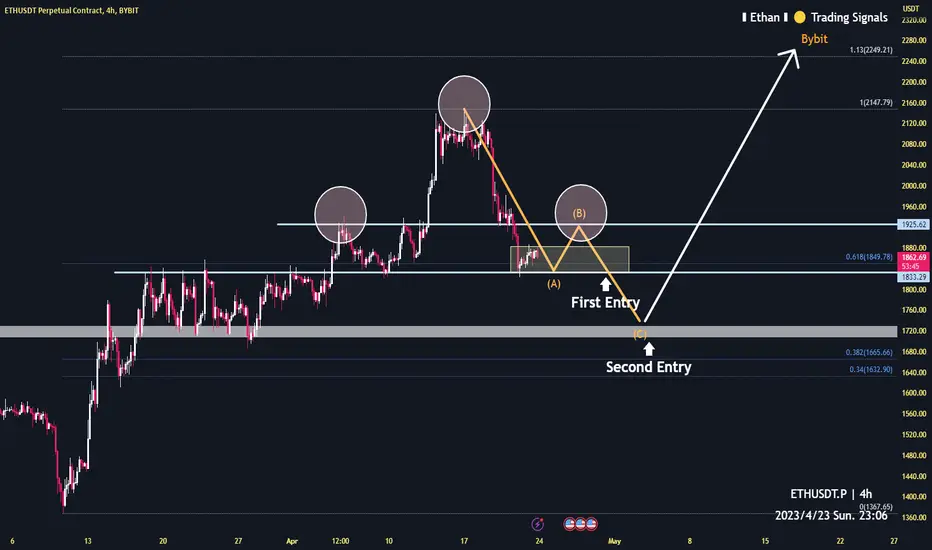
ETH is preparing for a BIG BOUNCE!!!Technical Analysis:
- In weekly, ETH is doing wave ((1)) in black
- In short term, ETH is doing wave 2 in red
- H1 right side is turning down
- H4 right side is up
Technical Information:
- If you're a Swing Trader, you can buy wave 2 in red around 1,670
- If you're a Position Trader, you must wait for wave ((2)) in black around 2,000

Ethereum potential reversed price is 22002h time frame
-
Refer to the previous structure from Mar 27 to April 17
We can easily predict the next trend of ETH
Still have the potential to create harmonic pattern in near future.
With this analysis, timing to open short will be around 2200
Get ready for it!

Ethereum Best Short timing2h time frame
-
Ethereum still creating a potential harmonic pattern as previous analysis
We might go to 2190 soon, and there will be a potential reversed price as marked.

#Ethereum Uptrend Remains but Price Must Break Above $1,950Past Performance of Ethereum
Ethereum prices, like BTC, are firm at spot rates. Notably, there is a sharp reversion from critical reaction levels, marking resistance levels of March 2023 and September 2022. For now, whether ETH buyers will build on yesterday's gains remains to be seen. However, any attempt to unwind losses will be massively bullish for ETH, that's overly in an uptrend formation.
#Ethereum Technical Analysis
ETH remains bullish, up 36% from March lows and 72% from December 2022 lows. Despite the contraction from April peaks, the uptrend remains and will be confirmed if ETH floats above $2.1k in the days ahead. Ideally, a break above the high of the anchor bear bar of April 21 at HKEX:1 ,950 is critical. This will cancel out bears that are currently in control from an effort-versus-result perspective. On the other hand, traders can wait for a deep below HKEX:1 ,800. In that case, ETH may drop to HKEX:1 ,700 in continuation of April 19 and 21 bear bars.
What to Expect from #ETH?
Technically, ETH buyers have the upper hand. All the same, the coin is trading at below critical reaction levels, especially $2k. The middle BB, or the 20-day moving average, is also an important resistance level. Losses below HKEX:1 ,800 in the near term may trigger more losses in the days ahead.
Resistance level to watch out for: HKEX:1 ,950
Support level to watch out for: HKEX:1 ,800
Disclaimer: Opinions expressed are not investment advice. Do your research.

Ethereum will pump over 2100 in near future!4h time frame
-
Ethereum initially stop falling here and start consolidating.
We need another rejection from 1930 to clear leveraged positions.
At that time, a potential inverse head and shoulders will create, which target is around 1730.
Further, a huge pump may move on 5/B.
So, there are two entries to long, 1830 and 1730.
Get ready for it!
Ethereum Long Term AnalysisSince we are coming to the end of February in 4 days, I felt the need to do this analysis. I think the critical level for Ethereum in the monthly timeframe is $1828. This is because the moving average is at that level. I think that Ethereum, which has always followed this moving average in history, will follow this moving average again this time. The monthly close of Ethereum above this level may also mean the beginning of the bull market. For this reason, it seems that for those who have not bought Ethereum yet or for investors who want to lower their risks as much as they can, following this level and buying when a monthly closing is made will minimize the risks.
A second scenario will occur if Ethereum is rejected at this level. If Ethereum is rejected from this level, the support levels of the Fibonacci retracement will be seen. The target for the bear scenario will be $771 if there is no return from $1177 first and then $771.
I don't think there will be more of a bear scenario for cryptos in this situation. I would also like to say that when the moving average is broken, I will personally add to the Ethereums in my pocket.

#Ethereum - thoughts out loud #10Good evening , we are from Ukraine!
For this period of time, the chart has a trading margin, the exit from which opens the door to 2 key levels:
1) A long scenario of breaking through the resistance level and going to 2300 and above.
2) Short, market weakness after a false breakout of 2200 and the price returning to the middle of the range with a further buyer's test at 1900 - 1850.
Thank you all for your attention, I wish you success.
Sometimes you win /sometimes you learn.

📈ETH analysis above 1900 level📉BINANCE:ETHUSDT
COINBASE:ETHUSD
Hey everyone, first take a look at my previous analysis and positions.
As previously analyzed, Ethereum continued its upward trend and reached above the HKEX:1903 level.
In order to continue the upward trend, Ethereum needs to stay above 1850.
Don't forget to risk-free your position.
Consider the impact of the Shanghai update.
Please share ideas and leave a comment,
let me know what's your idea.
CrazyS✌

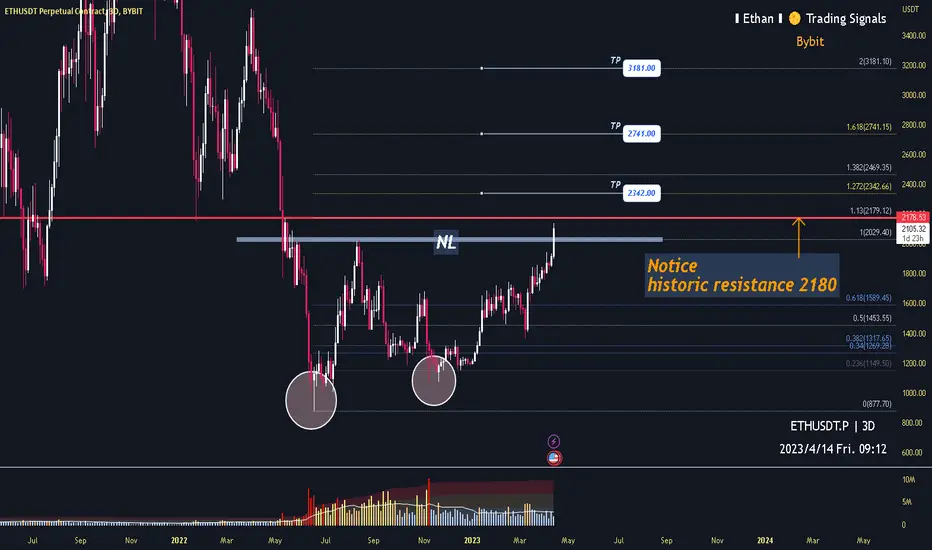
Ethereum creating a huge double bottom!BYBIT:ETHUSDT.P
3 day time frame
-
Ethereum creates this big potential double bottom after breaking above 2030
We can plan a long trading and targets as marked.
***Notice also approaching to historic resistance 2180.
SHORT PLAN for Ethereum upcoming upgradeBYBIT:ETHUSDT.P
4h time frame
-
Ethereum's Shanghai upgrade is imminent.
Also, we can notice there is a potential double top structure forming.
Try to short it if break down that uptrend line.

#Ethereum Firm, ETH Buyers Angling For $2,000Past Performance of Ethereum
Ethereum buyers are confident, reading from the performance in the daily chart. There are encouraging higher highs as ETH claws higher, presently trading at the Q3 2022 trade range. Even though there was a cool-off, ETH will likely bounce higher ahead of the Shanghai upgrade.
#Ethereum Technical Analysis
The path of least resistance is northwards. Notice that prices are above February 2023 highs of HKEX:1 ,750, and the retest in March didn't force prices lower. The rebound in late March propelled prices to spot rates, a huge positive for optimistic buyers. Per the current ETH candlestick arrangement, every low above April 4 bull bar at HKEX:1 ,800 may offer entries with targets at HKEX:1 ,950 and later HKEX:2 ,000. This preview will only change should there be a sharp dump, with rising volumes, below the middle BB and HKEX:1 ,800 in the next few days.
What to Expect from #ETH?
As it is, traders are confident of what lies ahead. The psychological reaction point at HKEX:2 ,000 remains unchallenged, but that could change if the upcoming fundamental event draws buyers.
Resistance level to watch out for: HKEX:1 ,950
Support level to watch out for: HKEX:1 ,800
Disclaimer: Opinions expressed are not investment advice. Do your research.

Ethereum Start Next MoveHi dear
Etherium reached good demand area and as show in picture from orange area start moving to final target 3113 but during this upward path will shown those up and retracements
i hope best rewards for you
thanks support me by reading my posts and share

Ethereum - Buy The Rumor, Sell The News? 😳What’s up traders. In today’s trading idea, we discuss our thoughts on Ethereum.
Taking a look at the Daily chart, we’ve mapped out a few key levels & zones.
The story for Ethereum will be similar to our previous post on Bitcoin, in terms of where we think the 2nd largest crypto is headed.
If you haven’t heard, the Ethereum network is about to undergo the highly anticipated Shanghai upgrade on April 12th.
Simply put, this upgrade will allow investors (validators of the network) to withdraw their ETH that has been staked since December of 2020 (massive unrealized gains sheesh).
Right now, staked ETH accounts for 1/7th of the entire supply, 16 million tokens valued at over HKEX:26 billion.
Will a massive price dump follow?
Without diving too deep into the technicalities of the Shanghai fork, a subsequent dump could likely be in the cards.
Scenario 1: Bull Case
We see a continued push from Bitcoin, driving Ethereum up. We’re currently in an ascending triangle / bull flag, so a breakout to previous highs wouldn’t be surprising. HKEX:2 ,000 ETH definitely in the cards (Round number pseudoscience).
If we can surpass the 2K barrier, consolidate above combined with a bullish Bitcoin. Taking longs right now don’t sound too shabby.
Scenario 2: Bear Case
The bearish scenario would entail a “Buy The Rumor, Sell The News” situation. Where this push we’ve witnessed in recent days/weeks is due to the hype surrounding the Shanghai Upgrade.
A dip back down the 1400-1500 levels might be a solid spot if you want to look at getting long. If we see a severe dip from Bitcoin, and end up retouching the 1000-1200 levels. We’d be looking to buy & hold as those prices would be quite appetizing.
As always, NONE of this is financial advice. Trade, and invest at your own risk. This is for educational and entertainment purposes only, and we are in no way shape or form financial advisors.
Eyes peeled out there team. See ya in the next one.

Painting Ethereum- Sometimes the lines we see are unclear and difficult to understand.
- Trading is some kind of art where u are trying to paint the future.
- No one is born a great trader, one learns by trading.
Happy Tr4Ding !

Ethereum to 2k usdEthereum finally broke its resistance of 1830 usd. This is a welcome break after a 17 days sideways period.
Right now we're at day 25 out of the on average 65 days cycle of Bitcoin. I'm using Bitcoin as a reference as Ethereum is highly correlated to that asset. Meaning we still have a max of 2-3 weeks of upside potential, as I expect us to have peak at the right side of the halfway point of the daily cycle.
I believe this move will bring Ethereum at least to 2k usd as that is where the next resistance resides.

Ethereum's Potential for Correction in AprilHello friends!
I hope you had a profitable trading week so far.
This time, I will analyze a potential correction for Ethereum. Same for Bitcoin, I think ETH is due for a correction.
I see a potential reversal cooking. In bigger time frame (daily or weekly) it will only look like a correction. But in intraday timeframe, it might be a reversal signs and/or good short setup potential.
We can see that there was a bearish divergence in RSI formed. See the dashed white arrow. This indicates that bulls are weakening. These indicates that bears are ready to take action.
However, we need a second confirmation.
My analysis will be proven if the yellow bold line is broken. This will indicate that the price has formed a lower-low structure, which marks the start of a downtrend (at least in intraday timeframe)
Next Question: HOW LOW CAN ETH GO?
If you see at the daily timeframe , Ethereum forming a potential bullish megaphone.
If ETH is to go down, I think it might go to the lower part of the pattern (see white trendline)
But a possible reaction at the support in around 1511 USD is also possible
Should we see a bullish signal in those area, we can start buying/long up to 2000 or maybe 2100 USD.
Hope you like my analysis and don't forget to share your thoughts as well
