Ethereum coming back strong? Ethereum
Intraday - We look to Buy a break of 2481 (stop at 2414)
Short term momentum is bullish. A break of the recent high at 2480 should result in a further move higher. We are trading at oversold extremes.
Our profit targets will be 2648 and 2698
Resistance: 2480 / 2580 / 2700
Support: 2400 / 2300 / 2200
Disclaimer – Saxo Bank Group. Please be reminded – you alone are responsible for your trading – both gains and losses. There is a very high degree of risk involved in trading. The technical analysis, like any and all indicators, strategies, columns, articles and other features accessible on/though this site (including those from Signal Centre) are for informational purposes only and should not be construed as investment advice by you. Such technical analysis are believed to be obtained from sources believed to be reliable, but not warrant their respective completeness or accuracy, or warrant any results from the use of the information. Your use of the technical analysis, as would also your use of any and all mentioned indicators, strategies, columns, articles and all other features, is entirely at your own risk and it is your sole responsibility to evaluate the accuracy, completeness and usefulness (including suitability) of the information. You should assess the risk of any trade with your financial adviser and make your own independent decision(s) regarding any tradable products which may be the subject matter of the technical analysis or any of the said indicators, strategies, columns, articles and all other features.
Please also be reminded that if despite the above, any of the said technical analysis (or any of the said indicators, strategies, columns, articles and other features accessible on/through this site) is found to be advisory or a recommendation; and not merely informational in nature, the same is in any event provided with the intention of being for general circulation and availability only. As such it is not intended to and does not form part of any offer or recommendation directed at you specifically, or have any regard to the investment objectives, financial situation or needs of yourself or any other specific person. Before committing to a trade or investment therefore, please seek advice from a financial or other professional adviser regarding the suitability of the product for you and (where available) read the relevant product offer/description documents, including the risk disclosures. If you do not wish to seek such financial advice, please still exercise your mind and consider carefully whether the product is suitable for you because you alone remain responsible for your trading – both gains and losses.
Ethereumclassic

#ETH/USDT 2HOUR UPDATE BY CRYPTOSANDERS !!Hello, welcome to this ETH/USDT 2Hr chart update.
I have tried my best to bring the best possible outcome to this chart.
Show some support do hit the like button, follow and comment in the comment section. this motivates me to bring this kind of chart analysis on regular basis.
CHART ANALYSIS:-
ETH/USDT support is $2512,$2455,$2366.
and resistance is $2621.
Do hit the like button if you like it and share your charts in the comments section.
thank you.

ETHEREUM LONGS ACTIVE 📉📉📉In this moment i don't see lower price action on ETH as stock market is very bullish into the FED Meeting, we have extreme fear both on crypto and stock market meaning the traders/investors are panic selling their asset and this could be a good buying opportunity, i think we will see the selloff movement on BTC after the Fed Meeting (2days) around 3200$ level, this chart is preety much the same as BTC.
Another target area for me is around buy side liquidity aka equal highs area where we could take some profits (weekly highs)
What do you think ? Comment below..

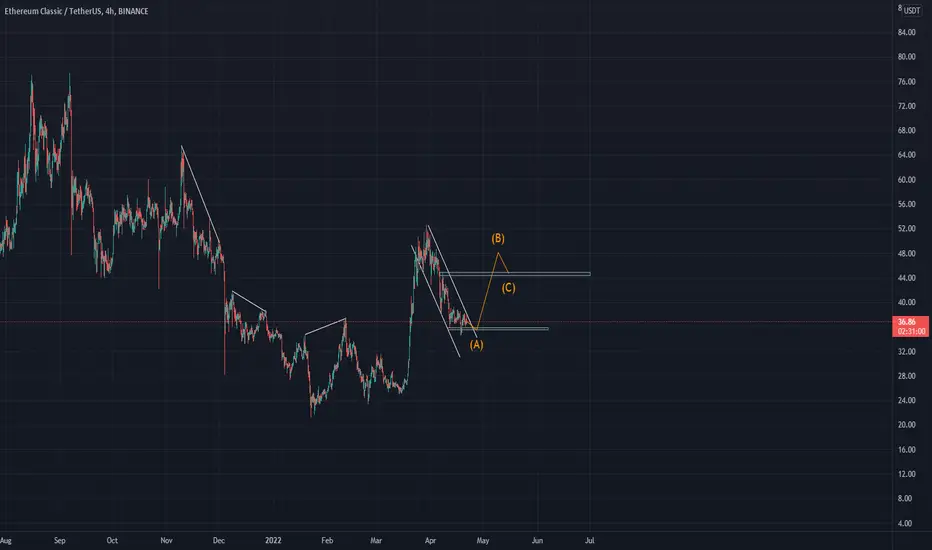
Ethereum Classic | ETC Falling Wedge Indicating Potential For GrEthereum Classic ETC is looking really good on the daily timeframe.
Let's focus on the obvious: We have the classic falling wedge pattern, which eventually will be broken. Now I like the spot ETC is currently in. We have these two supporting trendlines, at which we could see some volume flowing back into ETC.
I'm short-term bearish as I expect ETC to dip below $30 and in a worst case scenario find support around $25-27.5.
Once the price breaks through the upside of the falling wedge, we can position ourselves to take a long trade towards > $40.
Let's see how this plays out.
Thanks for your support.
Have a good one.

Ethereum Classic (ETC) - April 28hello?
Traders, welcome.
By "following", you can always get new information quickly.
Please also click "Like".
Have a nice day.
-------------------------------------
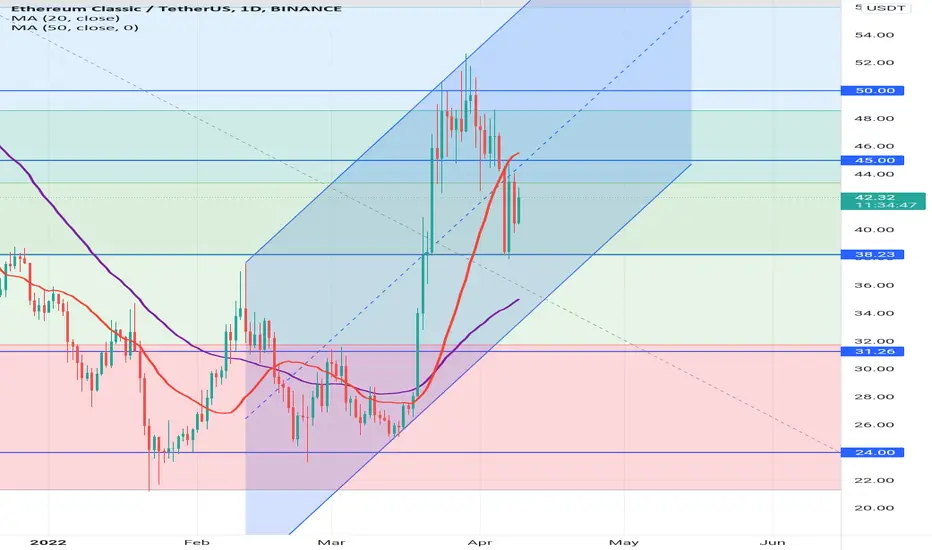
(ETCUSDT 1D Chart)
Resistance: 36.26-47.10
As it fell below 36.26, it is showing a movement to enter the mid- to long-term investment area.
We need to see if we can find support in the 26.52-29.66 zone and move higher than 36.26.
The resistance section of 36.26-47.10 is the section that determines the trend.
Therefore, it is important to have support in the 36.26-47.10 section.
However, if there is movement within the uptrend channel formed by the mid- to long-term uptrend line, it is likely to move up.
It is recommended to proceed after confirming support at 36.26 or higher at the point where buying is possible.
------------------------------------------------------------ -----------------------------------------------------
** All indicators are lagging indicators.
Therefore, it is important to be aware that the indicator will move accordingly as price and volume move.
However, for the sake of convenience, we are talking in reverse for the interpretation of the indicator.
** The MRHAB-T indicator used in the chart is an indicator of our channel that has not been released yet.
** The OBV indicator was re-created by applying a formula to the DepthHouse Trading indicator, an indicator disclosed by oh92. (Thanks for this.)
** Support or resistance is based on the closing price of the 1D chart.
** All descriptions are for reference only and do not guarantee a profit or loss in investment.
(Short-term Stop Loss can be said to be a point where profit and loss can be preserved or additional entry can be made through split trading. It is a short-term investment perspective.)
---------------------------------

Ethereum: lower levels to come? Ethereum
Intraday
We look to Sell a break of 2789 (stop at 2841)
Daily signals are bearish. A break of bespoke support at 2800, and the move lower is already underway. There is no clear indication that the downward move is coming to an end.
Our profit targets will be 2646 and 2606
Resistance: 2900 / 2980 / 3040
Support: 2880 / 2800 / 2700
Disclaimer – Saxo Bank Group. Please be reminded – you alone are responsible for your trading – both gains and losses. There is a very high degree of risk involved in trading. The technical analysis, like any and all indicators, strategies, columns, articles and other features accessible on/though this site (including those from Signal Centre) are for informational purposes only and should not be construed as investment advice by you. Such technical analysis are believed to be obtained from sources believed to be reliable, but not warrant their respective completeness or accuracy, or warrant any results from the use of the information. Your use of the technical analysis, as would also your use of any and all mentioned indicators, strategies, columns, articles and all other features, is entirely at your own risk and it is your sole responsibility to evaluate the accuracy, completeness and usefulness (including suitability) of the information. You should assess the risk of any trade with your financial adviser and make your own independent decision(s) regarding any tradable products which may be the subject matter of the technical analysis or any of the said indicators, strategies, columns, articles and all other features.
Please also be reminded that if despite the above, any of the said technical analysis (or any of the said indicators, strategies, columns, articles and other features accessible on/through this site) is found to be advisory or a recommendation; and not merely informational in nature, the same is in any event provided with the intention of being for general circulation and availability only. As such it is not intended to and does not form part of any offer or recommendation directed at you specifically, or have any regard to the investment objectives, financial situation or needs of yourself or any other specific person. Before committing to a trade or investment therefore, please seek advice from a financial or other professional adviser regarding the suitability of the product for you and (where available) read the relevant product offer/description documents, including the risk disclosures. If you do not wish to seek such financial advice, please still exercise your mind and consider carefully whether the product is suitable for you because you alone remain responsible for your trading – both gains and losses.

ETHEREUM LONGS 📉📉📉Expecting bullish price action on ETH as BTC should rise and move the market into bullish zones. We have a manipulaiton below the sell side liquidity on ETH + a rsi divergence on the H4 that signs a potential bullish reversal. Targets are into buy side liquidity area + bearish imbalance area 3253
FEAR/GREED Index on the CRYPTO MARKET says that we are in EXTREME FEAR meaning there is a good buying opportunity.
What do you think ? Comment below..

Ethereum to drop further? Ethereum
Intraday - We look to Sell a break of 2794 (stop at 2844)
Daily signals are bearish. A break of the recent low at 2798 should result in a further move lower. Prices are extending lower from the bearish flag/pennant formation. There is no clear indication that the downward move is coming to an end.
Our profit targets will be 2664 and 2614
Resistance: 2880 / 2950 / 3000
Support: 2800 / 2700 / 2600
Disclaimer – Saxo Bank Group. Please be reminded – you alone are responsible for your trading – both gains and losses. There is a very high degree of risk involved in trading. The technical analysis, like any and all indicators, strategies, columns, articles and other features accessible on/though this site (including those from Signal Centre) are for informational purposes only and should not be construed as investment advice by you. Such technical analysis are believed to be obtained from sources believed to be reliable, but not warrant their respective completeness or accuracy, or warrant any results from the use of the information. Your use of the technical analysis, as would also your use of any and all mentioned indicators, strategies, columns, articles and all other features, is entirely at your own risk and it is your sole responsibility to evaluate the accuracy, completeness and usefulness (including suitability) of the information. You should assess the risk of any trade with your financial adviser and make your own independent decision(s) regarding any tradable products which may be the subject matter of the technical analysis or any of the said indicators, strategies, columns, articles and all other features.
Please also be reminded that if despite the above, any of the said technical analysis (or any of the said indicators, strategies, columns, articles and other features accessible on/through this site) is found to be advisory or a recommendation; and not merely informational in nature, the same is in any event provided with the intention of being for general circulation and availability only. As such it is not intended to and does not form part of any offer or recommendation directed at you specifically, or have any regard to the investment objectives, financial situation or needs of yourself or any other specific person. Before committing to a trade or investment therefore, please seek advice from a financial or other professional adviser regarding the suitability of the product for you and (where available) read the relevant product offer/description documents, including the risk disclosures. If you do not wish to seek such financial advice, please still exercise your mind and consider carefully whether the product is suitable for you because you alone remain responsible for your trading – both gains and losses.

ETC/USDT : Moving into a falling wedge BINANCE:ETCUSDT
Hello everyone 😃
Before we start to discuss, I'll be so glad if you share your opinion on this post's comment section and hit the like button if you enjoyed it !
$ETC's moving into falling wedge and now it's getting supported by the local bullish order-block at $36.
The main movement's prediction is bullish; But as $BTC is getting the weekly close below $42000, It's better to have the possibilities for both side...
- Bullish Case; If we get the break-out above falling wedge, I'll locate my Long on a proper retest of higher order-block at $39, Then aim for $40.90 - $44.90 - $49.90
- Bearish Case; If we get the rejection below falling wedge, I'll locate my Short on a proper retest of mentioned order-block at $36, Then aim for $31's S/R zone/line.
Hope you enjoyed the content I created, You can support us with your likes and comments !
Attention: this isn't financial advice we are just trying to help people on their own vision.
Have a good day!
@Helical_Trades

ETHEREUM LONGS ACTIVE 📉📉📉📉Expecting bullish price action on ETHEREUM as we are in a bullish market structure. Targets into 3.300$
What do you think ? Comment below..

Ethereum to Stall Soon? Ethereum
Intraday - We look to Sell at 3297 (stop at 3351)
Daily signals are mildly bearish. We look for a temporary move higher. 3308 has been pivotal. Early optimism is likely to lead to gains although extended attempts higher are expected to fail.
Our profit targets will be 3163 and 3113
Resistance: 3200 / 3250 / 3300
Support: 3100 / 3080 / 3000
Disclaimer – Saxo Bank Group. Please be reminded – you alone are responsible for your trading – both gains and losses. There is a very high degree of risk involved in trading. The technical analysis, like any and all indicators, strategies, columns, articles and other features accessible on/though this site (including those from Signal Centre) are for informational purposes only and should not be construed as investment advice by you. Such technical analysis are believed to be obtained from sources believed to be reliable, but not warrant their respective completeness or accuracy, or warrant any results from the use of the information. Your use of the technical analysis, as would also your use of any and all mentioned indicators, strategies, columns, articles and all other features, is entirely at your own risk and it is your sole responsibility to evaluate the accuracy, completeness and usefulness (including suitability) of the information. You should assess the risk of any trade with your financial adviser and make your own independent decision(s) regarding any tradable products which may be the subject matter of the technical analysis or any of the said indicators, strategies, columns, articles and all other features.
Please also be reminded that if despite the above, any of the said technical analysis (or any of the said indicators, strategies, columns, articles and other features accessible on/through this site) is found to be advisory or a recommendation; and not merely informational in nature, the same is in any event provided with the intention of being for general circulation and availability only. As such it is not intended to and does not form part of any offer or recommendation directed at you specifically, or have any regard to the investment objectives, financial situation or needs of yourself or any other specific person. Before committing to a trade or investment therefore, please seek advice from a financial or other professional adviser regarding the suitability of the product for you and (where available) read the relevant product offer/description documents, including the risk disclosures. If you do not wish to seek such financial advice, please still exercise your mind and consider carefully whether the product is suitable for you because you alone remain responsible for your trading – both gains and losses.

ETHEREUM LONGS ACTIVE 📉📉📉Expecting bullish price action on ETH after price takes out the sell side liquidity below the old lows, almost the same move as we seen on the BTC. We also have an rsi bullish divergence suggesting a bullish reversal, we have a lot of bearish imbalances that are opened and price should quickly rise to FILL THEM.
What do you think ? Comment below..

Dont miss the next ETC BULLRUN !!ETC is completing the correction of the uptrend and pullback on the broken channel. It is likely that the uptrend will continue in good market conditions. By observing good entry points in lower time frames, you can have a good entry. Do not forget risk and money management because it is more important than any analysis!
Good luck !
#ETC
#Daily

ETC, could be a gold mine, might fail miserablySome major bullish factors for ETC:
1) Mystique hard-fork solving the double-spend issue and strengthening the chain back in February
2) The "fifthening" in 2 days (April 15th), block reward cut by 20%
3) ETH live testing (ghost network) PoS chain right now, target date for complete implementation June, miners likely switch to ETC en masse.
4) on ETC:BTC pair it's well above all daily MA's
5) Using 50D MA as support
Bearish:
1) Held under 200D MA
2) Market barely holding support, with ample bearish sentiment across the board
3) Lots of resistance above between here and $54
If the market pumps ETC could go bigger than we've seen a token go in a while, but anything but a strong bull market and this token has so much resistance above it there's no way it'll break out.

ETHEREUM CLASSIC: SOON READY FOR A 100% MOVE!!Hello everyone, if you like the idea, do not forget to support with a like and follow.
Welcome to this ETC/USDT TRADE setup. ETC looks good here.
Ethereum classic is moving inside a bull flag kind of pattern where the breakout is still pending. But looks like it's breaking out soon. After the breakout, I'm expecting a 100% pump in ETC. So buy some now and add more in dips.
Entry range:- $36.5-$37.5
Target1:- $44
Target2:- $51
Target3:- $62
Target4:- $74
SL:- $33
If you like this idea then do support it with like and follow.
Also, share your views in the comment section.
Thank You!

ETC IS PRESENTLY AT FIB50. ETC at $43 and happen to be FIB50. This is an important level. If we breakout from this resistance, we should expect a rally to $50 zone.
What do we expect to happen next?

Analysis: ETC(Ethereum Classic) is at an Interesting Point Ethereum Classic performed a 2x move last month. After a while of a downtrend, ETC is now consolidating. What makes this coin "at an interesting point"? Let's look at the 4H chart and see what we have.
1. Recent RSI Bullish Divergence,
2. 0.618 Fib support
3. consolidation between 0.618 and 0.5 Fib
4. Falling wedge pattern(usually bullish)
While there are bullish signs, there are bearish signs, which are
1. 0.5 Fib resistance
2. Upper channel resistance
3. Price below 4h EMA 100
4. RSI 50.0 Resistance
Forecast
Price can either go to $30(0.786 Fib support) or beyond $50. It may go down if the falling wedge and 0.618 Fib breaks to the downside. It may go up once the upper channel, EMA100, and 0.5 Fib breaks to the upside. Will update this post as time passes.
As an extra here are things to watch out for
1. Upper Channel breakout
2. RSI crossing 50(or 70 for a strong move). 50 is an RSI resistance
3. 4h EMA100 breakout
4. Bitcoin(maybe Ethereum) Prices, may influence the prices of ETC
5. Wedge breakout either way(white transparent background)
6. 0.5 or 0.618 breakout(consolidation area)
Thanks for reading this post, stay tuned for my next analysis! Also, if you are willing to, please give feedback in the comments, thanks in advance.

ETHEREUM Elliot wave analysisEth usd has started the 5th wave so expecting a bearish move
It is also travelling inside a bearish channel..... Take bullish position ONLY after breaking out the channel

ETHEREUM LONGS ACTIVE 📉📉📉📉 Expecting bullish price action on ETH as we are rejecting an important area of ,,support,, bullish orderblock area on H4 + institutional figure 3000$ price takes out liquidity below it and quickly reverse to the upside. If we will see there a bullish closure above we will go higher. A lot of bearish imbalances also left on the bearish move that should be closed ASAP.
GREED/INDEX Indicator tells us that today crypto market is in a extreme fear market sentiment meaning there is a good buying opportunity.
Stock Market wants go up from a FUNDAMENTAL / TECHNICAL perspective. We have a positive correlation between stocks/crypto and this is another reason why we will go up from there.
What do you think ? Comment below..

ETHEREUM LONGS ACTIVE 📉📉📉📉 Expecting bullish price action on ETHEREUM as price rejected an important area of ,,support,, if you will that's the bullish orderblock area on the H4 3160. Price also taked out the sell side liquidity aka buy stop losses below the old low. The reason i am not bearish right now on ETH is that price has A LOT OF bearish imbalances on the H1/H4 timeframe and i don't think we will go lower without filling those price ineffiecieny. First targest for the LONG order would be somewhere around buy side liquidity old high liquidity pool 3300$ price area.
FEAR/GREED Index on the CRYPTO market says we are in FEAR now, meaning there is a good buying opportunity.
What do you think ? Comment below...

ETHEREUM MARKET ANALYSIS 📉📉📉📉 Ethereum - Market Analysis for the upcoming days.
What do you think ? Comment below..
