ETCBTC formed a bullish butterfly | Upto 374% from herePriceline of Ethereum Classic / Bitcoin cryptocurrency has formed a bullish Butterfly pattern and entered in potential reversal zone.
RSI is entered in oversold zone.
Price action has also hit the support of lower band of bollinger bands.
Stochastic has given bull cross.
Priceline is now gearing up to hit the sell targets soon insha Allah.
I have defined the targets using Fibonacci sequence:
Buy between: 0.00053857 to 0.00000001 (but it is not possible for price action to hit 0.00000001 as it has already hit the lowest pirce of the history of ETC and indicators are turning bullish)
Sell btween: 0.00158077 to 0.00325256
Enjoy your profits and regards,
Atif Akbar (moon333)
Ethereumclassiclong


ETC USD to the Major Resistance10$ is Major Resistance zone.
It is highly likely that this zone will be reached in June, because many investors and people would like to see a price in that zone.
We can see that at this moment the price is undervalued and it is a great investment to take.
TP -- 9.90 - 10.00 $
SL -- 8.10 - 8.30 $ (Depends on your risk tolerance)
ENTRY -- 8.60 - 8.80 $
Daily FIBO 38.2 is in the same level as Major Resistance level, this can work as a strong magnet for a price movement.
Be patient and risk wisely!


[ETC/BTC] TIME TO WAKE UP COULD BE SOON [ 25-100% POT PROFIT ]#ETC / BTC ( Binance, Bittrex, Coinbase )
Buy Range : 0.00165-170
Stop Loss : Weekly close below 0.00165 ( Optional )
Target 1 : 0.00223
Target 2 : 0.00283
Target 3 : 0.00349
Ethereum Classic has lost boost after Coinbase news comes out being dumped until our buy range.
If we take look into weekly chart, you can check how this support zone has been defended good several times. This offer us a very good chance to buy on the lows with a nice risk/reward.
Short-timeframes arent offer much nice valuable info. MACD is getting better and RSI is on the middle of nothing. However, we can see a good 4h volume candle some hours ago.
Weekly chart shows Stoch RSI on the lows and ready for a new movement and CCI looks on the bottom of a red area suggesting this point can be the lows.
Finally, if bitcoin get massive dropped this coin support could be broken. On this case, i highly recommend sell and wait for new buy zone.
Good luck

Waiting for ETC breakout.From many days ethereum classic is hovering in just a pattern.
Wait for it to breakout resistance of 175000.
Invest at your own risk as it seems good profit from here but market manipulation can do opposite things as well so if you enter then do by using stop loss as well and invest only what you can afford to hold/loose for long in crypto.

Ethereum Classic : risky assumptionETCUSD : round hole, many times have seen this accumulation process
recently and than BOOM ! Also I must assume that ETC has the resistance figure of this pump idea - the bearish blue flag or the pennant. So, make a decision.

Daily Bullish Signal #ETC #ETCBTC (29-09)#ETC (ETC/BTC)
Buy : 1700-1720
Flash Sell : 1760
Short Sell : 1800
Long Sell : 1850-1900-1950-2000-2050
Stop : 1650
Follow me for more signals daily
Inbox me if you need more services

ETHEREUM CLASSIC - WILL IT FOLLOW BTC IF IT RISES? Hey Everyone,
The million dollar question right now is, will ETC and other ALTs follow BTC if it rises right now?
We are starting to slowly see slight differences in the patterns over the past few months with ALTs declining and BTC increasing with both dominance and price. So if all the money pours into BTC where does that leave the ALTs? Not in a good position in my opinion.
BUT in the past week we have seen 20 billion dollars flow into the market and BTC dominance remain steady and the popcorn symphony of the ALTCoins popping has made the market happy, it is a nice place to be when everything is green... it is like Spring in Melbourne when the frost subsides and the new buds begin to blossom...
So watch the patterns here, there is a few different possible pathways in the near and not too distant future.
REMEMBER IF YOU ARE PRACTICING SAFE... TRADING ALWAYS USE PROTECTION
(minimise your risk, use a stop loss. Especially in Margin Trades) ALWAYS!!!!!!!!!!!!!!!!!!!
<3 Lisa
DISCLAIMER:
The Legal stuff - I'm not financial adviser. Just a few quick thoughts - remember you sit at your computer, you push the buttons...
PS make sure you give me a like, that way you get updates as I post them.... :) <3

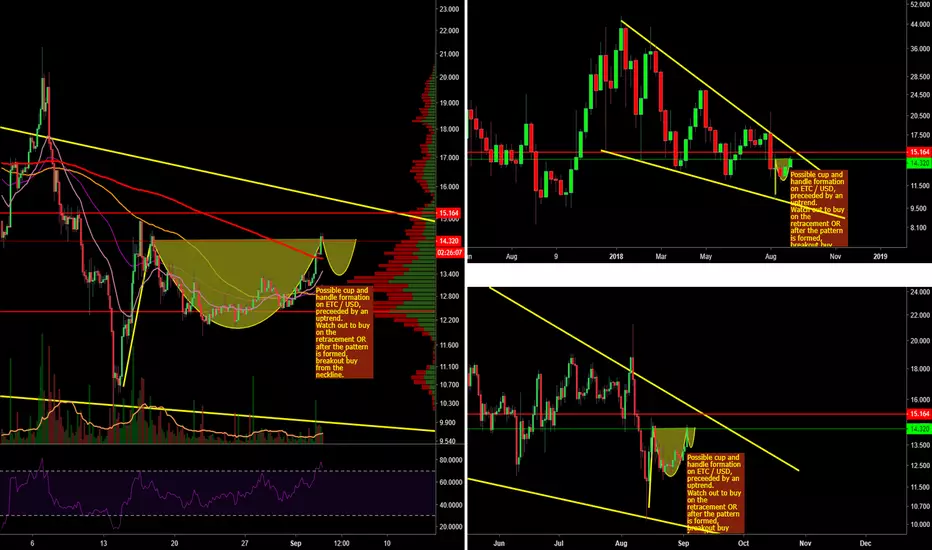
Multi timeframe analysis for ETC/USDBITFINEX:ETCUSD
ETC on various timeframes.
on 4h ETC looks like its forming a cup and handle formation we will follow up closely, potential targets of it are marked on the chart with first target 15.18 usd.
Certainly it will be a buy on the dip where the cup is forming, but we need to gather more data for more precise targets.
immediate buy target is if we fall back to 13.35 usd. stop loss below 12.8 usd.
Ether Classic (ETC) Descending pattern, another rally possible.ETC is now in a descending channel. I would be wary about trading this coin since Tron basically had the exact same thing happen to it. If we keep on getting lower and lower highs it means the trend will be down.
Therefore, if you hold ETC, I would recommend getting rid of it for the best price possible. We could be getting another rally to 2600+, so if that does happen, consider selling your position.
I know many of you held ETC due to the hype and fomo, but the pattern shown is like every other altcoin pump during Jan, where it peaks then drops for the next few candles.
This was my private ETC chart after the pump last night. I'll admit I missed out on quite a bit of gains, but it felt to dangerous for me to enter. We were getting drops of 2% in around 5 minutes.
Thanks for viewing. If any of you would like to get my private charts, please update me and I will share them all with you. This is an example of a ZRX and SNM trades I did just now:

ETHEREUM CLASSIC: COINBASE & ROBINHOOD? - PROFIT = 38.80% !!!Our "Crypto Bottom" Trade Indicator has correctly identified a buy in point on the 25th of July 2018 .
Using this buy in point and selling at today's peak price as identified by our NEW "Crypto Peak" Trade Indicator , you would have expected to net 38.80% PROFIT!!!
The increase in price may also be explained by positive developments including:
May 3: London Block Exchange Enables GBP Trading for Ethereum 1.04% -0.11% Classic ETC.
May 3: Ethereum Classic announces release of go-ethereum v5.2.0.
May 6: Grayscale Investments Announces Approval of Public Quotation for Eligible Shares of Ethereum 1.04% -0.11% -0.03% -0.75% Classic Investment Trust.
May 6: Ethereum -0.11% Classic announces ETC sidechain exploration with their "Minimal Viable Sidechain" on Github.
May 16: Ethereum -0.11% Classic Labs is launched. Its main aims are to accelerate the development, expansion, and prosperity of the $ETC community and the entire ETC ecosystem by promoting smart contract applications based on $ETC
May 23: London Block Exchange lists Ethereum 1.04% -0.11% Classic.
May 24: Ethereum 1.04% -0.11% Classic upgrades via the Mantis V1.1 Performance Release. This allows for the following features:
May 25: Spyrja: Modular Asset Tracking Software is launched on the $ETC Blockchain.
May 29: Open Bazaar lists Ethereum 1.04% Classic.
May 30: Ethereum Classic announces Protocol upgrade for ECIP-1041.
May 31: Ethereum 1.04% Classic announces that the OpenStack Credits System to be Implemented as an $ETC side chain.
June 7: Coinpayments (crypto payments processor) announces its acceptance of Ethereum 1.04% -0.11% Classic.
June 7: Ethereum -0.11% Classic today announced its collaboration with Zeniex, a cryptocurrency exchange established by a group of financial and security experts from South Korea and China.
June 8: Stocks Gazzette releases article that states that Ethereum 1.04% -0.11% Classic is a grossly undervalued coin.
June 10: Thailand’s regulatory body, The Securities and Exchange Commission, have approved a list of 7 cryptocurrencies that can be used as payment for ICOs and as trading pairs on exchanges. This includes Ethereum 1.04% -0.11% Classic.
June 12: Binance adds new Ethereum 1.04% Classic trading pairs.
June 12: Coinbase announces it will list Ethereum 1.04% Classic in the "following months".
June 14: Ethereum 1.04% -0.03% Classic Labs is launched that will provide a full range of support, including operating funds, technical guidance, office space, industrial resources, creative strategy consulting, & more.
June 15: SEC announces that Ethereum 1.04% is not a security.
June 23: CoinBene Brasil lists Ethereum 1.04% Classic.
June 23: Nova Exchange lists Ethereum 1.04% Classic.
June 24: RADEX: Saturn Network launches the First Decentralized Platform for Ethereum 1.04% Classic called Radex Classic.
(NEW) August 5: Coinbase announces it is testing support for Ethereum Classic.
(NEW) August 6: BitOasis lists Ethereum Classic
(NEW) August 6: Coinbase announced that, barring any setbacks, they’d be greenlighting “inbound transfers” of Ethereum Classic on Coinbase Pro and Coinbase Prime as of August 7th
(NEW) August 7: Ethereum Classic Overtakes NEO in Market Cap.
(NEW) August 7: Crypto Trading App Robinhood Adds Support for Ethereum Classic.
The price increase is the result of the positive developments outlined above and a recovery in the crypto markets.
***The "Crypto Bottom" and "Crypto Peak" crypto trading indicators used in this analysis is included as part of the Crypto Trade Signals subscription.***

ETC CRITICAL POINT Traders,
- Here we have ETCUSD 4H chart.
- Twitter has a word for this pair, as any tweet from coinbase whoop to gain 10:20%.
- We had a fake breaking down as I'm indicating on the chart.
- Small triangle with this fake break, showing that we have double double ratio coming so we are talking about 60:90% gains, don't take it as a recommendation it's a humble vision of mine trade safe at the end.
Regards,
Mohsen

Ethereum Classic (ETC) Bearish Divergence, drop likely.ETC has been on my watchlist for a while, and recently closed my position in anticipation for the sell-off after a 2.4% gain.
Trade can be found here
Due to the bearish divergence on the RSI, it is very possible ETC will drop, so this could be a good short position.
How to trade:
Buy in: On or above the white trendline
Sell Target
Around 2169 if this idea plays out like last time.
if we break above, this will be invalidated and a long position might be a good idea. I think it's going to drop, however.
Thanks for viewing! Please leave any comments in the section below. I will respond to all of them.

Ethereum Classic : first target !ETC/USD brokeout the triangle's resistance, forming bullish triangle formation!
TARGETS
18.8 - 20.4

$ETC #ETHEREUMCLASSIC - UPTREND CHANNEL - enter it or leave Hello Lads and Ladies,
Today we are taking a look into the highly discussed ETCBTC chart. It got listed at coin base a few days ago and since then it is starting to rocket again, but what is happening, what are the goals and where can we ETCBTC expect?
So, taking a look at the chart we can see a huge push from December to mid February - this is where we apply the fibonacci retracement, which was very well respected all along, you can confirm that with the biggest support and resistance lines being at those levels.
In the next step, we can see ETCBTC forming a big channel around mid March to May indicated in yellow increasing lines. The upper line, was a short time support after the huge drop and has turned afterwards to a resistance. The lower yellow line, has been a strong ascending support during the indicated time.
Nevertheless, after one last big push over the yellow dotted line (also being the 61.8% fibs line) in the beginning of may, it started a very strong downtrend, crashing through the yellow dotted support and resistance and then going straight through the ascending support.
It bounced from the crucial support, which is indicated with the green dotted line and got rejected at the ascending support line that has now turned into resistance. Being located at the crucial support it got a little abandoned and the volatility was very low and even then getting lower for almost more than a month. After that it just really wrecked when the whole market was taking a bloodbath going down to a support line even lower than the previous.
ANYHOW, almost miraculously coinable announced listing it and ETCBTC just went on a straight rocket trip. Retraced and formed with getting higher lows a nice wedge, from where we saw a second breakout smashing once again through the yellow dotted line and testing the ascending support from the previous channel, that is now a resistance.
So, here are possibilities, of what might happen next.
1) We see the same shenanigans happen and after going through the yellow dotted line, getting rejected at the previous ascending support ETCBTC will get into a new downtrend and get back to the previous crucial green dotted support.
1.5) Basically the same, just that ETCBTC will get down the horizontal white line which was a wedge resistance before the second breakout, forming a cup and handle from where it is going to bounce back up and test the uptrend channel.
2) ETCBTC will smash through the (yellow) uptrend channel support and will enter this channel, staying there and following it for quite a while after doing so.
2.5) It will come down to the yellow dotted line, accept it as a support, continue sideways for a few days so the RSI can adjust again and then following the ascending white support, smash into the channel and continue its journey in this nice not too steep channel.
This is also the scenario that I am signing up to and if this support holds, I am getting myself some more ETCBTC. Does it not hold, i will be looking for the cup and handle formation, which would be for me the last deciding point of getting out, if it fails.
Also, please never forget the possibility 3) ETCBTC will make a barrel roll...
Cheers, Tomas

ETC - Coinbase pump!ETC recently had news regarding its upcoming listing on Coinbase.
Seems to come completed wave 4 after doing 50% fib retracement as WXY combo correction with 2 ABC structures joined by a X wave.
Here is good long opportunity for the wave 5 in play.
Target around $17

ETHEREUM CLASSIC: COINBASE NEWS & THAILAND SEC - PROFIT = 32.85%Our "Crypto Bottom" Trade Indicator has correctly identified a buy in point on the 12th of June 2018.
Using this buy in point and selling at today's peak price as identified by our NEW "Crypto Peak" Trade Indicator, you would have expected to net 32.85% PROFIT!!!
The increase in price may also be explained by positive developments including:
April 26: Rency.com Ratings & Analytics Adds Ethereum Classic $ETC.
May 1: Ethereum Classic announces update to Mantis v1.1 Client.
May 2: Announcement that ETC consistently handles more transactions per day than: $Doge, $DASH, $BCH, $LTC, and $XMR.
May 3: London Block Exchange Enables GBP Trading for Ethereum Classic ETC.
May 3: Ethereum Classic announces release of go-ethereum v5.2.0.
May 4: Emerald Vault v0.22 application is released. It allows for: Secure offline / cold storage ETC account management.
May 4: FastTech.com Accepts ETC as Payment.
May 6: Grayscale Investments Announces Approval of Public Quotation for Eligible Shares of Ethereum Classic Investment Trust.
May 6: Ethereum Classic announces support for Ethereum Classic Command Line application on Linux.
May 6: Ethereum Classic announces ETC sidechain exploration with their "Minimal Viable Sidechain" on Github.
May 16: Ethereum Classic Labs is launched. Its main aims are to accelerate the development, expansion, and prosperity of the $ETC community and the entire ETC ecosystem by promoting smart contract applications based on $ETC
May 23: London Block Exchange lists Ethereum Classic.
May 24: Ethereum Classic upgrades via the Mantis V1.1 Performance Release. This allows for the following features:
HardFork Ready
- Download & Sync (faster)
- Integrated with Daedalus Wallet
- Run Node from CLI
(NEW) May 25: Spyrja: Modular Asset Tracking Software is launched on the $ETC Blockchain.
(NEW) May 29: Open Bazaar lists Ethereum Classic.
(NEW) May 30: Ethereum Classic announces Protocol upgrade for ECIP-1041.
(NEW) May 31: Ethereum Classic announces that the OpenStack Credits System to be Implemented as an $ETC side chain.
(NEW) June 7: Coinpayments (crypto payments processor) announces its acceptance of Ethereum Classic.
(NEW) June 7: Ethereum Classic today announced its collaboration with Zeniex, a cryptocurrency exchange established by a group of financial and security experts from South Korea and China. This has resulted in the signing of the Memorandum of Understanding between the Ethereum Classic Cooperative and Zeniex.
(NEW) June 8: Stocks Gazzette releases article that states that Ethereum Classic is a grossly undervalued coin.
(NEW) June 10: Thailand’s regulatory body, The Securities and Exchange Commission, have approved a list of 7 cryptocurrencies that can be used as payment for ICOs and as trading pairs on exchanges. This includes Ethereum Classic.
(NEW) June 12: Binance adds new Ethereum Classic trading pairs.
(NEW) June 12: Coinbase announces it will list Ethereum Classic in the "following months".
The general uptrend in the crypto markets as well as the positive developments outlined above.
***The "Crypto Bottom" and "Crypto Peak" crypto trading indicators used in this analysis is included as part of the Crypto Trade Signals subscription.***

ETC - This support is strong.Hello traders! Today let's talk about ETC .
Important points
Approaching a descending daily trendline printed from the high formed 4 months ago.
Support zone ( Yellow line ) is strong , not even a daily candle has been able to break that.
Yesterday ETC closed the day with a bullish engulfing ( candlestick bullish pattern )
Would start to buy it , with a just a little bit of the capital , not a big size , then if should occur a breakout followed from good volume would increase the position , for the moment as i said would buy but with a little size.
Let's wait for this week maybe something could happen.
Have a nice weekend traders and take care of your capital.
This is just my analysis and not a financial advice

ETHEREUM CLASSIC ETC TO $1,000 WITH COINBASE - CryptoManiac101As coinbase lists Ethereum Classic in coming month - it gives us even more confidence in reaching $1,000 target by Early 2019 - around January, but not exactly
Ethereum Classic was one's listed on Coinbase however it was taken down a few years ago. This just shows the true necessity Coinbase has and huge potential Coinbase Pro sees in this unique crypto currency which will grow in same way as Ethereum grew in 2017.
For those who would like to challenge us and comment all over this chart below that it will never happen and spread all the FUD, we have to say only one thing. You're entitled to your opinion, however please be mindful of those who actually believe in this coins and to all holders of Ethereum Classic. We are providing you our personal opinion for no charge on here, keep that in mind as well please.
Enjoy this trade my Crypto Maniacs, but remember to invest only what you can afford to lose or you're going right back to poverty on drop. We are not your financial advisors.

Large degree accumulation on ETC, Effect will be hugeTaking a look at the price of ETC on the weekly.
and my god.
does it look like we are going to have a flat (few years?) after which our markup will be IMMENSE.
reason why?
Cause and effect.
Larger the cause, larger the effect.
Wyckoff suggests that accumulation and distribution are cause zones, and mark up and marke down are the effects.
Say ETC accumulates for a year, the markup on ETC will be huge.
Now's not the time to buy.
Time to buy is when ETC really falls down to like
0.0013 - 0.0016
We will likely bounce between the 2 support and 2 resistance lines (2nd resistnace line might not have even been formed yet, I don't spot an ST that usually occurs in Phase B - although 0.002 might be it)
I'm happy to wait a few months to see what ETC wants to do.
But for now, take a look at the magnificence of the setup we are currently playing out. (almost 10 months since we had our first sign of PSY)
The markup will be immense. This accumulation might take a few years to play out, i definitely want to be there to catch the rocket up.

ETC litte breakout ?On that chart i found a little breakout on the 2h chart. If we can hit 250k sat than we go up next time. ETC is very special coin, it didnt pumped like other coins, so you must be very patient with it. I am long since month and i know that ETC will do in 2018 a great job in ETCBTC and also in ETCUSD.
