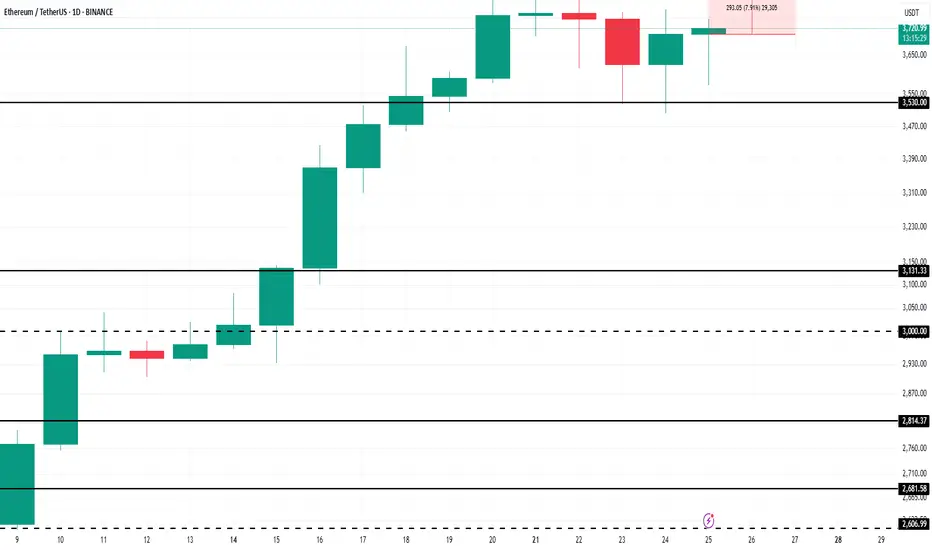
Ethereum’s $4,000 Target Alive as Historic Rally Signs EmergeBINANCE:ETHUSDT is currently trading at $3,680, just 9% away from the critical $4,000 resistance that many investors have been waiting for over the past seven months. The altcoin is expected to continue its upward momentum despite the recent consolidation, with the potential to breach the $4,000 mark soon.
Looking at broader technical indicators, the NUPL (Net Unrealized Profit/Loss) suggests that BINANCE:ETHUSDT is poised for a significant rally . The NUPL indicator, when reaching a threshold of 0.5, traditionally signals a pause in the uptrend, followed by a sharp rally.
$ BINANCE:ETHUSDT is currently nearing this threshold , which, in the past, has marked the beginning of powerful upward price action.
As long as BINANCE:ETHUSDT remains above its key support levels, the price is likely to surge toward $4,000 . If Ethereum can maintain its momentum, a breach of $4,000 could act as a catalyst for further gains.
However, should unforeseen selling pressure arise, $BINANCE:ETHUSDTprice could slip below the $3,530 support level. In such a scenario, Ethereum may fall to $3,131, invalidating the current bullish outlook. The key will be maintaining support and capitalizing on the retail-driven surge.
Ethereumforecast
ETH: Eyes Resistance, But Correction Still LoomsEthereum has also seen a modest pullback since yesterday morning, but here too, it’s too soon to confirm a high for turquoise wave B. Accordingly, we anticipate further gains in this corrective rally—potentially up to resistance at $4,107—before the subsequent turquoise wave C takes over and drives the price down into the green long Target Zone ($935.82–$494.15). Within this range, we primarily expect the low of the wave- correction, which has now lasted more than four years, setting the stage for a long-term trend reversal to the upside. According to to our alternative scneario, magenta wave alt.(1) would complete with the next high. The following pullback, attributed to wave alt.(2), would then only extend into the slightly adjusted magenta Target Zone ($2,622–$1,914) before a move to new all-time highs (probability: 35%).
📈 Over 190 precise analyses, clear entry points, and defined Target Zones - that's what we do (for more: look to the right).

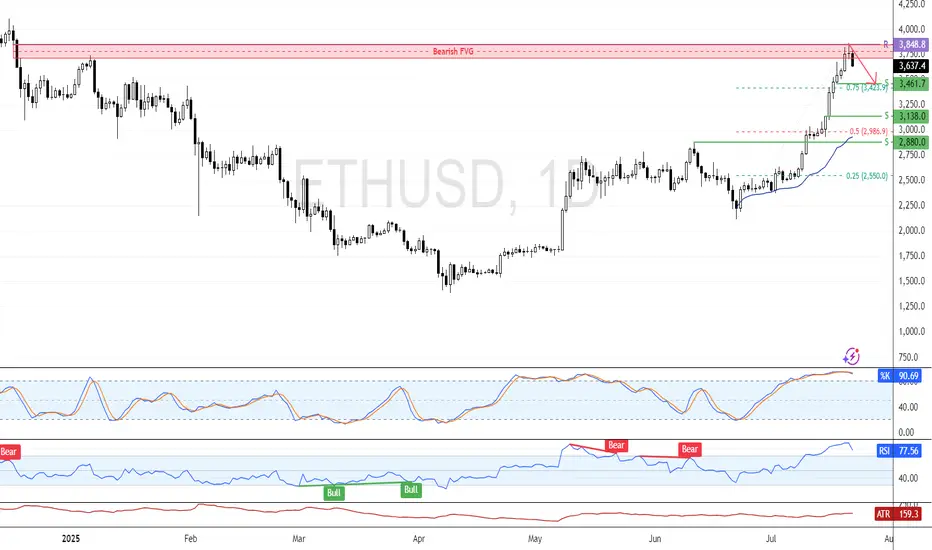
ETH Eyes Consolidation from Overbought ZoneFenzoFx—Ethereum pulled back from the daily bearish FVG. The recent candle closed with a long wick and flat body, reflecting market uncertainty. Momentum indicators remain in overbought territory, signaling a possible consolidation phase.
If resistance at $3,848.0 holds, the price may decline toward support at $3,461. However, the bullish outlook stays valid as long as ETH/USD holds above $3,848.0.
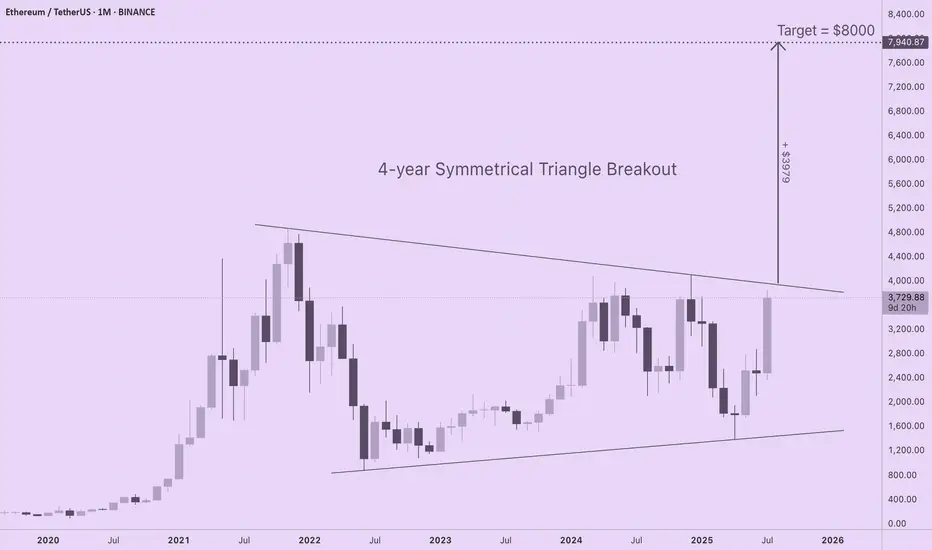
ETH Targets $8000 with 4-Year Symmetrical Triangle BreakoutIf you are seeking realistic ETH price targets based upon solid long-term market structure, check out this 4-year symmetrical triangle forming on the ETH/USD monthly chart. ETH is coiling for a major move to $8000, yet none of the CT "influencers" I follow are talking about this. I am new to technical analysis, so I am interested in learning your thoughts about this pattern and which tools or indicators you prefer for setting price discovery targets.
For those of you new to technical analysis, symmetrical triangle patterns can form on long timeframes (weeks, months, or years), indicating indecision between bulls and bears as price compresses within a continually narrowing range. A breakout from a symmetrical triangle typically follows the direction that preceded their formation, and the longer the consolidation period, the stronger the move.
The chart shows a strong euphoric phase in 2021 followed by a bear market low. Subsequent failure to reach previous ATHs is balanced by a pattern of higher lows. Since ETH was in an uptrend prior to triangle formation, odds are this is a continuation pattern, especially given profound shifts in capital flows and sentiment for the asset over the last several weeks.
With trendlines set at the price extremes, the height of the triangle is roughly $3980. If a breakout occurs at a price of $3960, ETH will target a price of $7940 (height of triangle + breakout price). A more conservative price target of $7000 is obtained by resetting the trendlines at the monthly opening and closing prices (omitting the wicks).
Regardless of the specific method for drawing the triangle, ETH is primed for a major move to the upside that has been four years in the making.
$Eth Ethereum nearing critical resistance....All Time High soon!This is a weekly candlestick chart of ETHUSD
Current price: 3800
CRYPTOCAP:ETH Ethereum recently broke out of a long-term downtrend, indicated by the red diagonal trendline. Price action has shifted from bearish to bullish. This is also a show of strong Momentum as recent candles are large and green, showing aggressive buying (strong bullish pressure).
If #eth continues in this uptrend then here are the resistance above to watch: 4000, 4800 and possibly new all time highs at 5600, 6400
Note worthy to know that the areas between 3800-4000 is very critical resistance.
Assuming a retracement from this resistance, Ethereum remain bullish above 2900
Invalidation of this idea is under 2900

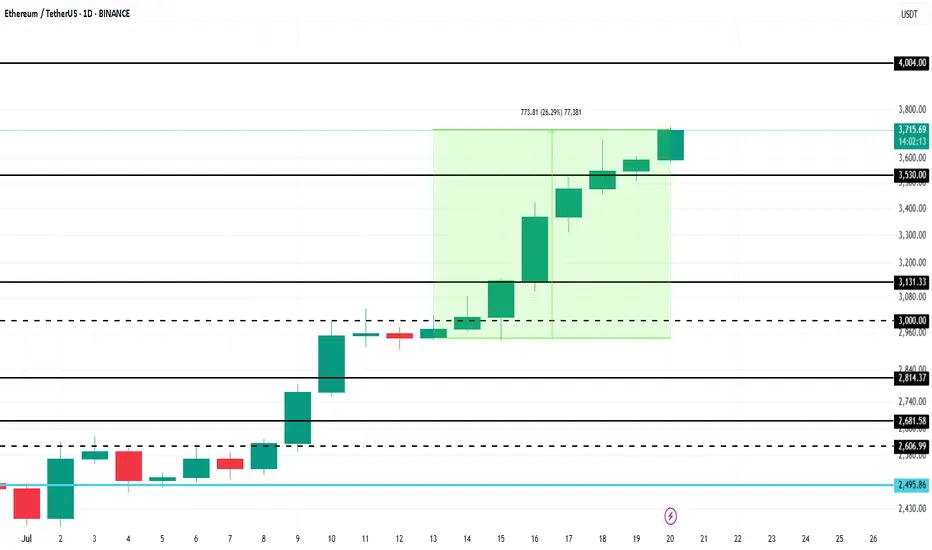
Ethereum Price Hits 6-Month High, Up Next $4,000BINANCE:ETHUSDT has managed to navigate recent market volatility with significant support from investors. As companies increasingly mirror Bitcoin’s corporate treasury use case, Ethereum is gaining traction.
BINANCE:ETHUSDT price surged 26% over the past week , reaching $3,715 and marking a 6-month high. The rally strengthened after ETH formed a Golden Cross last week. With this bullish momentum, Ethereum is now targeting $4,000 in the coming days, benefiting from investor confidence and growing institutional interest.
However, if BINANCE:ETHUSDT bullish momentum weakens and investors opt to sell, the price could decline to $3,131 . This would erase recent gains and invalidate the current bullish outlook.
Ethereum - Finally new all time highs!🔬Ethereum ( CRYPTO:ETHUSD ) will break out now:
🔎Analysis summary:
For more than four years, Ethereum has overall been moving sideways. However now Ethereum is once again retesting previous all time highs and preparing a bullish breakout. Multiple retests are generally considered bullish so the breakout is very likely to happen any time soon.
📝Levels to watch:
$4.000
🙏🏻#LONGTERMVISION
SwingTraderPhil

Ethereum: Overbought Conditions Persist Near $3,746ETH is testing the volume point of interest at $3,417.0, while strong resistance and an order block reside at $3,746.0. Indicators remain in overbought territory, signaling short-term overpricing.
With little resistance shown in the volume profile, ETH is expected to fall back and retest the $3,404.0 support level. Traders and investors should monitor this zone closely for a potential bullish setup.

ETH/USD Setup | Thief Trading Blueprint for Profit.🔥🚨THE ETHEREUM HEIST PLAN: Thief-Style Trading Blueprint for Maximum Gains🚨🔥
💰Thief Mode: Activated | Time to Rob the Bulls 💰
📢🌍 Hello Money Makers, Crypto Crooks & Chart-Breaking Bandits! 🐱👤🤑💸
Welcome to the “Thief Trading Style” breakdown — a high-stakes, high-reward crypto market blueprint built on deep technical & fundamental intel. This isn’t your average strategy… it’s a full-blown heist on the ETH/USD market!
🧠 THE MASTER PLAN (ETH/USD – Day & Swing Trade)
🔎 Based on our Thief Mode analysis — blending market sentiment, trend psychology, and price action — Ethereum is ripe for a bullish robbery. We’re setting up shop at high-risk liquidity traps and targeting bearish overconfidence.
💥ENTRY STRATEGY – "The Vault Is Open, Time to Strike!" 💥
🟢 Go Long:
Swipe in on bullish momentum.
🕒 Set Buy Limit Orders at key pullback zones (swing highs/lows from 15m or 30m timeframes).
💼 Use DCA (Layered Orders) for multiple precision entries. The more layers, the stronger the loot stack.
🛑STOP LOSS – "Thief Rule: Don’t Get Caught"
📍Place SLs at logical swing highs/lows using the 1H timeframe
💡 Adjust according to lot size & how many entries you're stacking
Risk smart, steal smarter!
🎯TARGET – "Make the Escape at 2850.0 or Jump Early if Cops Close In!"
📌Set TP at 2960.0, or
📌Exit early if the market starts turning shady (exit before reversal signs appear)
⚔️SCALPER'S CODE – "Fast Hands Only!"
🧲Only scalp Long-side plays
🧠Use trailing SLs to protect stolen profits
💼Big wallets? Front-run the move
🪙Smaller bags? Team up with swing traders and follow the blueprint.
🚨MARKET CONTEXT – Why This Heist is Bulletproof
💥ETH/USD is showing bullish energy due to:
Macro & Fundamental Drivers
On-Chain Metrics showing accumulation
Sentiment Analysis leaning toward over-leveraged bears
Intermarket Correlation signaling rotation into altcoins
🔗Stay sharp, keep updated with: COT Reports, Macro Calendar, Crypto News Feeds
⚠️NEWS RELEASE WARNING – "Robbers Hate Surprises"
📛Avoid new entries during major news releases
📈Use Trailing Stop Losses to lock in profits
⛔Don’t leave positions unmanaged during volatility spikes
💖LOVE THE PLAN? THEN BOOST THE GANG!
🎯Tap the 🔥 Boost Button 🔥 and show support for the Thief Trading Style!
The more boosts, the more plans drop — let’s build a community of smart traders robbing the market legally (😉).
✍️DISCLAIMERS
📌This analysis is for educational purposes only — not financial advice.
📌Always trade within your own risk management rules.
📌Market conditions change fast — adapt, evolve, and don’t trade blindfolded.
🚀Stick around for more blueprints — the next heist is always just around the corner.
Until then… Lock. Load. Loot. 🐱👤🤑💰

ETH/USD ROBBERY IN PROGRESS! Long Now, Exit Before Bears Attack!🚨 ETH/USD HEIST ALERT: Bullish Loot Before the Trap! 🚨
Thief Trading Style: Steal Profits & Escape Before the Cops Arrive!
🌟 Greetings, Market Pirates & Profit Bandits! 🌟
(Hola! Oi! Bonjour! Hallo! Marhaba!)
🔥 The Ethereum vault is WIDE OPEN! Time to execute the Thief Trading Strategy—bullish momentum is primed for a heist. Long entries only! Target the highs, then vanish before the overbought trap snaps shut.
🔑 Heist Plan (Day/Swing Trade)
🎯 Entry: "The vault is unguarded—swipe bullish loot at any price!"
Pro Tip: Use buy limits within 15-30min for pullback entries (recent swing lows/highs).
🛑 Stop Loss:
Thief SL (4H): 2240.0 (Nearest swing low)
Adjust SL based on risk, lot size & multiple orders.
🏴☠️ Target: 2800.0 (or escape earlier if bears ambush!)
⚡ Scalpers’ Quick Loot:
Only scalp LONG!
Big wallets? Charge in! Small wallets? Join swing traders & rob smart.
Trailing SL = Your Escape Rope!
📢 Why Ethereum?
🐂 Bullish momentum + strong fundamentals = Perfect heist conditions!
(Check COT reports, macro trends & sentiment— check 👉🔗!)
⚠️ WARNING: Cops (Bears) Are Setting Traps!
Avoid fresh trades during news!
Trailing SL = Lock profits & run!
💥 BOOST THIS HEIST!
🔥 More boosts = Faster profits!
🚀 Daily robberies = Easy money!
Stay tuned—next heist coming soon! 🤑💎 (Like & Follow for more loot!)

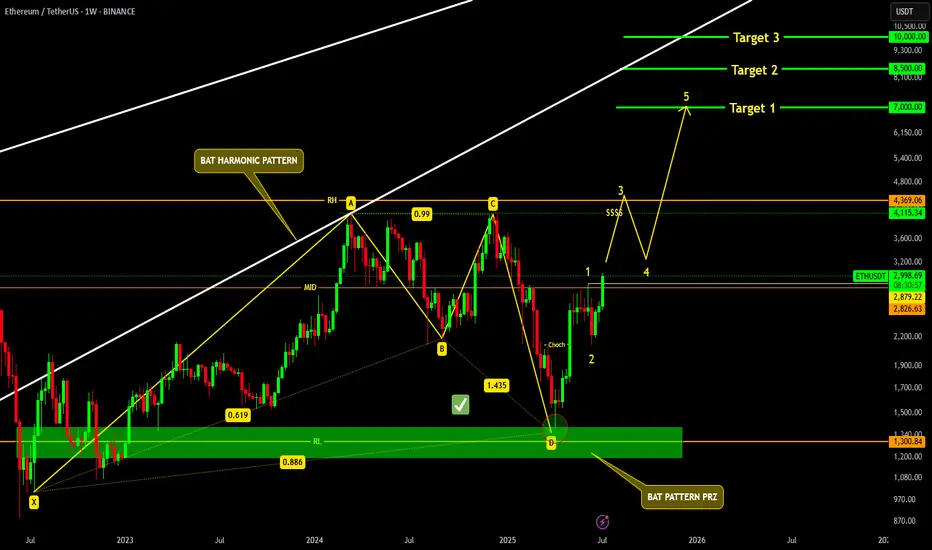
ETHEREUM READY TO SMASH 10K !!!AS per previous Ethereum update, CRYPTOCAP:ETH successfully tapped our Bat PRZ and making it's way to the top.
as per micro elliott wave count, we will see Ethereum slamming 7k, and could potentially smash 10k in coming months.
Ethereum Stalls at $3,101.0FenzoFx—Ethereum broke past $2,880.0 but stalled near a bearish fair value gap. The daily chart shows a longwick bearish candlestick, signaling increased selling pressure.
With Stochastic at 90.0, ETH is short-term overbought. Resistance is at $3,101.0—if it holds, ETH may retreat to $2,880.0 or $2,638.0.
A close above $3,101.0 would invalidate the bearish outlook and pave the way toward $3,330.0.

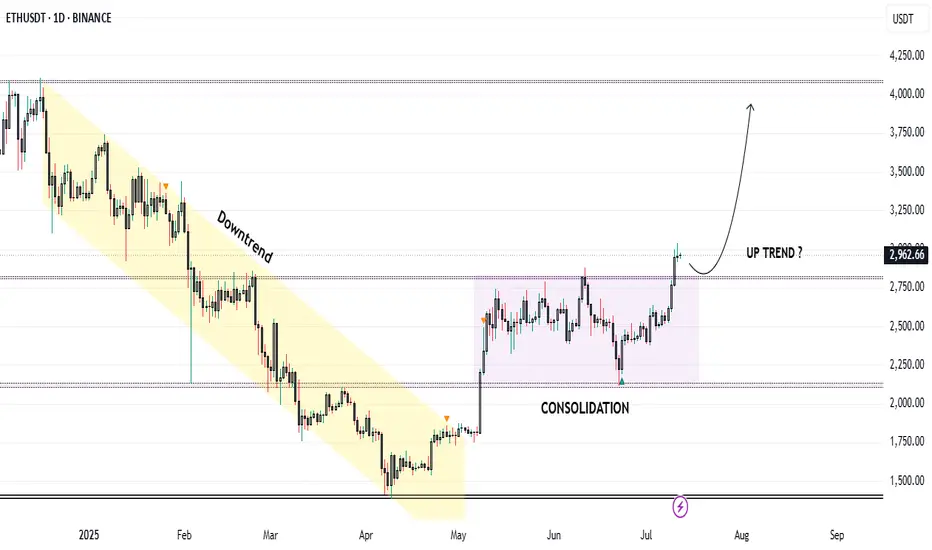
Trend Resumes: Ethereum Breaks Consolidation, Eyes $4050Market Structure Overview:
Markets typically move in two major phases:
🔹 Trend Phase (directional movement)
🔹 Consolidation Phase (sideways movement or accumulation/distribution)
These phases repeat as: Trend → Consolidation → Trend → Consolidation
Ethereum Price Action Breakdown (Daily Timeframe):
Mid-December to End-April: Clear downtrend phase.
May to Early July: Entered a consolidation zone, forming a tight range.
Current Status (July):
🔹 Ethereum has broken out of the consolidation range.
🔹 Currently trading around $3000, confirming strength.
🔹 This breakout may potentially signal the start of Altcoin Season.
Trade Setup – Long Position Idea:
Entry (Buy Zone): Around $2850 (retest of breakout resistance).
Target:
🔹 Primary Target: $4050
🔹 This aligns with a major resistance and Fibonacci extension zone.
Stop Loss: $2600 (below key structure support).
Technical Confluences:
* Breakout above multi-week range.
* Retest of resistance turned support at \$2850.
* Psychological round level near \$3000 acting as a magnet.
* Volume confirmation on breakout (optional to mention if on chart).
Risk Note:
⚠️ Caution: The Market may turn volatile due to unexpected geopolitical or macroeconomic news. Always follow risk management and avoid overleveraging.
Conclusion:
Ethereum’s breakout from a multi-month consolidation phase indicates a potential shift in momentum. If retest levels hold, this could be the beginning of a strong upside rally, possibly leading to a broader Altcoin Season. Traders can position themselves accordingly with a well-defined risk-reward setup.
Ethereum Approaches $2,908 as Bullish Momentum FadesEthereum remains bullish, trading near $2,796 and approaching monthly resistance at $2,908. Stochastic shows an overbought reading of 81.0, suggesting short-term buying exhaustion.
Bearish Scenario : A pullback toward $2,651 is likely if $2,908 holds. Extended selling pressure could lead to a test of the anchored VWAP near $2,500.
Bullish scenario : A confirmed breakout above $2,908 would likely extend the rally toward $3,260.

Ethereum Analysis – Vitalik’s Gas Cap Proposal Adds PressureToday, I want to show you the possible moves for Ethereum ( BINANCE:ETHUSDT ) this week.
Please stay with me .
Let’s first take a look at the important news that has come for Ethereum in the last 24 hours :
Ethereum’s Gas Cap Proposal Sparks Concerns
Ethereum co-founder Vitalik Buterin recently proposed EIP-7983 , introducing a gas limit cap to prevent potential DoS (Denial of Service) attacks on the network.
Bearish Takeaways:
This proposal reveals a current vulnerability in Ethereum’s infrastructure. If gas limits grow unchecked, nodes may fail to sync, leading to possible network instability.
Imposing a gas cap could temporarily reduce transaction throughput, affecting DeFi protocols and NFT platforms that rely on Ethereum’s scalability.
The market tends to react cautiously to core protocol changes, and this uncertainty could trigger short-term selling pressure.
Bullish Counterpoints:
The cap aims to strengthen the network’s long-term stability against spam and DoS attacks.
It’s still in the proposal stage, with no immediate impact on users or network performance.
Conclusion:
While the long-term impact may be positive, the short-term uncertainty and exposed risks provide a bearish narrative for Ethereum, especially amid growing competition from alternative chains.
--------------------------------------
Now let's take a look at the Ethereum chart on the 4-hour time frame .
Ethereum is currently trading near the Heavy Resistance zone($2,929-$2,652) and Resistance lines , and is also trying to break the Support line .
In terms of the Elliott Wave theory , it seems that Ethereum has completed the Zigzag Correction(ABC/5-3-5) , so we can expect the next bearish wave .
I expect Ethereum to fall to at least $2,433 AFTER breaking the Support line, and if the Support zone($2,491-$2,323) is broken, we should expect further declines.
Second Target: $2,374
Note: Stop Loss (SL) = $2,689= Worst Stop Loss(SL)
Please respect each other's ideas and express them politely if you agree or disagree.
Ethereum Analyze (ETHUSDT), 4-hour time frame.
Be sure to follow the updated ideas.
Do not forget to put a Stop loss for your positions (For every position you want to open).
Please follow your strategy and updates; this is just my Idea, and I will gladly see your ideas in this post.
Please do not forget the ✅' like '✅ button 🙏😊 & Share it with your friends; thanks, and Trade safe.

Ethereum Bullish Bias Pauses After Reaching Weekly HighF enzo F x—Ethereum rose from $2,539.5, backed by VWAP and volume profile, but momentum eased after hitting the $2,651.0 weekly high. Stochastic signals overbought conditions at 87.0, hinting at possible consolidation or downside pressure.
Bullish scenario : The bullish trend remains intact above $2,500, with upside potential toward the bearish FVG at $2,741.0.
Bearish scenario : A close below $2,500 would shift focus to the $2,383 support zone.

Ethereum: Eyeing New Highs?Ethereum has surged recently and continues rising in turquoise wave B. The next target is a break above the June high, with potential upside to resistance at $4,107. A direct breakout above this level (27% probability) would suggest green wave alt. ended in April. However, our main scenario expects a reversal below $4,107, with turquoise wave C likely dragging ETH into the Long Target Zone between $935.82 and $494.15 to complete wave .
📈 Over 190 precise analyses, clear entry points, and defined Target Zones - that's what we do.

ETH Momentum Builds Above Key SupportFenzoFx—Ethereum bounced from the $2,397.0 support and swept liquidity below the level, backed by a bullish FVG on the 4-hour chart. ETH is currently testing resistance at $2,500.0, and a breakout could lead to a retest of $2,539.0.
The bullish setup remains valid above $2,397.0; below that, $2,317.0 becomes the next support.

Ethereum Slides Toward $2,446 SupportEthereum was rejected at the $2,539.0 resistance and is falling toward $2,446.0 support. A hold here could launch a retest of $2,539.0, while a close below $2,446.0 may spark a decline to $2,397.0.

Ethereum Faces Resistance at $2,539.0Ethereum was rejected at the $2,539.0 resistance, a high-volume supply zone. If this level holds, ETH could drop toward $2,397.0, and a break below it may trigger further downside toward $2,192.0.
The bearish outlook is invalidated if ETH/USD closes above $2,539.0.

Inverse Head and Shoulders on Ethereum: Short Opportunity ETH?I'm currently watching Ethereum , and things are starting to look interesting.
We’re seeing early signs of a potential break in structure to the downside, and I’m closely monitoring a bearish inverse head and shoulders pattern. On the 30-minute timeframe, I’m waiting for a clear break of market structure within the current range before considering a short entry.
Stop loss would be placed above the range, with the target outlined in the video.
This is not financial advice—please trade responsibly and always manage your risk.

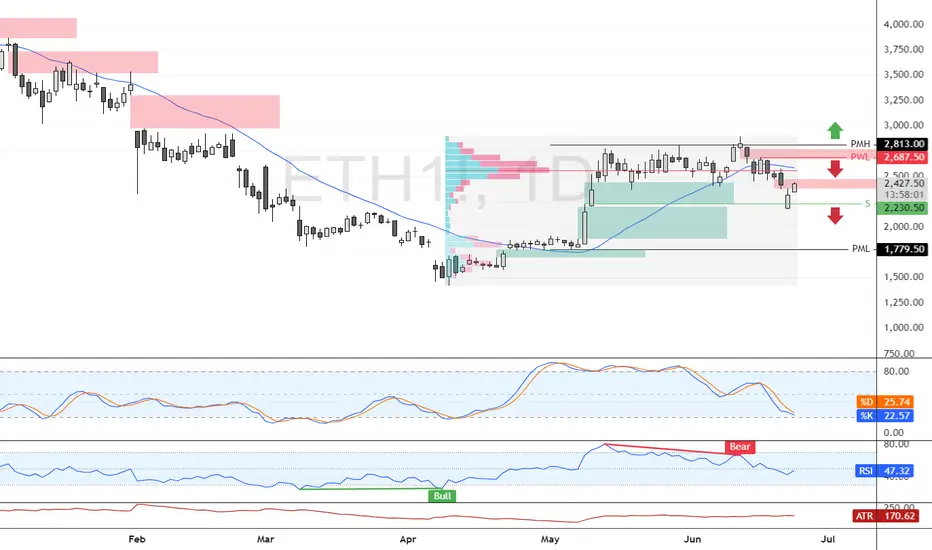
Bearish Wave Builds Below Key ETH Supply ZoneFenzoFx—Ethereum failed to break above $2,813.0 and is now trading around $2,430 after trimming nearly 5.0% of recent losses.
The $2,687.0 area, backed by the 50-period SMA, acts as a premium supply zone. A bearish wave could follow, targeting $1,779.0, supported by prior monthly lows and RSI divergence.
The bearish outlook is invalidated if ETH/USD closes above $2,813.0.
Ethereum Price Reversal ? $2100 Support & Altcoin Season OutlookAfter an extended period of consolidation, Ethereum (ETH) has finally retested the critical support level of $2,100, which aligns closely with the 0.5 Fibonacci retracement level of the bullish trend that began in April. This confluence of technical factors strengthens the validity of this level as a strong demand zone.
The price action suggests that ETH may be gearing up for a bullish reversal, as it respects both horizontal support and key Fibonacci structure. Historically, the 0.5–0.618 retracement zone acts as a high-probability reversal area in trending markets, particularly when accompanied by volume stabilization and long-tailed candles on the daily chart.
Trade Plan: Spot and Futures Positions
Given the current structure, this presents a favorable opportunity to accumulate ETH on spot for the anticipated altcoin season. In addition, leveraged long positions in futures can be considered with clearly defined risk parameters.
Entry Zone: Around \$2,100
Stop Loss: \$2,000 (below key support)
Target Levels:
Primary Target: $2,500 (previous resistance / psychological level)
Secondary Target: $2,600 (major structure high)
The risk-to-reward ratio remains attractive, particularly if the broader crypto market continues its uptrend and Bitcoin maintains stability.
Market Context
Broader macro sentiment and the dominance cycle suggest capital rotation into altcoins could be near. With Ethereum leading major Layer 1s, a recovery from this level could catalyze a wider altcoin rally**, making this an important zone to watch for both intraday traders and swing investors.
⚠️ Note: Due to ongoing geopolitical tensions between Israel, Iran, and the United States, global financial markets—including crypto—may experience heightened volatility. Traders are advised to manage risk carefully and avoid overleveraging during uncertain macro conditions.
