Can ETH Really Hit $80K? Adoption Trends and Technicals Say, YESEthereum’s adoption is booming in 2025, with over 50 major enterprises building on its network, a 21.7% global crypto ownership share, and $102 billion in stablecoin volume. Daily transactions hit $13.74 billion, and new addresses doubled to 200,000 in January 2025. The 3W chart shows ETH at $1,859.1, oversold (Stochastic RSI -101.5), hinting at a potential bounce. A 43x increase to $80K would need a $40 trillion market cap—steep but not impossible given historical 400x growth (2016–2021). Layer 2 scaling and ETF inflows support the bull case, but competition from Solana and privacy concerns could hinder the journey. What do you think? Or am I just insane?
Ethereumforecast

Ethereum Consolidates Near the 50-SMAFenzoFx—Ethereum remains in a bull market above the 50-period simple moving average, though momentum slowed after testing resistance at $1,857.0. At the time of writing, it trades around $1,812.0, consolidating near the 50-SMA.
As long as the price stays above $1,690, the outlook remains bullish. A close above $1,857.0 could push ETH/USD toward the next resistance at $1,957.0.
Bearish Scenario: A break below $1,690.0 would invalidate the bullish outlook and could trigger a drop toward $1,538.0.
***
>>> No Deposit Bonus
>>> %100 Deposit Bonus
>>> Forex Analysis Contest
All at FenzoFx Decentralized Forex Broker

Ethereum Trades Sideways: Bulls Need a PushFenzoFx—Ethereum is trading sideways but remains above the 50-period simple moving average, signaling a bullish market. ETH is currently priced around $1,785. A close above $1,835 could trigger a move toward the $1,950 resistance.
Bearish Scenario:
If Ethereum falls below $1,690, supported by the 50-period simple moving average (4-hour chart), it could decline toward the $1,565 support level.

Ethereum Up 30% — But Is This the Start of a Trend Reversal..?Ethereum Up 30% — But Is This the Start of a Trend Reversal..?
Ethereum has seen a notable bounce this month, climbing approximately 30% from its local bottom of $1,400 to its current level around $1,800. While this rally might appear promising at first glance, a deeper look at the daily timeframe reveals a more cautious picture.
Despite the recent price surge, Ethereum remains technically in a **downtrend**. A well-respected downtrend continues to hold as resistance, and ETH is currently **retesting this trendline**. This point of contact now sets the stage for two potential scenarios:
**Scenario 1: Rejection from the Trendline**
If Ethereum fails to break above the trendline, it’s likely to face **rejection**, which could send the price back toward the $1,400 level. A revisit to this support zone would form a **potential double bottom**, a classic reversal pattern. If that plays out, we could then start to look for signs of a genuine trend reversal.
**Scenario 2: Breakout Above the Trendline**
On the other hand, if ETH manages to **break through the trendline**, that alone shouldn't be a green light to go long just yet. There’s a significant resistance level sitting around **$2,100**, which has previously acted as a ceiling for price action. A true breakout would require Ethereum not only to cross this level but also to **sustain above it for 2–3 days**. Only then could a long position be considered relatively safer, with upside targets extending to **$2,800** and even **$4,000**.
**Final Thoughts**
While the recent rally is encouraging, it's essential to remain cautious. The downtrend isn't officially over until key technical levels are cleared and held. Until Ethereum breaks above both the downtrend and the $2,100 resistance zone — and proves its strength with sustained movement — the **best strategy may be to sit on the sidelines** and let the market play out.
Patience often pays in crypto — and right now, **watching closely** could be the smartest move.

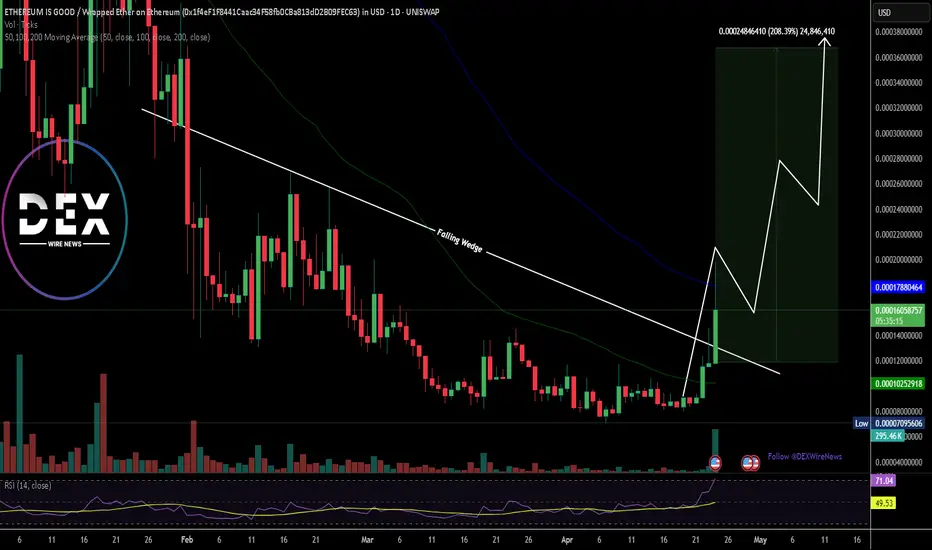
Breaking: $EBULL Spike 70% To Reclaim $1 Million Market Cap The price of Ethereum is Good token ticker name ($EBULL) has seen a notable surge of 70%, breaking out of a falling and setting the stage for a 200% leg-up.
Lunched Oct 06, 2024 (7 months ago) with a price of $0.00005729, $EBULL hit its all-time-high Aug 31, 2024 (8 months ago) and has since plunge losing about 94% of market value.
Ethereum is good coin ($EBULL) has been a ticking time bomb in the crypto market with cryptic post by Vitalik Butetrin Ethereum's founder, $EBULL might just be on the cusp of a breakout.
Another bullish thesis is the fact that $EBULL is only listed on one CEX which is Poloniex. With more exchange listings, $EBULL might be the catalyst for the next bull run.
With growing momentum and reduction of fees on the Ethereum chain, we will see an influx of traders back to the Ethereum ecosystem, leading to massive adoption of Ethereum chain coins.
$EBULL's RSI is at 71, making it a prime contender of the continuation pattern as the memecoin has already broken the ceiling of a falling wedge.
ETHEREUM IS GOOD Price Data
The ETHEREUM IS GOOD price today is $0.000166 USD with a 24-hour trading volume of $307,290 USD. ETHEREUM IS GOOD is up 40.90% in the last 24 hours. The current CoinMarketCap ranking is #1721, with a market cap of $1,658,645 USD. It has a circulating supply of 10,000,000,000 EBULL coins and a max. supply of 10,000,000,000 EBULL coins.
ETH - New ATH Approaching?Bitcoin has been full of surprises over the past few days, and this will most definitely affect Ethereum as well - which has not made a previous ATH when BTC did , a point we should not be forgetting.
This would also bring about the beginning of a new ALTSEASON.
But before we get too excited about all of the above - let's first see if Bitcoin can continue to CLOSE daily candles above the key support zone, as pointed out in the video.
_______________
BINANCE:ETHUSDT
BINANCE:BTCUSDT

Ethereum is Overbought at $1,835FenzoFx—Ethereum remains bullish, trading near $1,800 after a momentum slowdown at this level. A long-wick bearish candle has formed on the 4-hour chart, though resistance here is limited. Overbought readings on the Stochastic and RSI 14 suggest short-term saturation.
ETH is holding above key support at $1,755. Caution is advised—buying into an overextended market isn't ideal. A pullback toward $1,755 or $1,690 may offer better entry points if bullish signals appear.
The trend stays intact above the 50-SMA, with potential to reach $1,950. However, a drop below $1,565 could shift the bias to bearish, eyeing $1,470 and $1,370 next.

ETH Tests The $1,623 Level as SupportFenzoFx—ETH rebounded at the $1,623 support level, indicating potential for an uptrend toward $1,755.
If ETH/USD drops below $1,623, it may test the 50-period SMA near $1,600, aligned with the 50% Fibonacci retracement.
>>> No Deposit Bonus
>>> %100 Deposit Bonus
>>> Forex Analysis Contest
All at FenzoFx Decentralized Forex Broker


Ethereum Trades Sideways Testing Critical Support FenzoFx—Ethereum trades sideways, unable to surpass $1,690 resistance. Currently, it hovers at $1,565, testing this level as support.
The bearish trend persists below $1,755. Stabilization under $1,565 may lead to dips toward $1,470 and potentially $1,370 if selling pressure increases.
>>> No Deposit Bonus
>>> %100 Deposit Bonus
>>> Forex Analysis Contest
All at F enzo F x Decentralized Forex Broker

Short-term trade for ETHEREUM with RR of 1:2.6Short term trade for ETHEREUM with RR of 1:2.6
Following the recovery from the recent dip, this is a short-term trade.
Entry: $1,640
Stop Loss: $1,632
Take profit: $1,660
Trade with care

ETHUSDT BUYEthereum buy signal on M15 Timeframe, Bullish triangle resistance was succesfully broken. Now bullish target is 1689 level. Risk reward 1/3

Warning: Low Ethereum Target LoomsThe Unthinkable Target: Is $1,000 ETH Really in Play?
Suggesting Ethereum could fall back to $1,000 might seem hyperbolic to those who remember its peak near $5,000. However, the crypto market is notorious for its brutal volatility and deep drawdowns. Bitcoin itself has experienced multiple corrections exceeding 80% from its all-time highs throughout its history. While Ethereum has matured significantly, it's not immune to severe market downturns or shifts in narrative dominance.
A $1,000 price target represents a roughly 65-70% decline from prices seen in early-to-mid 2024 (assuming a starting point around $3,000-$3,500) and an approximate 80% drop from its all-time high. While drastic, such a move could become plausible under a confluence of negative circumstances:
1. Severe Macroeconomic Downturn: A deep global recession, coupled with sustained high interest rates or a major credit event, could trigger a massive risk-off wave across all assets, hitting speculative investments like crypto particularly hard.
2. Regulatory Crackdown: Punitive regulations targeting DeFi, staking, or specific aspects of Ethereum's ecosystem could severely damage sentiment and utility.
3. Technological Stagnation or Failure: Major setbacks in Ethereum's scaling roadmap or the discovery of a critical vulnerability could erode confidence.
4. Sustained Loss of Narrative: If competing blockchains definitively capture the dominant narrative for innovation, speed, and cost-effectiveness, ETH could lose its premium valuation.
5. Technical Breakdown: A decisive break below key long-term support levels (like the previous cycle highs around $1,400 or psychological levels like $2,000) could trigger cascading liquidations and stop-loss orders, accelerating the decline towards lower supports, including the $1,000 vicinity which acted as significant resistance/support in previous cycles.
While not a base-case prediction for many, the $1,000 target serves as a stark reminder of the potential downside if the current negative pressures persist and intensify, particularly within a broader bear market context. The factors currently driving ETH's weakness provide fuel for this bearish contemplation.
Reason 1: The Underwhelming Arrival of Spot Ethereum ETFs
Following the monumental success of Spot Bitcoin ETFs in the US, which attracted tens of billions in net inflows within months of launch, expectations were sky-high for their Ethereum counterparts. The narrative was compelling: regulated, accessible vehicles would unlock a floodgate of institutional capital, mirroring Bitcoin's ETF-driven price surge.
However, the reality has been starkly different and deeply disappointing for ETH bulls. Since their launch, Spot Ethereum ETFs have witnessed tepid demand, characterized by weak inflows and, at times, even net outflows. The initial excitement quickly fizzled out, failing to provide the anticipated buying pressure.
Several factors contribute to this underwhelming debut:
• Pre-Launch Regulatory Uncertainty: The SEC's approval process for ETH ETFs was far less certain and more contentious than for Bitcoin. This lingering ambiguity, particularly around Ethereum's classification (commodity vs. security) and the handling of staking, may have made some large institutions cautious.
• Lack of Staking Yield: Unlike holding ETH directly or through certain other investment products, the approved US Spot ETH ETFs do not currently offer holders exposure to staking yields – a core component of Ethereum's tokenomics and a significant draw for long-term investors. This makes the ETF product inherently less attractive compared to direct ownership for yield-seeking capital.
• Existing Exposure Channels: Institutional players interested in Ethereum already had established avenues for gaining exposure, including futures markets (CME ETH futures), Grayscale's Ethereum Trust (ETHE, although less efficient pre-conversion), and direct custody solutions. The incremental demand unlocked by the spot ETFs may have been smaller than anticipated.
• Market Timing and Sentiment: The ETH ETFs launched into a more challenging macroeconomic environment and a period of cooling sentiment in the broader crypto market compared to the Bitcoin ETF launch window. The initial risk-on euphoria had faded, replaced by concerns about inflation, interest rates, and geopolitical tensions.
• "Sell the News" Event: As often happens in markets, the period leading up to the ETF approval saw significant price appreciation. The actual launch may have triggered profit-taking by traders who had bought in anticipation of the event.
The impact of these weak ETF flows is significant. It signals a lack of immediate, large-scale institutional appetite for ETH through this specific channel, removing a key bullish catalyst that many had banked on. It also contributes to negative market sentiment, reinforcing the narrative that Ethereum is currently out of favor compared to Bitcoin or other trending assets. Without this expected wave of ETF-driven buying, the price is more susceptible to selling pressure from other sources.
Reason 2: Derivatives Market Flashing Red - Low Interest, Negative Funding
The derivatives market, particularly perpetual futures, provides crucial insights into trader sentiment and positioning. Two key metrics are currently painting a bearish picture for Ethereum: Open Interest (OI) and Funding Rates.
• Low Open Interest (OI): Open Interest represents the total number of outstanding derivative contracts (longs and shorts) that have not been settled. While OI naturally fluctuates, consistently low OI relative to historical peaks or compared to Bitcoin's OI suggests a lack of strong conviction and reduced speculative interest in Ethereum. When traders are uncertain or bearish, they are less likely to open large, leveraged positions, leading to subdued OI. This indicates that fewer market participants are willing to bet aggressively on ETH's future price direction, especially on the long side.
• Negative Funding Rates: Funding rates are periodic payments exchanged between long and short position holders in perpetual futures contracts. They are designed to keep the futures price tethered to the underlying spot price.
o Positive Funding: When the futures price trades at a premium to spot (contango) and bullish sentiment dominates, longs typically pay shorts. This incentivizes shorting and disincentivizes longing, helping to pull the prices back together.
o Negative Funding: When the futures price trades at a discount to spot (backwardation) and bearish sentiment prevails, shorts pay longs. This indicates a higher demand for short positions (either speculative shorting or hedging long spot holdings). Consistently negative funding rates, as observed for ETH during periods of weakness, are a strong bearish signal. It means traders are actively paying a premium to maintain short exposure, reflecting widespread pessimism about the price outlook.
•
The combination of low Open Interest and negative Funding Rates creates a negative feedback loop. It shows reduced speculative appetite, a dominance of short positioning, and a lack of leveraged longs willing to drive the price higher. While extremely negative funding can sometimes precede a "short squeeze" (where rising prices force shorts to cover, accelerating the rally), the persistent nature of these conditions recently suggests underlying weakness rather than an imminent explosive reversal. This bearish derivatives landscape acts as a significant headwind, absorbing buying pressure and making sustained rallies difficult.
Reason 3: The Relentless Rise of Competing Layer-1s
Ethereum's primary value proposition has long been its status as the dominant, most secure, and most decentralized platform for smart contracts and decentralized applications (DApps). However, its reign is facing its most significant challenge yet from a growing cohort of alternative Layer-1 (L1) blockchains, often dubbed "ETH Killers."
While Ethereum still dominates in terms of Total Value Locked (TVL) in DeFi and overall network value, competing L1s like Solana, Avalanche, Cardano, and newer entrants are rapidly gaining ground in crucial areas of network activity:
• Transaction Throughput and Fees: Many competitors offer significantly higher transaction speeds (transactions per second) and dramatically lower fees compared to Ethereum's mainnet. While Ethereum's Layer-2 scaling solutions aim to address this, the user experience on some alternative L1s can feel faster and cheaper for certain applications, attracting users and developers.
• Active Users and Daily Transactions: Chains like Solana have, at times, surpassed Ethereum in metrics like daily active addresses and transaction counts, particularly fueled by specific niches like meme coins, high-frequency DeFi, or certain NFT projects. This indicates a migration of user activity seeking lower costs or specific functionalities.
• Developer Activity and Ecosystem Growth: While Ethereum retains a vast developer community, alternative L1s are aggressively courting developers with grants, simpler tooling (in some cases), and the allure of building on the "next big thing." This leads to vibrant DApp ecosystems growing outside of Ethereum.
• Technological Differentiation: Competitors often employ different consensus mechanisms (e.g., Proof-of-History, Avalanche Consensus) or architectural designs that offer trade-offs favoring speed or specific use cases over Ethereum's current approach (though Ethereum's roadmap aims to incorporate many advancements).
The impact of this intensifying competition is multifaceted. It fragments liquidity and user attention across multiple platforms. It challenges the narrative of Ethereum's unassailable network effect. Crucially, it reduces the relative demand for ETH itself, which is needed for gas fees and staking on the Ethereum network. If users and developers increasingly opt for alternative platforms, the fundamental demand drivers for ETH weaken, putting downward pressure on its price relative to these competitors and the market overall. Ethereum is no longer the only viable option for building or using decentralized applications, and this increased competition is clearly impacting its market position and price performance.
The Path to Reversal: What Needs to Change for Ethereum?
Despite the current headwinds and the looming shadow of lower price targets, Ethereum is far from dead. It possesses a resilient community, the largest developer base, significant first-mover advantages, and a comprehensive roadmap for future upgrades. However, a sustainable trend reversal requires tangible progress and shifts across several fronts:
1. ETF Flows Must Materialize: The narrative needs to shift from disappointment to tangible success. This requires sustained, significant net inflows into the Spot ETH ETFs, potentially driven by broader institutional adoption, clearer regulatory frameworks globally, or perhaps future ETF iterations that incorporate staking yields (though regulatory hurdles for this are high).
2. Derivatives Sentiment Needs to Flip: Open Interest needs to build substantially, indicating renewed speculative conviction. More importantly, funding rates need to turn consistently positive, signaling a shift towards bullish positioning and leveraged longs re-entering the market.
3. Successful Execution of Ethereum's Roadmap: Continued progress and successful implementation of Ethereum's scaling solutions are paramount. Wider adoption and tangible impact from upgrades like Proto-Danksharding (EIP-4844) reducing Layer-2 fees, and clear progress towards future milestones like Verkle Trees and Statelessness, are needed to demonstrate Ethereum can overcome its scalability challenges and maintain its technological edge.
4. Reigniting Network Activity and Demand: Ethereum needs compelling new applications or upgrades to existing protocols that drive genuine user demand and increase the consumption of ETH for gas. This could come from innovations in DeFi, NFTs, GameFi, decentralized identity, or other unforeseen areas. The narrative needs to shift back towards Ethereum as the primary hub of valuable on-chain activity.
5. Favorable Macroeconomic Conditions: Like all risk assets, Ethereum would benefit significantly from a broader shift towards risk-on sentiment, potentially fueled by central bank easing (lower interest rates), controlled inflation, and stable global growth.
6. A Renewed, Compelling Narrative: Ethereum needs a clear and powerful story that resonates beyond its existing user base. Whether it's focusing on its superior security and decentralization, its role as the foundational "settlement layer" for the digital economy, or a new killer application, a refreshed narrative is needed to recapture investor imagination and justify a premium valuation.
Conclusion: Ethereum at a Critical Juncture
Ethereum's recent price struggles are not arbitrary; they are rooted in tangible factors: the lackluster performance of its spot ETFs, bearish signals from the derivatives market, and the undeniable pressure from faster, cheaper Layer-1 competitors. These elements combine to create an environment where contemplating a fall towards $1,000, while bearish, is a reflection of the significant challenges the network faces.
However, Ethereum's history is one of resilience and adaptation. It has weathered bear markets, technical hurdles, and competitive threats before. The path back to sustained growth and potentially new all-time highs is challenging but not impossible. It hinges on reigniting institutional interest via ETFs, flipping derivatives sentiment, successfully executing its ambitious technological roadmap to counter competitors, and benefiting from a supportive macro environment. Until these positive catalysts materialize convincingly, Ethereum may continue to lag, and the possibility of further downside, even towards the $1,000 mark in a severe downturn, will remain a topic of discussion among market participants navigating the crypto giant's uncertain future.

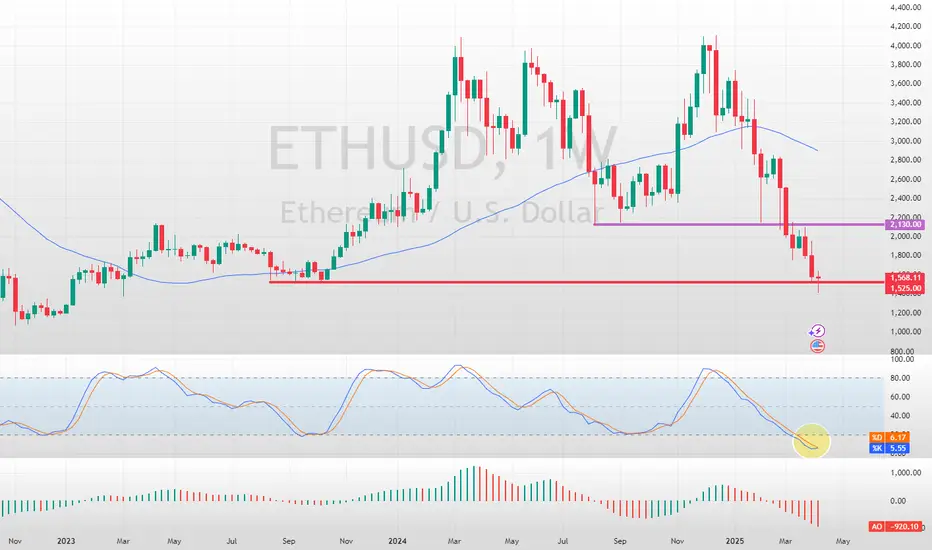
ETH | Ethereum Hits 2 YEAR LOW - What's Next?Could it be that ETH bottoms out here?
Low from March 2023:
Interestingly enough, it could be said that it was the previous cycle's accumulation zone. Considering the previous cycle's price action, this isn't a ad zone to load up - for the longer term.
From here, although the price bounced high, and low, it was the 8-month price action before the next bullish cycle started. This gives us perspective in terms of time
___________________
BINANCE:ETHUSDT

Ethereum is Under PressureFenzoFx—Ethereum has lost 4.5% of its value today, erasing gains from the previous trading day. The immediate resistance level is $1,755, in conjunction with the 50-period SMA. The downtrend will likely resume if this level holds, targeting the previous lower lows at $1,370.
Please note that the bearish outlook should be invalidated if ETH/USD exceeds $1,755. If this scenario unfolds, the price may target $1,950.
>>> Trade ETH/USD swap free at FenzoFx Decentralized Broker.

Ethereum Surges Past Resistance as Trump Halts Tariff Plans..!🚨 **Market Update** 🚨
President Donald Trump has announced a 90-day pause on the full effect of new tariffs for certain countries, and the markets are reacting strongly! 📈 Both the stock and crypto markets are surging as a result.
Right now, Ethereum is testing the $1600 resistance level on the 1-hour timeframe. 💥 Our trading strategy is to let it break the resistance and sustain above it, then look for a solid entry on the pullback.
Stay tuned and trade wisely! 🚀💰

Ethereum - Short Term Sell Trade Update!!!Hi Traders, on April 8th I shared this idea "Ethereum - Expecting Retraces Before Prior Continuation Lower"
I expected retraces and further continuation lower until the two Fibonacci resistance zones hold. You can read the full post using the link above.
The bearish move delivered, as expected!!!
If you enjoy this idea, don’t forget to LIKE 👍, FOLLOW ✅, SHARE 🙌, and COMMENT ✍! Drop your thoughts and charts below to keep the discussion going. Your support helps keep this content free and reach more people! 🚀
-------------------------------------------------------------------------------------------------------------------
Disclosure: I am part of Trade Nation's Influencer program and receive a monthly fee for using their TradingView charts in my analysis.

Ethereum (ETH) Forecast with NEoWave1M Cash Data Chart
Based on the price size of wave-B, it appears that a flat pattern with a regular wave-B is forming. In this pattern, wave -C typically retraces the entirety of wave -B, though a flat with a C-failure may occur at times.
Our primary scenario suggests that wave -C could conclude within the 1000–1200 range, indicating a flat with a C -failure. However, if the price breaks strongly through the 1000–1200 range and consolidates below this level, wave-C might extend to the 700–807 range.

Just In: $CORE Surges 15% Becoming The Top Performing AltcoinAlbeit the bloodbath besieging the crypto market, one asset stood tall defying market odds surging 15% today with about 86.58% increase in 24 hours volume. "CORE" or Satoshi Core is a L1 blockchain that is compatible with Ethereum Virtual Machine (EVM), therefore it can run Ethereum smart contracts and decentralized applications (dApps).
With increased volatility today, MIL:CORE stood different surging 15%. The asset still has room for a continuation trend as hinted by the RSI at 59.
In the case of cool-off, the 38.2% Fibonacci retracement level is a suitable point for consolidation further selling pressure could push it lower to the 1-month low axis. Similarly, should MIL:CORE break above the 1-month high pivot, the $1 resistant will be feasible, therefore, attainable.
Core Price Live Data
The live Core price today is $0.476759 USD with a 24-hour trading volume of $71,813,902 USD. Core is up 13.98% in the last 24 hours, with a live market cap of $476,107,555 USD. It has a circulating supply of 998,633,921 CORE coins and a max. supply of 2,100,000,000 CORE coins.

$ETH why is it cancelled? Things you porobably need to know.There are several reasons why CRYPTOCAP:ETH is being sidelined—some obvious, others you may not have considered. Here's my analysis.
Let’s be clear: something is wrong in this cycle, and the ETF providers are at the heart of the problem.
The famous line, *"there is no second best"*, rings true—because they ensure no one overshadows their main asset: $BTC.
They’ve already tried to destroy crypto outright—really hard—and failed. The elites are 100% devoted to the USD; it’s their lifeblood. Crypto, especially stablecoins like USDT or USDC, became a competitor, and they did everything possible to wreck the market. When direct attacks didn’t work, they turned to a new strategy: controlling it from the inside.
They embraced crypto, and now they’re making billions off crypto enthusiasts who mistakenly believe these players are here for their benefit. This won’t last forever, but that’s a topic for another day.
Now, let’s address why Ethereum is underperforming—and why it’s likely to continue.
### 1. **Corruption in the Proof-of-Stake System**
All PoS systems rely on staking: the more you stake, the more rewards you earn. Typical staking rewards in crypto average about 10% APR, significantly higher than traditional bank interest rates.
But here’s the catch: these rewards are minted, creating inflation because more coins are constantly being dumped into the market. This results in a class of "retired" investors who stake massive amounts, live off their staking rewards, and sell them without ever touching their capital. This creates constant sell pressure on PoS coins.
The Ethereum Foundation controls how much staking is rewarded. Because it’s run by the same people staking, their vested interest is to keep APRs high, even though this fuels inflation. Ironically, Ethereum’s inflation rivals the USD—a troubling reality for a crypto meant to outperform traditional finance.
### 2. **Ethereum’s Ripple Effect on the Market**
Most altcoins rely on Solidity smart contracts, meaning Ethereum’s performance directly impacts the broader altcoin market. When Ethereum underperforms, it drags down Layer 2 solutions, DeFi projects, and the entire altcoin ecosystem.
Knowing this, why did ETF providers rush to approve ETH ETFs? Simple: *“There is no second best.”*
By taming Ethereum, ETF providers manipulate the market to keep Bitcoin afloat, cancel bear markets, and kill any chance of an altseason. On-chain data shows their strategy: when they buy Bitcoin, they sell Ethereum. This frustrates altcoin holders, pushing them to dump their bags and pivot toward—guess what—Bitcoin.
### 3. **The ETF Trojan Horse**
Ethereum, with its corrupt foundation, is the perfect tool for entities like BlackRock to maintain Bitcoin dominance. By doing so, they effectively prevent bear markets and suppress altseasons.
But this strategy has an endpoint. ETFs will milk the crypto space for as much profit as possible. Once they’ve extracted enough, they’ll dump their holdings, funneling all that capital back into USD. This has been their plan all along.
When that happens, the crypto market—including Bitcoin—will crash. Ethereum’s role has essentially been to funnel cash into Bitcoin, making it easier for institutions to accumulate wealth before transferring it all back into USD.
---
In short, Ethereum is being used as a tool in the ETF providers' larger scheme. It’s not about creating a thriving ecosystem but about maintaining dominance, controlling markets, and ultimately cashing out into the USD.

Ethereum - Expecting Retraces Before Prior Continuation LowerH1 - Bearish trend pattern in the form of lower highs, lower lows structure.
Strong bearish momentum
Lower lows on the moving averages of the MACD indicator.
Expecting retraces and further continuation lower until the two Fibonacci resistance zones hold.
If you enjoy this idea, don’t forget to LIKE 👍, FOLLOW ✅, SHARE 🙌, and COMMENT ✍! Drop your thoughts and charts below to keep the discussion going. Your support helps keep this content free and reach more people! 🚀
--------------------------------------------------------------------------------------------------------------------
Disclosure: I am part of Trade Nation's Influencer program and receive a monthly fee for using their TradingView charts in my analysis.

Ethereum Tests Critical Support LevelFenzoFx—Ethereum tests the critical support level at $1,525. A consolidation wave toward $2,130 could be imminent.
ETHUSDT – Eyes on the Green Line!ETHUSDT – Eyes on the Green Line!
“Momentum is building, and all signs point to the next key level—the green line is in play!”
🔥 Key Insights:
✅ Trend Remains Strong – No reason to fade the move.
✅ Green Line = Next Target – That’s where liquidity & reactions will matter.
✅ Pullbacks = Buying Opportunities – No FOMO, we wait for strategic entries.
💡 The Smart Plan:
Look for Dips to Load Up – Volume & CDV should confirm strength.
LTF Breakouts = Strong Entry Signals – Follow structure, not emotions.
Green Line = First Major Resistance – Expect reactions, manage risk accordingly.
“If momentum holds, Ethereum is headed straight for the green line—watch closely!” 🚀🔥
A tiny part of my runners;
💼 STMXUSDT: 2 Buying Areas
🐢 TURBOUSDT: Buy Zones and Buyer Presence
🌍 ICPUSDT.P: Massive Upside Potential | Check the Trade Update For Seeing Results
🟠 IDEXUSDT: Spot Buy Area | %26 Profit if You Trade with MSB
📌 USUALUSDT: Buyers Are Active + %70 Profit in Total
🌟 FORTHUSDT: Sniper Entry +%26 Reaction
🐳 QKCUSDT: Sniper Entry +%57 Reaction
