Ethereum Climbing Stairs.Ethereum - Intraday - We look to Buy at 1461 (stop at 1409)
Our short term bias remains positive.
There is no clear indication that the upward move is coming to an end.
Bespoke support is located at 1450.
20 4hour EMA is at 1430.
We look for gains to be extended today.
Our profit targets will be 1584 and 1624
Resistance: 1600 / 1630 / 1700
Support: 1500 / 1450 / 1400
Ethereumlong

ETHUSD - The Lowest the MACD Has Ever BeenThe MACD on ETHUSD has reached its lowest point ever on the weekly timeframe by a long shot
Price is also testing the top of the Gaussian Channel on the Monthly timeframe (right)
I have been adding ETH at these levels

ETH: Intraday bulls lurking!Ethereum
Intraday - We look to Buy at 1016 (stop at 984)
Levels below 1000 continue to attract buyers. We look to buy dips. 1013 has been pivotal. 996 has been pivotal. Bespoke support is located at 1000.
Our profit targets will be 1098 and 1128
Resistance: 1100 / 1180 / 1300
Support: 1050 / 1000 / 950
Please be advised that the information presented on TradingView is provided to Vantage (‘Vantage Global Limited’, ‘we’) by a third-party provider (‘Signal Centre’) . Please be reminded that you are solely responsible for the trading decisions on your account. There is a very high degree of risk involved in trading. Any information and/or content is intended entirely for research, educational and informational purposes only and does not constitute investment or consultation advice or investment strategy. The information is not tailored to the investment needs of any specific person and therefore does not involve a consideration of any of the investment objectives, financial situation or needs of any viewer that may receive it. Kindly also note that past performance is not a reliable indicator of future results. Actual results may differ materially from those anticipated in forward-looking or past performance statements. We assume no liability as to the accuracy or completeness of any of the information and/or content provided herein and the Company cannot be held responsible for any omission, mistake nor for any loss or damage including without limitation to any loss of profit which may arise from reliance on any information supplied by Signal Centre.

Ethereum potential move to upside ⬆️Potential long trade for Ethereum has alerted.
Trading the 30M chart.
I have set my stop loss at the last low and will follow this trade to the next alert.
Green POW emblem shows the candle entered upon.
This is a trend following trade.
For extra confluence there is a area of resistance that if broken would add to validating the trade.
Last sell trade can be seen on chart and how that was followed.
Thanks for looking at my idea
Darren👍

Ethereum posting higher lows? Ethereum
Intraday
We look to Buy at 1151 (stop at 1114)
Short term bias has turned positive. We look to buy dips. 20 4 hour EMA is at 1143. Bespoke support is located at 1150.
Our profit targets will be 1248 and 1278
Resistance: 1200 / 1250 / 1280
Support: 1150 / 1100 / 1050
Disclaimer – Saxo Bank Group. Please be reminded – you alone are responsible for your trading – both gains and losses. There is a very high degree of risk involved in trading. The technical analysis, like any and all indicators, strategies, columns, articles and other features accessible on/though this site (including those from Signal Centre) are for informational purposes only and should not be construed as investment advice by you. Such technical analysis are believed to be obtained from sources believed to be reliable, but not warrant their respective completeness or accuracy, or warrant any results from the use of the information. Your use of the technical analysis, as would also your use of any and all mentioned indicators, strategies, columns, articles and all other features, is entirely at your own risk and it is your sole responsibility to evaluate the accuracy, completeness and usefulness (including suitability) of the information. You should assess the risk of any trade with your financial adviser and make your own independent decision(s) regarding any tradable products which may be the subject matter of the technical analysis or any of the said indicators, strategies, columns, articles and all other features.
Please also be reminded that if despite the above, any of the said technical analysis (or any of the said indicators, strategies, columns, articles and other features accessible on/through this site) is found to be advisory or a recommendation; and not merely informational in nature, the same is in any event provided with the intention of being for general circulation and availability only. As such it is not intended to and does not form part of any offer or recommendation directed at you specifically, or have any regard to the investment objectives, financial situation or needs of yourself or any other specific person. Before committing to a trade or investment therefore, please seek advice from a financial or other professional adviser regarding the suitability of the product for you and (where available) read the relevant product offer/description documents, including the risk disclosures. If you do not wish to seek such financial advice, please still exercise your mind and consider carefully whether the product is suitable for you because you alone remain responsible for your trading – both gains and losses.

Ethereum buy the trend line support.Ethereum - Intraday - We look to Buy at 1084 (stop at 1046)
Short term bias has turned positive.
Trend line support is located at 1080.
We look to buy dips.
Our profit targets will be 1179 and 1199
Resistance: 1200 / 1280 / 1400
Support: 1100 / 1050 / 1000

ETHUSD - Bull Faith Update 3A comparison between early 2017 ETH and current price formation
Similar bottom patterns can be seen
I assume the early 2017 case is a more volatile situation due to age
A sharp recovery is still valid if this comparison is however
My third update to the bull faith cases rest are below

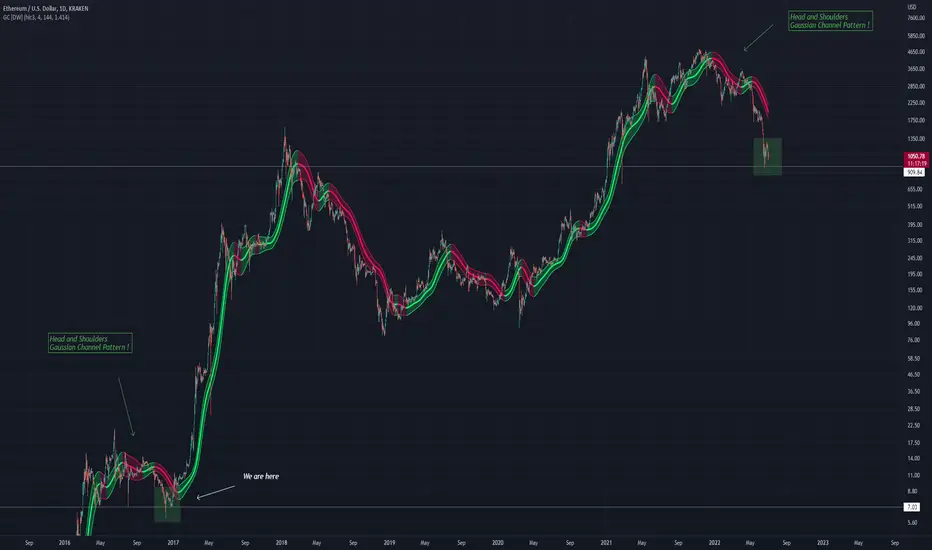
ETHUSD - Bull Faith Update 2 Using this channel indicator a clear comparison can be made between the two periods, forming a kind of a H&S pattern with the channel itself
The ending of the pattern includes a steep fall which we have just experienced on ETH
The reversal will be sharp if this is the bottom as it was in the first scenario
Above is the bull faith 1 analysis
ETH Buy a break setup.Ethereum - Intraday - We look to Buy a break of 1271 (stop at 1219)
Short term momentum is bullish.
We are trading at oversold extremes.
A higher correction is expected.
We look for a temporary move higher.
Our profit targets will be 1396 and 1436
Resistance: 1280 / 1400 / 1500
Support: 1170 / 1100 / 1050

ETH: A break and we are off?!Ethereum
Intraday - We look to Buy a break of 1181 (stop at 1139)
A break of the recent high at 1174 should result in a further move higher. 50 4hour EMA is at 1175. Short term momentum is bullish.
Our profit targets will be 1288 and 1318
Resistance: 1170 / 1200 / 1250
Support: 1100 / 1050 / 1000
Please be advised that the information presented on TradingView is provided to Vantage (‘Vantage Global Limited’, ‘we’) by a third-party provider (‘Signal Centre’) . Please be reminded that you are solely responsible for the trading decisions on your account. There is a very high degree of risk involved in trading. Any information and/or content is intended entirely for research, educational and informational purposes only and does not constitute investment or consultation advice or investment strategy. The information is not tailored to the investment needs of any specific person and therefore does not involve a consideration of any of the investment objectives, financial situation or needs of any viewer that may receive it. Kindly also note that past performance is not a reliable indicator of future results. Actual results may differ materially from those anticipated in forward-looking or past performance statements. We assume no liability as to the accuracy or completeness of any of the information and/or content provided herein and the Company cannot be held responsible for any omission, mistake nor for any loss or damage including without limitation to any loss of profit which may arise from reliance on any information supplied by Signal Centre.

ETH SHORTETH SHORT!! using ote of todays range and the imbalance we are currently in ill be building into my short, keeping sl above high with room for spread.
Our target is the h1 fvg 984 but look to take some off at the low marked 1017

ETHUSD Trend AnalysisAccumulate around 600-800 levels for a potential target of around 7500-8300 in long term.
You can either exit or keep averaging if it falls below the mentioned levels.
Even though the probability is high but nothing is guaranteed in cryptoverse, so do proper risk management.
Peace!!

ETHUSD - Bull Faith UpdateEthereum has undergone some extreme downsides in the past weeks
I'm comparing in this analysis these downsides to a previous price structure on ETH, they are similar just on a little bit different scale
Both are broadening wedges, and have shown to form as the 200MA is curling down
Will we see another up wave like was seen in 2017? Will it be comparable in future?

Ethereum- Relief rally probable nextNot even a month ago (in fact 3 weeks) I said that 2k should provide strong resistance for EthUsd and traders should sell rallies in that zone. Since then Eth has dropped hard, losing almost 50% of its value, which is a lot even for the crypto market.
On Tuesday EthUsd dropped towards 1k and reversed and, again, yesterday it had a new attempt to drop under 1k and failed, leaving a long-tailed bullish Pin Bar on our chart.
This sequence of reversals from around 1k gives me the idea that bulls are strong here and a reversal could follow soon.
My strategy is to buy dips against 1k and as for target, around 1.5 can be a good idea.

Long ETHGiven the divergence of the Bitcoin chart and the divergence in the RSI indicator and the lack of a specific price node up to $ 2,000, the probability of a price return to $ 2,000 is very high.

#ETH / $ETH Quick Update#ETH Quick Update
In 4H TF Ethereum forming a Bull Flag
Support zone is so strong and old.
Let's see if it can retest the next resistance zone ($1727 - $1754)


ETH to 2700?Descending wedge ready for a breakout? Measured move upwards to test the 200 SMA? Which also happens to be the .618 profit zone? Confluence? Could be in the cards. Look out for the red Ichimoku Cloud!

ETHUSD - RSI AnalysisAn idea for ETHUSD
I expect the next bottom to form along the 200MA, which correlates well with the 200MA (green)
Areas in yellow are strong bullish entry points
The bottom point falls along these diagonal downtrend lines as does the top point
There seems also with the current top formation to be a large divergence on the RSI

ETHUSD Long Term Bull Pivot PointThe horizontal trend line shows clear points of support
Currently price is forming a support again around this area
The bull run will continue if this support is held

About 30% with nice RR - long ETHBut on Ethereum, most likely, the minimum will be updated. I don’t expect a deep dive, there is very little room for maneuver in this calculation

ETHUSD Middle Band TestPlotting an up channel using the middle trend as a top point for similar areas on ETHUSD chart
Similar points are in white rectangles
We are still going to the moon

Ethereum LongHey traders, in today's trading session we are monitoring Ethereum for a buying opportunity around 1800 zone, once we will receive any bullish confirmation the trade will be executed.
Trade safe, Joe.
