Ethereumlong

ethereum clean technical analysis current clean impulsive move to the upside recently, price has formed a symmetrical triangle,
price has been corrective after reaching all time highs and is currently testing a resistance level
neutral outlook on price action here as price can still continue to break above the highs and confirm support at the previous resistance before and impulsive continuation to the upside.
there is also a possibility that price break below the current pattern and make a move to the downside after confirmation and move to the downside testing previous support levels again !!!

Ethereum, wait for the perfect entry point ! ETHUSD is correcting to visit the long support uptrend line, which is at the same time simultaneously a daily 0.50 Fibonacci level I prefer you guys to wait when the price meets these two lines to enter a long position.
good luck :)

Aggressive MACD's (LINK and ETH) Some 'aggressive' MACD structures
Very bullish on this weekly timeframe for both ETH and LINK
The MACD rise is near vertical


Ethereum Will Test Previous Reaction High Between $2550-2650 Ethereum will pullback to around $2550 to test previous reaction high before moving higher. See chart for previous reaction high confirmations and what's to follow. Make sure to reload (buy, buy, buy) when it pulls back and confirms previous reaction high.

ETHUSD CORRECTION + ENTRY LEVELS - LONGIf you want to jump in, wait for it. The graph does not look healthy. I reduced my position on top, and I will buy around $3080 if we go there.

ETH Ready To Steal The Show Again? - UPDATEThis is an updated cleaner chart to my original ETH post on 4/3/2021. A weekly close above this historical resistance would be very good this weekend.
Click the link/chart for the original post:
Remember, be patient, stay level-headed, non-biased, and ahead of the crowd.

ETHEREUM All-Time Highs Tight Flag!! ETH with a Bullish flag consolidating at all-time highs. Beautiful 5ema ride & respect with great 50ema backtest printing a nice inside day with a consolidation candle. I have alerts set for a bid over 3,530 with a 1 hour close on expanding volume. Great 5ema respect and bounce, every tag since April 26 2021 have reacted with a support trendline. We’re currently 290 pips extended from the orange 5ema in this ATH consolidation. An entry for me will be a 1 hour close over level 3,530 previous highs and new resistance and close/at the 5ema in a new 1-hour candle. Since the 5ema has proven itself as trendline support with 10 candles closes above, the stop-loss would be 15-30 pips below the 5ema. TP would be into the 1.618 fib extension level. Will be updating as we go. Sharing humbling my POV and will gladly discuss with anyone if we agree or disagree, I'm a Full-time Life & Market student, always learning! Best regards and Happy Trading! Keep it simple 😉

ETH Buy a break setup.ETHUSDT - Intraday - We look to Buy a break of 3504 (stop at 3399)
Price action resulted in a new all-time high at 3485.
A break of bespoke resistance at 3500, and the move higher is already underway.
The continuation higher in prices through resistance has been impressive with strong momentum and shows no signs of slowing.
We look for gains to be extended today.
We can see no technical reason for a change of trend.
Trading volume is increasing.
Our profit targets will be 3798 and 3978
Resistance: 3500 / 3600 / 3700
Support: 3400 / 3300 / 3200

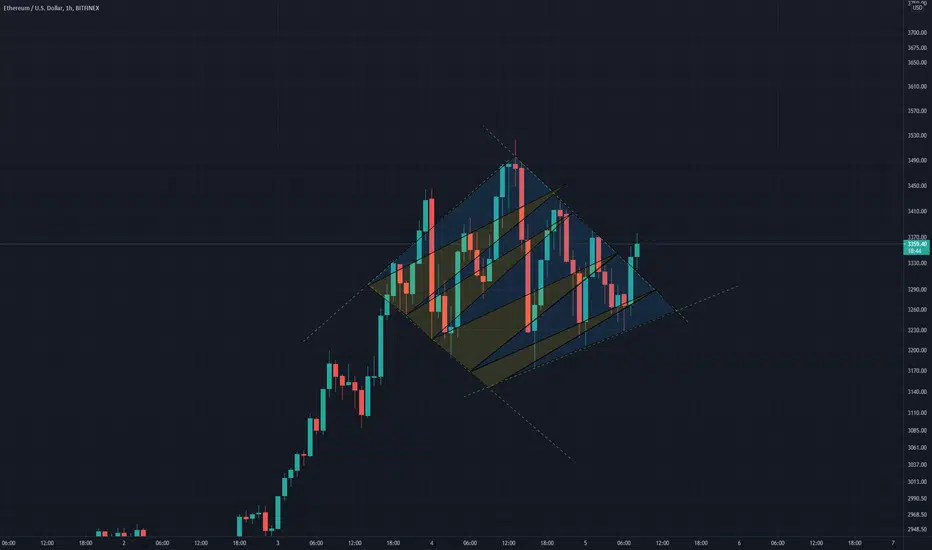
Diamond Breakout PatternETH hourly chart
Can see a clear diamond form with the price action
Added some cool mosaic type
Breakout is now
Ethereum price explodes to historical high close to $3,500Ethereum launched to another colossal milestone after striking price levels beyond $3,000. The gigantic smart contract token rallied as Bitcoin failed to rise above $60,000. The lift above $3,000 paved the way for gains that closed the gap toward $3,500.
In the meantime, ETH trades at $3,250 after losing some ground from the all-time high. The correction has occurred in tandem with Bitcoin’s retreat to $55,000 from price levels close to $60,000.
Higher support is required to keep the bears at bay and allow bulls to focus on price levels above $3,500 and $4,000, respectively. The Moving Average Convergence Divergence (MACD) suggests that Ethereum is firmly in the bulls’ hands.
For instance, the MACD line (blue) continues to sustain the position above the signal line. Although the MACD line does not identify overbought and oversold conditions, it foresees the general trend of an asset while measuring its momentum.
On the flip side, the Relative Strength Index (RSI) suggests that Ethereum is fast flipping bearish. For example, the trend strength indicator drops sharply from the overbought area, implying that bears control. If the technical outlook is unchanged in the short term, sellers will have the upper hand.
Ethereum’s co-founder, Vitalik Buterin, has made it the list of the world’s youngest cryptocurrency billionaires. The 27-year-old programmer’s crypto holding soared to higher levels as Ethereum price hit new record highs.
Ethereum intraday levels
Spot rate: $3,250
Trend: Bearish
Volatility: High
Resistance $3,460 and $3,500
Support: $3,200 and $3,000

Ethereum $ETHUSD PT 5,000-5,200 and higherEther is excelling while the bitcoin sideshow is barely making gains. BNB breaks out on DeFi, going past $100 billion in market capitalization Monday.
Ether (ETH) trading around $3,290 as of 21:00 UTC (4 p.m. ET). Gaining 10.7% over the previous 24 hours.
Ether’s 24-hour range: $2,941-$3,300 (CoinDesk 20)
Ether well above the 10-hour and the 50-hour moving averages on the hourly chart, a bullish signal for market technicians.
Ether was trading around $3,290 as of 21:00 UTC (4:00 p.m. ET), gaining more than 10% over the prior 24 hours. The second-largest cryptocurrency by market capitalization is the crypto story for Monday because the asset hit a fresh record high of $3,300 around 18:15 UTC (2:15 p.m. ET), according to CoinGecko.
“Ether has accelerated to new highs, reaching the targeted level of ~$3,000 from its April breakout far sooner than indicated,” noted technical analyst Katie Stockton, in Fairlead Strategies’ Monday market update. “It is not wise to fight momentum, so we are reassuming a bullish near-term bias, somewhat reluctantly.”
Momentum, in the form of ether spot exchange volume, is clearly high. Ether volume tallied $35 billion Sunday, with bitcoin just a bit higher at $39 billion. Together, the two assets changed over $74 billion in value Sunday – and that’s on a weekend day. Traders will be eyeing volume for the rest of the business week to see where the price settles, particularly with ether continually hitting fresh levels on the spot market.
Meanwhile, over $20 billion in locked value inside decentralized finance, or DeFi, has been gained in the last month, according to data aggregator DeFi Pulse. The value of ether, combined with traders looking for yield that exists for parking crypto in DeFi, is a fundamentally bullish sign for the Ethereum network overall.
“ETH has been powering for the past two years on the booming DeFi industry with a total value locked above $70 billion,” noted Elie Le Rest, partner at quantitative trading fund ExoAlpha. Le Rest also mentioned to CoinDesk the ambitious ecosystem upgrade Ethereum 2.0 as part of the catalyst for traders to punch buy on ETH. “Despite the high fees experienced by the Ethereum network, the market is starting to reflect the anticipated growth of ETH 2.0 into the price of ETH.”
The ether futures market is hitting brand-new levels not seen before, pushing open interest up to $8.8 billion and topping the previous record of $8.4 billion reached April 15, according to analytics provider Skew.
“I bet the launch of ETH futures has increased the comfort level of the massive asset managers that have sent U.S. stock market capitalization north of 200% of GDP and global bond yields negative,” said George Clayton, managing partner at investment firm Cryptanalysis Capital. ”I think ETH is acting like an institutional platform.”


ETHUSD ideaSome major trendlines from the inception of the Ether coin
Bull continuation is likely
Its like an expanding wedge since the start

Ethereum on it's way to 2900 ?Should hold 2165 and must not close below 2132. Current support / resistance levels as marked. Note that trend lines also act as support / resistance. Not expecting it go up in straight line but if it does, won't feel bad ;)

Chart ETHBTC shows the superiority Eth of BitThis chart shows that ETH is growing faster than Bitcoin, and I strongly recommend that you consider Ethereum. The first goal of it is to reach $ 3,000.

#eth 3Days ATHETH hit ATH
maybe can have a temporary sale on this resistance
if breakdown 12% can back to $2500 support
if open and close @2850 eth can hit to 4k+ soon with 50% profit

Ethereum price rally intensifies toward $3,000Ethereum has continually led the price action this week, especially in the top ten cryptocurrencies. The pioneer smart contract token hit support at $2,000 twice last week before bulls focused on gains toward $3,000. Support at $2,000 was particularly vital to the upswing, which saw Ethereum hit highs above $2,700 and later brushed shoulders at $2,800.
Ethereum relentless fight for $3,000
At the time of writing, Ethereum teeters at $2,750 as bulls concentrate on revisiting the hurdle at $2,800. However, sideways price action seems to be taking precedence based on the Relative Strength Index (RSI). The trend strength indicator levels 63 after the uptrend fizzled out before hitting the overbought.
This current situation is not bad for Ethereum bulls because it shows that the token is overbought. In other words, buyers still have ample room for growth. Therefore, holding above higher support, perhaps at $2,700, will ensure that bulls don’t lose focus from the near-term target at $2,800. Note that trading above this crucial level would trigger massive gains as investors stream in to take a piece of the likely breakout at $3,000.
It is worth mentioning that the Moving Average Convergence Divergence (MACD) has a bearish impulse. This follows the MACD line crossing under the signal line. If the divergence expands in the upcoming sessions, overhead pressure will rise, forcing Ether to test the tentative support at $2,700. Other critical anchor zones to keep in mind include $2,600, the 100 Simple Moving Average (SMA), and the 200 SMA.
Etheruem intraday levels
Spot rate: $2,750
Trend: Sideways
Volatility: Low
Support: $2,700, $2,600 and $2,400
Resistance: $2,800

Ethereum Discovery ModeEthereum, 20k?
This 4.618 ring will be smashed through just as 1.618 was
I recently added Ethereum, it has massive potential, even from here.

ETH reaching $3000I was previously long on ETh and i still believe it. ETH is in ascending channel but before moving further may need correction. If bulls manage to break the resistance line of ascending channel then there is chance of meeting the $3000 price for ETH.
If direction reverses and break EMA then it may drop to support line of ascending channel.

