Ethereumlong

Ethereum Strength, MACDEthereum is showing a lot of strength on the MACD vs BTC which has just undertaken a bearish cross on the weekly MACD
If there was any time for a flippening this would be the time for it
HODL your ETH!!

ETH pivotal at $2,500 but is $3,000 achievable?
Ethereum brushes shoulders with $2,500 but loses momentum.
Support at $2,400 remains key to the uptrend, while gains above $2,600 could bolster Ether past $3,000.
The MACD reinforces the bullish outlook, suggesting that the uptrend is intact.
Ethereum tested support at $2,000 during the broad-based declines in the cryptocurrency market last week. Support at the 200 Simple Moving Average (SMA) on the four-hour chart and $2,200 played a crucial role in ensuring that the recovery is steady.
On Monday, bulls increased the grip on the price by breaking above the 50 SMA and 100 SMA. As the technical levels improved, Ether closed the gap heading to $2,500. A brief break above this level saw bulls shift their attention toward the recent record high of $2,600.
However, selling pressure is becoming apparent as resistance at $2,500 remains unshaken. ETH trades marginally under $2,500 amid the intense tug of war.
The Relative Strength Index (RSI) shows that bears could emerge stronger, sabotaging the breakout toward $2,600 and $3,000, respectively. A bearish divergence from the price seems to reinforce the bearish outlook. Unless the RSI break above the trend line and enters the overbought region, overhead pressure will rise in the near term.
Moreover, a real break past $2,500 would allow bulls to focus on gaining ground past $2,600. Trading above this level would also trigger massive buy orders as the uptrend builds toward $3,000.
It is worth mentioning that the Moving Average Convergence Divergence (MACD) has a bullish impulse. The MACD line increases the divergence from the signal line while the indicator holds within the positive region. If this technical outlook holds, Ethereum will settle above $2,500, setting the framework for gains eyeing $3,000.
Ethereum intraday levels
Spot rate: $2,502
Trend: pivotal at $2,500
Volatility: Low
Support: $2,400, $2,200 and $2,000
Resistance: $2,600

Ethereum chart review Still wait for Ethereum to get back to 45000. Although current pattern can be a bull flag that will lead to breakout above 48200 to 54000-55000. resistance. Hard to see it flying higher without proper retracement.

Ethereum 4 HourBreak up into the upperside of the formation
Great long entry at these levels, Prior price action suggests big moves upwards
Added more the other day
This is the 4 Hour chart for Ethereum

Ethereum HourlyIdea for Ethereum
Higher lows, tight range is now
More likely to pop off to bull side


WAIT WAIT IT MUST HIT 1988$ BEFORE HITTING 2800$ AD PER SENARIOTHANKS NOT AN FINANCIAL ADVICE FOR ENTERTAINMENT PURPOSES.
WAIT TO FOR ABOVE THE UP LINE OR FOR SHORT WAIT TO CROSS DOWN THE LINES.

ETH Buy the uptrend.ETHUSDT - Intraday - We look to Buy at 2126 (stop at 2049)
Daily signals are bullish.
The primary trend remains bullish.
Trend line support is located at 2120.
Previous resistance, now becomes support at 2150.
We look to buy dips.
Our profit targets will be 2348 and 2438
Resistance: 2300 / 2350 / 2400
Support: 2200 / 2130 / 2050


ETH comes back to life!We've had a nice move off of the target accumulation zone, and now have come back after running into some resistance at 0.33
Looking to load back up once we come back down into this area around the 0.5 retracement and confluence of trendlines, with the ultimate target being the red box.

ETH makes incredible strides toward $2,550 record highs
Ethereum ignores crypto selloff to post considerable single-digit gains toward $2,550.
The MACD and the RSI affirm the bullish outlook in the near term.
Ethereum is among the best-performing digital assets in the cryptocurrency market following the retreat from record highs of $2,550. The pioneer smart contract token tested support at $2,000 twice before staging the ongoing recovery mission.
Several resistance levels have been overcome, including the 100 Simple Moving Average (SMA) at $2,200, the 50 SMA and $2,400. At the time of writing, ETH dances at $2,415 while bulls fight for a breakout past $2,500.
The immediate downside is supported by the 50 SMA, allowing bulls to focus on higher price levels. The bullish outlook has been reinforced by the Moving Average Convergence Divergence (MACD). The confirmation appeared after the MACD line crossed above the signal line, besides the indicator has reentered the positive region.
Consequently, the Relative Strength Index (RSI) on the four-hour chart affirms that the trend is in the bulls’ hands. This indicator follows the movement of an asset and measures its strength. As it closes the gap toward the overbought region, Ethereum’s uptrend becomes apparent.
A break above $2,500 would be a significant signal for more buyers to join the market. If enough buying pressure is created behind ETH, the price will begin the next chapter of the run to new all-time highs around $3,000.
It is worth mentioning that closing the under $2,500 would lead to an increase in overhead pressure. Besides, the position above the 50 SMA must be sustained; otherwise, Ethereum may freefall to retest support at $2,200 and $2,000, respectively.
Ethereum intraday levels
Spot rate: $2,415
Trend: High
Volatility: High
Support: 50 SMA, $2,200 and $2,000
Resistance: $2,500 and $2,550

After few days of cooling off, Ehereum looks ready to move up!First resistance overhead resistance trend line. Then depending on how long it takes to close above previous high, next target can be estimated

ETH.D To IncreaseEthereum dominance is looking to increase after hitting the bottom of the expanding wedge formation
We are looking for a right shoulder to form from this upward move, confirming the larger head and shoulders pattern within this wedge
Personally I think this will be the move to break this wedge formation, but if not the right shoulder will occur.
Included other chart patterns within this larger wedge, (falling wedge, symmetrical triangle)
I am long Ethereum

ETH tumbles to $2,000 as losses to $2,000 linger
Ethereum rejected at the 50 SMA on the four-hour chart.
Ether bulls battle to secure immediate support at $2,000, highlighted by the 100 SMA.
The least resistance path is south, but support at $2,000 may bring back market stability.
Ethereum bounced off support at $2,000 amid the weekend session declines. Bulls fought around the clock to reclaim most of the ground to $2,500, but the uptrend stalled under the 50 Simple Moving Average (SMA) on the four-hour chart. Recovery became a challenging task, allowing bears to swing into action.
Ethereum technical levels worsen
The four-hour chart suggests that the short-term technical levels have weakened in the last 24 hours. The Moving Average Convergence Divergence (MACD) indicator failed to secure the ground within the positive region. The slide into the negative territory is a massive bearish signal. The gravitational force is accentuated by the MACD line (blue) crossing under the signal line. As the signal line’s divergence widens, the bearish grip gets more vigorous.
In the meantime, Ethereum trades around $2,100 amid increasing overhead pressure due to the 100 SMA at $2,200. Losses to $2,000 beckon amid the bearish picture. The 200 SMA is in line to offer support; however, if lost, declines may extend to the next anchor zone at $1,800.
It is worth keeping in mind that if support at $2,000 holds, a rebound such as Sunday may occur. Reclaiming the ground above the 50 SMA could trigger massive buy orders as investors speculate the rise to $2,500.
Ethereum intraday levels
Spot rate: $2,095
Trend: Bearish
Volatility: High
Support: 200 SMA and $1,800
Resistance. The 100 SMA and 50 SMA on the four-hour chart

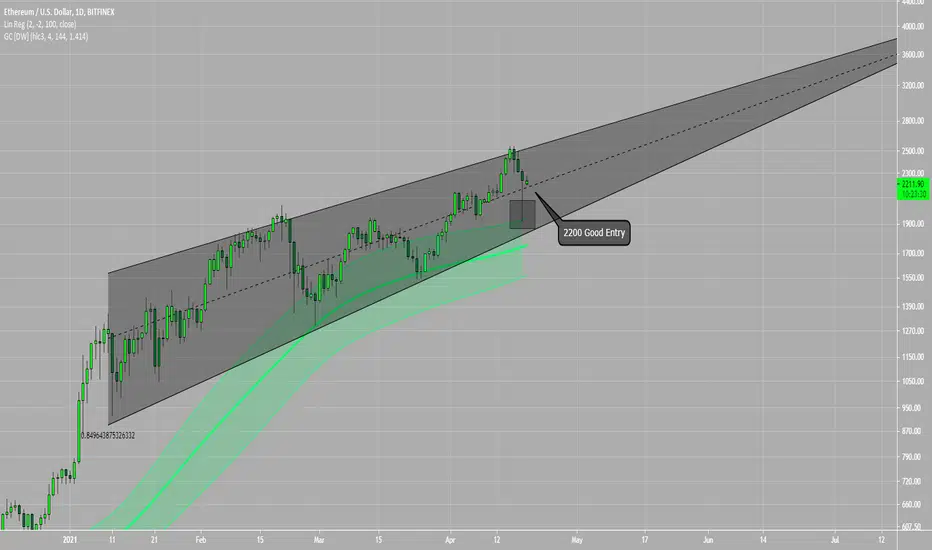
Ethereum Linear Regression DailyWith a strong R value of 0.85, this is a strong linear regression trend
I find 2200 a nice entry point, just above the middle of the regression trend (for traders)
Ethereum price looks very healthy, with a wick extending to the top of the Gaussian Channel
Weekly ETH looks just as good
Digital Diamonds !
MACD fakeouts Ethereum and LINK for examples
The MACD can be seen to attempt a reversal but is overcome by bullish momentum
An observation
I am long ETH and LINK


ETH free money levelsLiterally if you longed any of these you'd be a rich MOFO. I only noticed these after 1777, made good profits since then
2222 hasnt been touched yet btw
I dont consider 2333 being touched either
Long any of these for free profits
100x only tho - dont be a pussy.

Likely breakout 50% Fibonacci line support, relatively oversold, and hoping for a small dip to breakout.

ETH 2k$ to 3k$ easy if we got the entry. Maybe on Sundayr dumpETH if we got a good entry at 2k$ I would long to 3k$ .
Good +50% , if not good entry I will pass I think.
There are bigger profit possibilities with other smaller cap altcoins. Like Link , Uni

Ethereum $ETHUSD Long Term target PTs 2990-3740-4500-8000Ether and altcoins
Ether (ETH) trading around $2,334.94 as of 20:00 UTC (4 p.m. ET). Climbing 1.49% over the previous 24 hours.
Ether’s 24-hour range: $2,268.57-$2,399.61 (CoinDesk 20)
Ether trades between its 10-hour and 50-hour averages on the hourly chart, a sideways signal for market technicians.
Ether, along with many other alternative cryptocurrencies (“altcoins”), also logged more gains on Wednesday.
Besides ether, which is the No. 2 cryptocurrency by market capitalization, one of the most staggering growth spurts was seen with dogecoin (DOGE), the beloved meme cryptocurrency that was created back in 2013.
As a result, dogecoin now has a market capitalization of more than $16 billion, surpassing that of bitcoin cash (BCH) and chainlink (LINK), per Messari data.
Dogecoin’s sudden price surge also came with escalating trading activity: data from Coingecko also shows that dogecoin is the No. 5 most traded token of the day, only behind tether (USDT), bitcoin (BTC), ether (ETH), and xrp (XRP).

ETH-USDT Bullish Pennant on the 4 hr: Breakout ImminentEthereum is the future. If you are not in yet then hear me now... GET INTO ETHEREUM. Heavily. I firmly believe 40-60 percent of your cryptocurrency portfolio should be in ethereum alone. Now onward to the analaysis...
I made this chart cleaner and easier to read than normal. It's a classic bull pennant, with massive upside potential. If we use the previous rise's trajectory, then we land on april 14th for our peak of $2500-2600.
HOWEVER, I also acknowledge that Eth and cryptos as a whole have been consistently gaining and are very high up there on the other indicators (MACD, RSI, etc). With that being said... If you buy in now or buy in on the next dip.. set your stop loss just below the right tip of the pennant if you are on to play it super tight... or set your stop loss right below where the bottom line of the pennant connects to the pole if you want to play it more loose. In the long term, ETH will be worth 10-25x what it is right now. So if you are NOT on margin or leverage of any sort, then DO NOT SET A STOP LOSS for ETH. Only set SLs if you have someone else's money involved in your play. If you are a spot trader only, then this play WILL come to fruition, the only thing we do not know for sure is how long it will take and how severe any corrections along the way will be.
Happy hunting!
