ETH SMALL AND MID TERM POSITIONin this scenario we can buy in this triggered point, in small term we can take profit in tp1 and in mid term we can take profit in tp2.
Ethereumlong

ETH reaching for new record highs above $3,000
Ethereum bulls' persistent push for new all-time highs yields after breaking $2,300.
Ether's path with the least hurdles is north, as confirmed by the MACD on the four-hour chart.
Closing the day above $2,300 could allow bulls to focus on $3,000.
Ethereum has been keen on joining the ongoing bull cycle. Initially, it was an uphill task to reclaim the ground above $2,000, but bulls never lost focus. Support at $2,200 confirmed the market stability, allowing buyers to glance at higher price levels. Meanwhile, ETH dodders at $2,320 amid the roll to another new record high.
Ethereum gains ground as $3,000 beckons
At the time of writing, the least resistance path is upward, as reinforced by the Moving Average Convergence Divergence (MACD). This indicator is nether exclusively bullish or bearish biased. However, it identifies positions where traders can buy the dip or sell the top. Moreover, the MACD foresees the asset's general trend and measures the momentum.
A MACD line (blue) crossing above the signal line implies that traders should be buying more or holding in anticipation of growth. On the other hand, crossing underneath the signal line hints at the trend flipping bearish.
In the meantime, the MACD emphasizes that Ethereum is comfortably in the bulls' hands. As the divergence from the signal line expands, the bullish momentum strengthens. Note that crossing above the $2,500 would be a significant milestone for Ethereum and may trigger massive buy orders toward $3,000.
Ethereum intraday levels
Spot rate: $2,333
Trend: Bullish
Volatility: Expanding
Support: $2,200 and $2,100 and $1,900
Resistance: Undetermined

Ethereum $ETHUSD PT 2495 and higher Ethereum Hub ConsenSys Raises $65M From JPMorgan, Mastercard, UBS, Others
Ethereum’s biggest supporter is back on track with the close of a carefully constructed funding round.
ConsenSys, an Ethereum development operation headquartered in Brooklyn, N.Y., has raised $65 million from financial institutions JPMorgan, Mastercard and UBS, as well as leading firms in the decentralized finance (DeFi) space.
Having toughed it out through the crypto winter of 2018-19, Tuesday’s bullish fundraising announcement is further evidence ConsenSys has found its footing. The firm has now been successfully restructured into two parts: a core software business (CSI) and an investment and incubation arm known as ConsenSys Mesh.
In addition to the big banks, the $65 million round included Filecoin’s Protocol Labs, DeFi’s Maker Foundation, Fenbushi, The LAO, Sam Bankman-Fried’s Alameda Research, CMT Digital, China’s Greater Bay Area Homeland Development Fund, Quotidian Ventures and Liberty City Ventures.
Several firms invested with Ethereum-based stablecoins, DAI and USDC, ConsenSys said in a statement.
Last year, ConsenSys brokered a deal with JPMorgan to acquire Quorum, the enterprise-focused Ethereum client that now forms an in-house software stack of Codefi, Diligence, Infura, MetaMask and Truffle.
The general tightening of the ship has seen ConsenSys appear to chart a course away from consulting and services, towards being more product- and revenue-focused. MetaMask – a key gateway to the world of DeFi – counts over 3 million monthly active users and ConsenSys earns a sliver of fees on the wallet’s $1.95 billion token swap feature.
Founder and CEO Joe Lubin said ConsenSys was always a product company – only it was embedded in an ecosystem, and dependent on a technology that was extremely immature.
Today things have moved on some. For example, with Mastercard as an investor, ConsenSys engineers are using the Quorum blockchain to build a permissioned network for commerce and finance.
“The round was pretty carefully constructed,” Lubin said in an interview. “It’s almost all strategics, and we intended for them to be in different industries. Some in the traditional economy, some in the decentralized economy, and we also intended for it to be regionally distributed.”
The ConsenSys chief could not go into detail at this time about what was being built with the large financial institutions that invested in the round, but said:
“We have multi-year commercial arrangements with JPMorgan and Mastercard, and have commercial activity with UBS.”
ConsenSys roadmap
Looking ahead, Quorum’s enterprise-friendly connection to Ethereum mainnet will have managed services launched around it. Also driving the theme of convergence, MetaMask Institutional, which is in beta, will roll out soon.
“MetaSwaps, launched first into the consumer platform, is providing swap trading capabilities for nearly the entire universe of active tokens,” said Lubin. “We can take that next, wrap it in APIs and make it available to developers in both Infura and in Truffle, so developers can build swapping directly into their software. You can also package it up into a module and enable trading on Quorum systems, say, on a cloud.”
As such, ConsenSys is positioned to build the infrastructure needed to make institutional DeFi a reality.
With this in mind, Lubin pointed to the Baseline Protocol, a way of enabling organizations to link their systems of record to one another using a global frame of reference: the Ethereum mainnet.
“Tokenization is happening in the Baseline Protocol, so you can pay for inventory with tokens,” Lubin said. “Invoices on some projects right now are starting to get tokenized. So you can imagine factoring invoices and trading those and in markets. It’s happening relatively quickly.”

Ethereum m00nEthereum has broken above 1.618 fib level within the circle
It also seemed to form a flag and has broken up out of that
This is the weekly chart
I expect it to outperform BTC

Ethereum chart review Ethereum back below red line and formed a top with two fractals at 36095. Following hours should be crucial to show the near future direction. If manage to hold above 36000 ~ another breakout attempt possible. If close below it, next drop may take it to ~34700 or even lower to ~ 34000.


ETH Macro PatternETH Bull flag breakout on macro time frame. Safe trade would be to buy the breakout of the key fibonacci level overhead and take some profits out before we hit the 1.618 fib level (~$2,535) because we won't break through on the first try. There will probably be a rejection and some consolidation before we can reach the final target of ~$2,713

ETH Buy a break setup.ETHUSDT - Intraday - We look to Buy a break of 2041.8 (stop at 1994.4)
The primary trend remains bullish.
Pivot resistance is at 2040.
A break of bespoke resistance at 2040, and the move higher is already underway.
20 4hour EMA is at 2032.
Expect trading to remain mixed and volatile.
Our profit targets will be 2178.4 and 2222.4
Resistance: 2040.0 / 2080.0 / 2150.0
Support: 1980.0 / 1930.0 / 1880.0

ETH bound for $2,500 despite the struggle sustaining uptrend
Ethereum holds at the key ascending parallel channel's middle boundary support.
Holding above the 50 SMA on the four-hour chart could validate the gains to a new record high.
Losing the immediate support at $2,000 could trigger losses toward $1,800.
Ethereum led other altcoins to stage a recovery this week. For the first time in history, the gigantic smart contract token hit highs of $2,146. However, a correction occurred almost immediately, with Ether plunging to $1,930. Intriguingly, buyers wasted no time and took the bull by the horns. The hiccup to $1,930 was quickly erased as ETH reclaimed the ground above $2,000.
At the time of writing, Ethereum is doddering at $2,075 amid the bulls' push to hit new record highs. The immediate downside is supported by the 50 Simple Moving Average (SMA) on the four-hour chart. Simultaneously, the downside is also protected by the ascending channel's middle boundary support.
Ethereum's uptrend might be gradual but appears to have been reinforced by the Moving Average Convergence Divergence (MACD) indicator. This technical indicator reveals when to long or short an asset. As the MACD line (blue) crosses above the signal line, it implies it is time to buy-in. On the flip side, investors are advised to sell when the MACD line slides under the signal line.
It is worth keeping in mind that failure to close the day above the 50 SMA may see overhead pressure rise. Moreover, a break below the channel's middle boundary and, by extension, the level at $2,000 would trigger massive sell orders, leaving Ethereum to tumble toward $1,800.
Ethereum intraday levels
Spot rate: $2,075
Trend: Bullish
Volatility: Low
Support: $50 SMA and $2,000
Resistance: $2,100 and $2,146

Ethereum chart review Ethereum failed to breakout bull flag last time which resulted in bull fart. That red line is 2018 year close and 2019 open. The higher timeframe the bigger money are watching the level. So this is very important zone and crucial for ETH to reclaim if we talk about any bullishness. Rejection will push it to support zones below at 34500 and 33800.

Ethereum price holds key technical pattern support
Ethereum bulls defend ascending channel's middle boundary support on the daily chart.
Price action past $2,000 may trigger massive buy orders as $2,500 beckons.
The MACD shows that the uptrend is not secured and declines will likely come into the picture.
Ethereum has been on an upward role since the beginning of March, as observed on the daily chart. The pioneer altcoin rose from the lows traded at $1,292 toward the end of February and reclaimed the position above $2,000 in April's first week.
A new record high was also achieved at $2,146 (on Coinbase) before the correction on Wednesday came into the picture. Attempts to defend the support at $2,000 were thwarted by increased overhead pressure, which affected most digital assets, including Bitcoin. The flagship cryptocurrency extended the bearish leg to $56,000 before finding stability.
At the time of writing, Ether teeters at $1,987 while holding onto the immediate support provided by the ascending channel's middle boundary on the daily chart. If this support remains intact, Ether will likely gain market stability, allowing bulls to focus on stepping above $2,000.
The least resistance path appears upward based on the applied moving averages. The 50-day Simple Moving Average (SMA) maintains a gap above the longer-term 100 SMA and the 200 SMA to show that the trend still favors the bulls.
On the downside, it is worth mentioning that the Moving Average Convergence Divergence (MACD) has a bearish impulse. This shows that the expected uptrend is in jeopardy and ETH may resume the downtrend, especially if the MACD line crosses under the signal line. Other support levels have been highlighted at $1,800 and $1,600 if declines extend.
Ethereum intraday levels
Spot rate: $1,995
Trend: Bullish
Volatility: Low
Support: $1,800 and $1,600
Resistance: $2,000 and $2,146

We hold ETH positionWe recently wrote a post about when we plan to open a position on ETH.
Everything went according to our scenario. You could buy in the green zone as well as on the breakout
Now you need to hold the position.
Stop loss: We would recommend closing the position if the day closes below the green zone.
TP: Otherwise, you need to keep the position until the goals are achieved. 0.039, 0.044. and 0.05

Will ETHEREUM on the daily chart progress in that region?Technical analysis regarding the price of ETHEREUM in relation of dollar Tether for the next scenarios, based on daily movement.
Very strong region ~observe the POC (red line) and the price tag marked on the chart~, where there is a huge financial volume concentrated in the daily ETH/USDT. The price can go to test this region, and if it does, it is a good entry point. However, the price is gaining buying mass, if you look at the MACD histogram.
disclaimer
*** In accordance with CVM Instruction No. 598, of May 3, 2018, Art. 21, I declare that the recommendations of this analysis reflect solely and exclusively my personal opinions and perceptions and that they were prepared independently and autonomously. Not being considered a purchase and/or sale recommendation. ***
Any questions do not hesitate to contact me. I'm happy to be able to help you in the best way I can. 🙏

Ethereum to move even higher.The gains were capped at $2151 so far. As the gains were rejected at this level, the price managed to find continuous support at psychological support of $2000 per Ethereum.
Ethereum is now being traded in a tight range from $2000 to $2150 and break of each of these levels will lead to increased momentum. We can consider this tight range as a flag.
As the overall trend is a strong uptrend and no bearish divergence or any other bearish signs aren’t present, a break of $2150 is more likely to happen instead of a breakdown below $2000, however it’s still possible.
Resistance levels are located at:
$2150
$2300
$2440
$2570
These levels are based on $1000 resistance levels as we don’t have any info about where is resistance above $2000.
Indicators.
RSI is talking about bullish momentum being present as it’s above 60 with no bearish divergences, correction signals to be found.
MACD is in an average buying wave and the bullish momentum seems to start falter.
The overall trend based on EMA’s is a strong uptrend as the price is located above 20 EMA. However the price is not ready yet to move higher as 20 EMA is bit far from the price. Surely the price can move higher, but Ethereum is rather conservative and waits for EMA support often.
Support levels
Trend of higher lows is located at $1650
Trend line support is located at $1650
EMA support is at $1900 and $1750.
The conclusion is that Ethereum will be moving sideways for a while until 20 EMA catches up and then move to $2300.

ETH, Ethereum - new entry point!As I said before, ETH made a new ATH! But in my opinion, it happened so fast. Right now I wait to retest a key level and false breakout. That's where I'll be buying.
Write in the comments all your questions and instruments analysis of which you want to see.
Friends, push the like button, write a comment, and share with your mates - that would be the best THANK YOU.
P.S. I personally will open entry if the price will show it according to my strategy.
Always make your analysis before a trade

ETH daily very good buyEthereum channel
sitting right above the middle
I think bullish momentum will push it higher
daily chart

Ethereum Possible Profit AreasIn blue and green triangle are suggested profit areas during this bull move on the weekly
Lets stay above 2K!

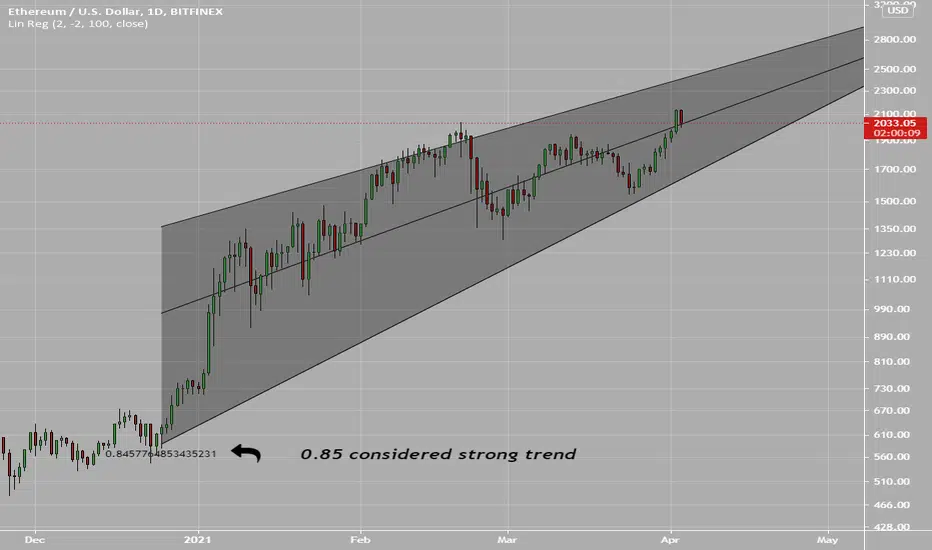
Ethereum Linear RegressionStrong uptrend
R value of 0.85
I hope the middle line holds, up continuation is favored
Ethereum chart review Ethereum is just went up to the sky. Last lower high at daily is at 0.035281 ~ getting above it will put an end to all doubts anyone may have left.

ETH/BTC ratio will determine what to be overweight/underweight ETH/BTC ratio is still consolidating after having a lower bound range breakout... previous price moves from these ratio levels have been significant and we should continue to keep an eye on the ETH/BTC chart to see if the ETH to BTC price continues the bullish breakout after a multi-year consolidation... I am personally bullish on both Bitcoin and Ethereum, but monitoring this ratio has helped me better allocate whether to be overweight/underweight BTC or ETH, especially during the bull cycle... I will update this idea as the price ratio decides the direction

Ethereum chart review This is the beginning of great uptrend. As I have told before, at green support you must have bought at the bottom. If you haven't bought there have limit orders waiting at 310-317 zone. If there will be re-test of broken SR buying dips there is a must.

ETH edges closer to $2,000 as crypto market uptrend renews
Ethereum restores the uptrend toward $2,000 after embracing support at $1,800.
ETH bulls look forward to price action past $2,000, which may trigger more buy orders.
A potential double-top pattern could sabotage the upswing, allowing a correction toward $1,550.
Ethereum managed to close the day above $1,800, confirming to investors that market stability was intact. A rebound was staged from this short-term support, with Ether stepping above $1,900. At the time of writing, the pioneer flagship cryptocurrency is doddering at $1,920 amid a bullish building momentum.
The four-hour chart shows that Ether is in the bulls' hands based on the Moving Average Convergence Divergence (MACD). This vital technical indicator follows the trend of an asset and measures its momentum.
A step into the positive region (above the mean line) is viewed as the asset flipping bullish. The bullish outlook is validated by the MACD line (blue) crossing above the signal line. At the time of writing, the MACD line increases the divergence, further cementing the bull's presence in the market.
Ethereum bulls must purposely close the day above $1,900 to avert any significant potential correction from the prevailing price levels. Moreover, higher support would allow bulls to focus on cracking the major hurdle at $2,000. Note that trading past this crucial could be yield tremendously for Ethereum due to the massive buy orders that are likely to be triggered.
Looking at the other side of the picture
The same four-hour chart shows that Ethereum is trading near a double-top pattern. This is a highly bearish pattern. If validated, ETH may breakdown massively, erasing most of the gains made since the beginning of the week. Note that, Ethereum may seek support at $1,800, $1,600 and the primary anchor at $1,550.
Ethereum intraday levels
Spot rate: $1,920
Trend: Bullish
Volatility: High
Support: $1,800 and $1,700
Resistance: $2,000

ETHEREUM in the increasingly ascending diaryTechnical analysis regarding the price of ETHEREUM in relation of dollar Tether for the next scenarios, based on daily movement.
disclaimer
*** In accordance with CVM Instruction No. 598, of May 3, 2018, Art. 21, I declare that the recommendations of this analysis reflect solely and exclusively my personal opinions and perceptions and that they were prepared independently and autonomously. Not being considered a purchase and/or sale recommendation. ***
Any questions do not hesitate to contact me. I'm happy to be able to help you in the best way I can. 🙏
