2021 Outlook - Ethereum (ETH)Sharing my forecast
Best estimate
The best estimate ETH Price I'm looking at is $$3,501.73 using Compounded Annual Growth Rate (CAGR) or 2.618 fib level.
Computed as: 2020 Closing Price x ( 1 + CAGR)
= $737.80 x ( 1+ 374.62%) = $3,501.73
Conservative estimate
That's the height of the triangle and put that at breakout, and that's approximately $1,931 or that's fib 1.382 area.
Worst estimate
Worst case scenario, I'm looking at previous low of $100.
Risk reward ratio seems attractive at 4.33.
Disclaimer: Trading and investing have risk. DYOR. Trade Cautiously.
Ethereumlong

Complex Spirals ETHETHUSD idea
Intersecting points in red can be seen to show bearish moves when reached, respecting the spiral
Primed above the spirals moving average, ready for bullish movement
Kinda like my previous ETH analysis but I felt it needed some fine tuning
Very bullish outlook for the future

Ethereum and LINK comparisonComparison between ETH and link
I believe Link is forming a secondary structure as the base for the next bull move, just like ETH has done when the 50MA emerged.
Great opportunity to enter into LINK

Ethereum still bullish!!! At the moment, looking this chart we see that Ethereum still bullish in Daily specifically.
So guys, at the moment, putting any short position it's not be reccomend because the trend it's your friend and many people have problem to know it.
As we see that Ethreum formed a bearish rising wedge in H4, notice that we can't to entry short for what we think, did you know, based in our plans becuase if we see any short position, Ethereum need to break down the the $690 USD to consider a short position toward the $622 and $585 USD targets to consider any short position
The only update it's to change the break even at $695 USD

Ethereum in ascending triangle! Ethereum is currently in an ascending triangle which has bias to break to the upside.
A break of $750 will confirm the bullish outlook.
Trend line support is located at $720.
You can either buy the uptrend, or buy the break of $750, or just use this analysis as informative where the price is headed next!
Thanks for your time,
Tibor

Ether's path to ATHEthereums path to ATH using fib circles
The apex is where two circles meet and can be seen as an area of influence
Used the fib circles to identify the strongest trend both up and down
From this we can see where the areas meet

ETH USDT Potential Breakout As seen on the graph. Using both Ichimoku and EMA 10 and 20 crossovers we can see the chart is looking very bullish.
Additionally, potential 'W' forming - with Fib retracement levels showing ETH reaching potentially 880 USDT.
Long after confirmation of breakout with an hourly candle closing above the 744 level marked.


ETHUSDT (Broadening Wedge Breakout)#ETHUSDT Technical Analysis Update
Broadening Wedge Breakout
ETH/USDT currently trading at $26600
LONG ENTRY level: $615 TO $625
STOP LOSS: Below $600
Resistance level 1( Target 1): $642
Resistance level 2( Target 2): 670
Max Leverage: 4X
ALWAYS KEEP STOP LOSS...
Follow our Tradingview Account for more Technical Analysis Update, | Like, Share and Comment your thoughts.

ETHBTC - Present Day: Bottom of Cycle, Beginning of RunETHBTC is in the gutter.. But the good news is it can't get much worse!
During 2020, we saw a pattern of when ETHBTC topped within its growth channel.
The 1st gap was 150D
The 2nd gap was 200D (1st gap x 1.33)
The 3rd looks to be.. 267D (2nd gap x 1.33) -- WOWOWOW
As we look to see when this next top will happen, we assume that ETHBTC is currently near the very bottom of the growth channel.
It's been stuck in a downward slope for a little bit, but we can determine the bounce angle for that downward to slope to determine the trajectory of the bounce.
From that, I just fit a growth curve to hit each of the previous low candles. Wouldn't you know it, it makes another W. It's like it's a pattern or something.
Even though BTCUSD faces a price correction, and ETHUSD will probably follow with it.. this is a good mid-term buying opportunity.
Ethereum has hit plenty of ATH's in usage rate metrics this year, its ETHBTC has been suppressed while BTCUSD has seen gains of 20% past its previous ATH.
It's only a matter of time before we start seeing some massive gains for Ethereum itself.
I think a .06-.07 ETHBTC by Memorial Day is conservative.. with Bitcoin forecasts pointing to ~$30K by then, we'll be looking at $2K ETH by Memorial Day.
Weather this storm and reap the bennies later, time to begin accumulating again!
Don't listen to me. I'm an idiot sandwich. #notfinancialadvice.
EK69420

Eth - Double Golden Cross BombShellEthereum is preparing for the 50MA and 100MA to move above the 200MA
A golden cross is generally considered a weak buy signal. But two?
With the rise of DeFi and Vitalik, and finance changing ever so rapidly, this could blow up
Lets go!

Eth Channel AnalysisFurther emphasis on the importance on going long on ETH. Not to mention ETH futures.
Price goes ballistic above the channel
This indicator is called "gaussian channel" and you can find it in the public library.
Heres a shorter timeframe of the channel

Ethereum BetBet on the breakout to the upside above this observed channel formed.
Longer term thoughts form ETH attached

Ethereum - Daily UpdateBottom Line: Bullish against 310.95.
Key Levels: Below 370.83, 310.95, 315.36 Above 488.12
Outlook: Expecting ETH to recapture its 488.12 high and beyond.
Analysis: The break above 460.02 signals the fourth wave triangle consolidation discussed yesterday is complete, and the further move above 468.42 today puts Ether back on track to challenge the next upside hurdle at 488.12. The bulls are in control while 441.16 stays intact as support.

Ethereum following Bitcoin Bull Circus next buy chance $650 $638I'll keep it short. Unless Ethereum takes no break and just continues to climb,
Possible buy opportunities for Ethereum is at around $650 and $638.
Make sure to set your stop loss orders not to lose any money or sit there being forced to HODL.

ETHUSDT (Waiting for the resistance zone breakout)#ETHUSDT Technical Analysis Update
Ascending Triangle breakout
ETH/USDT currently trading at $620
LONG ENTRY level: above $625( only enter after 1 h candle close above $625)
STOP LOSS: below 575
Resistance level 1( Target 1): $660
Resistance level 2 (Target 2 ): $750
Max Leverage: 3X
ALWAYS KEEP STOP LOSS...
Follow our Tradingview Account for more Technical Analysis Update, | Like, Share and Comment your thoughts

ETHEREUM Still BullishFew patterns identified on the chart
Divided the sections of this bull run into two main channels

ETHEREUM - Intraday Update - 12/09/20 (Short-term)ETHEREUM - Intraday Update - 12/09/20 (Short-term)
Outlook : Expecting ETHEREUM to recapture its $637.90 high and beyond. Breaking above $595.50 is the next upside objective for the bulls. (Fist a Bullish Evidence)
Analysis : The break above $637.90 signals the second wave consolidation is complete, and the move puts ETHEREUM back on track to challenge the next upside hurdle. The bulls are in control while $480 - Wave ii - stays intact as support.
Bottom Line : A third wave rally is in its early stages. Subdividing higher within wave iii of (iii)
Note : Prices can vary between ETHEREUM exchanges. Consequently, there may be differences in our chart prices due to different data sets. Our analysis is for information only. We recommend that people avoid trading on unproven exchanges vulnerable to hacking and theft.

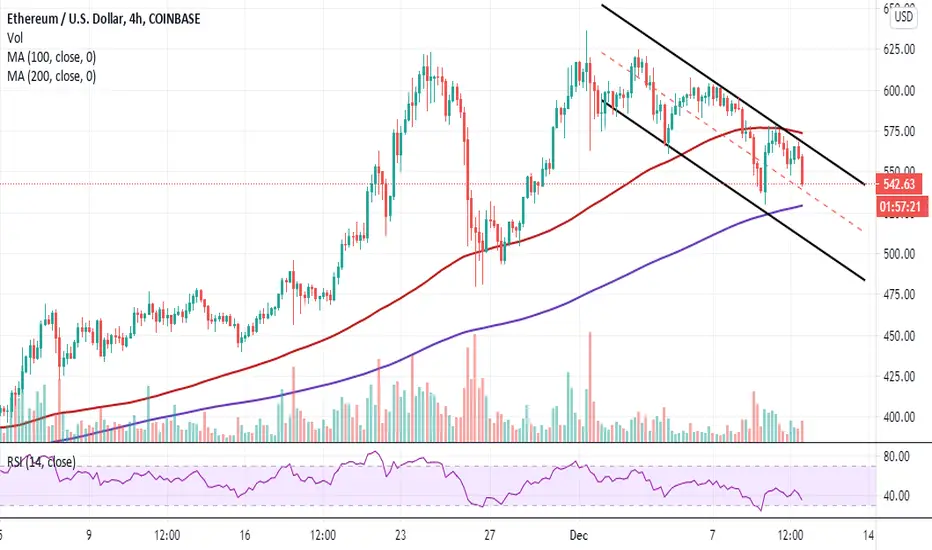
Ethereum seems to be going back to the drawing board
Ethereum is on the verge of a breakdown to $500, mostly if the support at $540 fails to hold.
The bearish outlook will be abandoned if Ether closed the day above $540 and perhaps reclaimed the ground past $560.
Ethereum is in the middle of a retreat that could soon touch $500 following a failed attempt to recover to $600. The flagship altcoin is teetering at $545 amid fresh declines from the recent rejection at $580. Ether might complete the bearish leg to $500 if a crucial support area is depressed.
Meanwhile, the descending channel’s middle boundary on the 4-hour chart seems to be holding the fort, allowing bulls to flex their muscles. This zone, in conjunction with the immediate support at $540, must hold to ensure that potential losses to $500 are averted.
The downtrend momentum appears to have been validated by the Relative Strength Index, especially now that the indicator is dropping fast towards the oversold area. An increasing volume suggests that the bearish pressure would be felt more because massive sell orders are likely to come into the picture if ETH breaks below the above-mentioned support levels.
The 200 SMA at $530 recently functioned as a key barrier and is likely to do the same. However, if declines stretch past the zone, the next tentative buyer congestion zone is at $500. For now, the least resistance path is downwards until Ether embraces robust support, strong enough to support a rebound.
It is worth noting that, the bearish outlook will be invalidated if Ethereum defends the immediate support area. Upward price action might push ETH above the channel’s upper boundary. Trading beyond $560 is likely to encourage more buyers to join the market, thereby pulling the price to $600.
Ethereum intraday level
Spot rate: $544
Relative change: -14
Percentage change: -2.5%
Trend: Bearish
Volatility: Expanding
ETHEUR Impulse observation(2) up
(1) down
Pair of scallops.
This is not a forecast just an observation.
Right now I am concerned about the disconnect crypto seems to have from SPX and others.
Everything seems to be bullish in the crypto world (well, mostly)
Its hard to call what this disconnect will lead to.
However im just expressing my thoughts, of course.


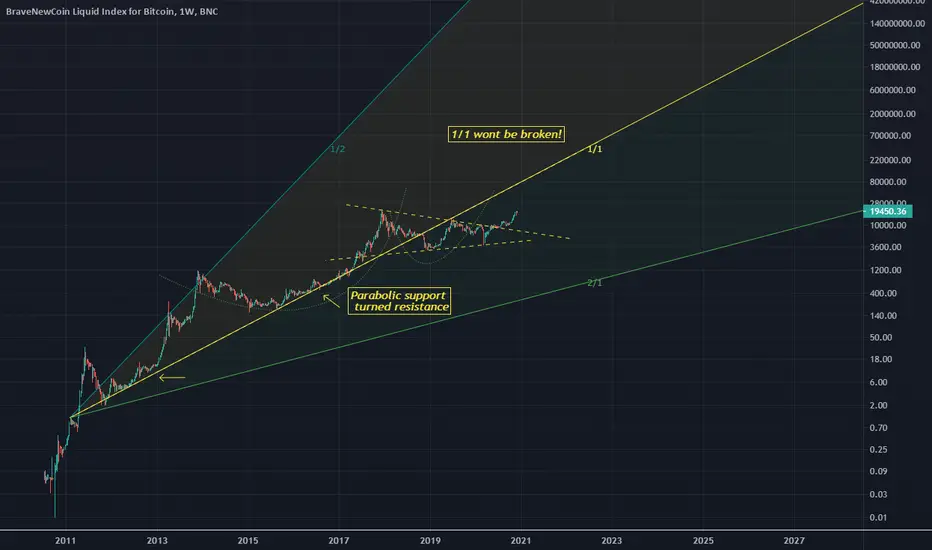
ETH > BitcoinMy rational thought behind a bearish bitcoin scenario vs Ethereum long.
As you can see you 1/1 line has been broken.
A support (along the 1/1) (indicated with yellow arrow) is now resistance (1/1)
Scalability is everything.
I have linked a more detailed version of this here
Bixley
ETHUSD (ETHEREUM) Cup and Handle Pattern#ETHUSDT Technical Analysis Update
Wait for the Cup and Handle Pattern Breakout
ETH/USDT currently trading at $616
LONG ENTRY: ONLY ENTER LONG AFTER THE CUP AND HANDLE PATTERN BREAKOUT IN 4HOUR CHART
STOP LOSS: I will update stop loss once I see the Break out in 4 h chart
Resistance level 1( Target): $730
Resistance level 2 (Target): $830
Max Leverage: 4X
ALWAYS KEEP STOP LOSS...
Follow our Tradingview Account for more Technical Analysis Update, | Like, Share and Comment your thoughts
