ETHUSDT LONG Setup!!ETHUSDT (1h Chart) Technical analysis
ETHUSDT (1h Chart) Currently trading at $1638
Buy level: Above $1640
Stop loss: Below $1582
TP1: $1662
TP2: $1681
TP3: $1780
TP4: $1850
Max Leverage 3x
Always keep Stop loss
Follow Our Tradingview Account for More Technical Analysis Updates, | Like, Share and Comment Your thoughts
Ethereumlong

#Ethereum - Thoughts out loud #5Good afternoon, dear colleagues!
I am pleased to welcome everyone who wishes to familiarize themselves with my vision of the current situation on this instrument.
I propose to consider a possible deal, but this is only my vision of the situation.
Dear colleagues, I sincerely thank you all for your attention and wish you all success!
And remember one thing:
"sometimes you win, sometimes you learn".

Ethereum (ETH) formed a bullish Gartley | A good buy opportunityHi dear friends , hope you are well and welcome to the new trade setup of Ethereum coin.
Previously after crossing the 1st target the price moved down:
Now on a daily time frame, Ethereum with BTC pair has formed a bullish Gartley move for another pump.
Note: Above idea is for educational purpose only. It is advised to diversify and strictly follow the stop loss, and don't get stuck with trade

ETH/USDT >> LONG SETUPLONG ETH/USDT
ENTRY AT : 1216
TP1 : 1345
TP2 :1499
tp3 : 1678
SL : CLOSE BELOW 1071
NOTE : 🚨 Not financial advice 🚨
The content provided on this channel is not a manual for any financial activity.
It's only represents my personal market and financial view.
Once TP1 reached stop should be moved to BE

Ethereum ETH will pump more!Hello, crypto brothers and sisters!
Today is the great day for Ethereum bulls becuase it’s about to show us much more gains. Of course this potential pump is gonna be the huge trap like on Bitcoin. But here we have huge difference. On the BTC we have complex correction and wave C should not obligatory go higher than wave A. In case of ETH we have the zigzag correction and current wave will break $2000 .
Let’s take a look the 1D time frame of the WHITEBIT:ETHUSDT chart. Wave A was the impulsive one. I am not going to consider it in details, you can just trust me. Earlier I supposed that wave A is actually the wave 4, but it wav the mistake becuase the wave B is very ugly and does not look like the impulsive one. Therefore I have made an assumption that the wave C is happening right now.
Obviously ETH has already finished the waves 1 and 2 and we have the question: has the wave 3 been finished. Price reached the minimal target, but taking into account that the wave C should be very high I consider that wave 3 is gonna be extended one. The $1867 now is my nearest target for this asset. After the followed correcive wave 4 I expect the wave 5 and huge crash after that. Because there are a lot of liquidity below.
In my opinion Ethereum has not finished it’s bear market, but now it’s a very dangerous idea to open both long and shorts and my plan for ETH now is waiting for the wave 3 end and buy at the bottom of the wave 4. I will make an update when take some action on this crypto asset.
Best regards, Ivan
________________________________________________________________________________________________
If you like my trade ideas, please smash the boost button to stimulate me make more quality analytics!

#Ethereum - thoughts out loud #4 Good afternoon, dear colleagues!
I am glad to welcome everyone and wish you to get acquainted with my vision of the current situation on this instrument.
I expect purchases to resume in the price range of 1455-1475.
If the instrument shows weakness, I expect further depreciation of the instrument to the price of 1414.
The price has come to a strong resistance level. We are watching the continuation and making successful decisions
Dear colleagues, I sincerely thank you all for your attention and wish success to everyone!
And remember one thing:
"sometimes you win/sometimes you learn"

#Ethereum - thoughts out loud #3 Good afternoon, dear colleagues!
I am glad to welcome everyone and wish you to get acquainted with my vision of the current situation on this instrument.
Frankly speaking, there is no desire to describe the detailed situation, I will leave only a possible entry point. The entry point will work itself out in the presence of a strong buyer.
Dear colleagues, I sincerely thank you all for your attention and wish success to everyone!
And remember one thing:
"sometimes you win/sometimes you learn"

ETHBTC - Broken Above Symetrical Triangle!We've got a significant break upward with ETHBTC at the moment - breaking out of this symetrical triangle it's been trading within for the last few months. With a Long signal from Crypto Tipster v2 last night we're already seeing gains of a few % in just a few hours!
Get your SL in at just under the most recent tradinf range, around 0.071 and watch this rise up to meet the most recent swing high, grabbing around 8 or 9% profit.
If you enjoyed this idea, agree or indeed disagree - drop us a comment, like & follow! :)

Buy signal for EthereumAccording to my free indicator "moving average sequential strat", Ethereum is a buy. Two days ago it fired off a buy signal. If we combine that with the positive price flip of the Fetch Trends, and we have a high probability that the price will go up.
Get both indicators for free, by clicking on my profile.

EthereumHello Traders,
the chart for BINANCE:ETHUSDT is clear. I expect a movement to descending trendline that's acting like a resistance then to drop around 600 $

ETH Pump to $1250 LONG I was incorrect with my last idea, I am still new to trading and am still learning new things.
We tested the 4 hour Order Block and rejected it well, with a Change of Character. It is very likely we will change to short term bullish before making any lows.
I think on the higher time frame there is a symmetrical pattern in play and before making and lows or highs we will test the upper end of it.
I am personally trading this with risk management, NFA.

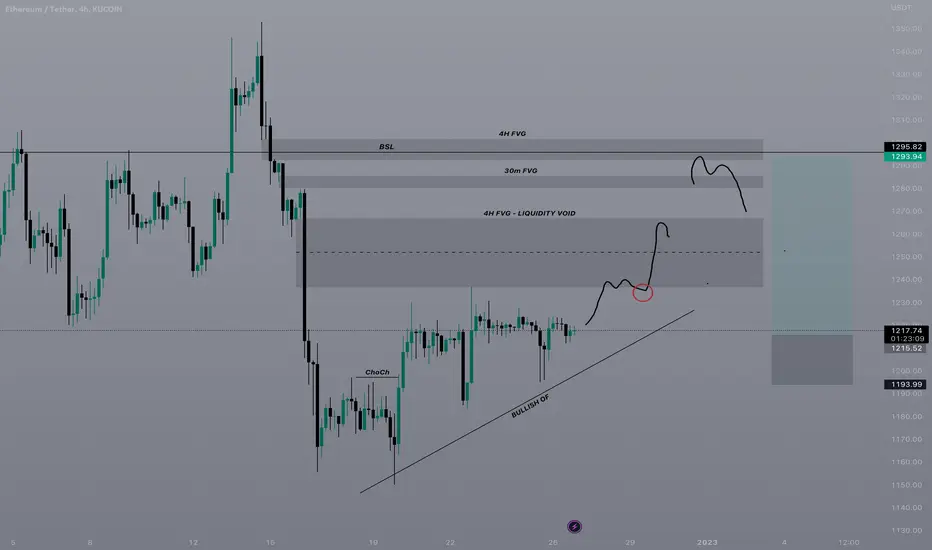
Ethereum LTF Analysis - Pump to $1265-95 Before CapitulationBases on my HTF Analysis and LTF Analysis I reckon we could see a pump up to these levels before making a lower low.
I think this could be a good trade setup with good risk management and sizing.
NFA.
ETHUSD Ethereum : Crash or dash? That's on you! 13.6Let's cut out the psychological pressure of seeing red and look at facts.
What's right now dominating the financial markets?
Inflation and panic selling.
What happens once the dust settles?
Think about "investment", what makes it attractive?
Crypto currency and specifically the Ethereum is an excellent hedge against inflation, fundamentally.
With scarce supply which is likely to burn faster than mined, and technology which could be the future of payment solutions - Ethereum shines.
So let's explain the crash technically:
1) Oversold condition which is only comparable to November 2016 and late 2018 - Both times proving to be extremely attractive buys.
2) Connecting trend-lines spanning back 1-4 years show very tight convergence between 890 - 1150.
3) A "Falling wedge" pattern is visible on a weekly time frame, which is bullish.
JP Morgan among other major names in finance name Crypto currency to be a smarter investment than real estate in current climate.
Don't let your emotion control your judgement, don't let fear run you out of investment.
Be smart, be patient, be calculated.
---------------------------------------------------------------------------------------
Thank you so much for reading! If you found my idea useful please like and follow - It would mean a lot.
My goal is to help as many traders as possible make sense of the markets.
If you have any questions or comments please don't hesitate, it's the fuel to keep me going :)
----------------------------------------------------------------------------------------

ETH ANALYSIS#ETH UPDATE.
#ETH is currently trading at the resistance area on daily,since eth could not close above the resistance last day we must wait eth to close above the blue box resistance area.On closing above the resistance the next resistance for eth would be pink box area.

Long Idea for Ethereum Idea for a Long Positions for ETH.
Entry $1130-1115
Targeting the Fair Value Gap and Buy Side Liquidity.
NFA. Remember Risk Management

Trading Idea for Ethereum💸In this idea, I'm going to share my own short-term trading plan on Ethereum . So this one is not an analysis it is an action plan with calculations.
As you can see on the chart (1H time-frame), ETH has reached a PRZ (Potential Reversal Zone) around $1310. This is the high of the last bullish wave on our ascending trend (you can see the yellow trend-line to find my bullish trend). I came to this conclusion because of four reasons:
1. RSI bullish trend-line is broken downwards
2. There is a bearish divergence on MACD
3. The price has reached the level 1 Fibonacci Extension
4. The Red (sales) volumes are rising, and the Green (buys) volumes are decreasing
So it is time for a correction now, to find to size of the correction I've used to Fibonacci retracements on the last bullish wave. The "green box" is our strongest support area on the Fibonacci. But also if I want to make my support area stronger I'll pick the area that my green box overlaps with the yellow bullish trendline. This will be the area for me to buy Ethereum if the price hit it, it is somewhere between $1210 - $1220.
Here is the trading trick, this strong support area, is a good place for me to buy. But what will happen if things go wrong?!! Before anything else I'm going to plan to setup my stop-loss . There are two good stop-losses here:
1. Somewhere around $1190, it is our lower low from our previous low
2. When the yellow bullish trend-line is broken
So we have our stop-loss, it's time to calculate our take profit area . With drawing two Fibonacci extensions, from our two last bullish waves to our green box (if the price hit that area as the end of the correction), we'll get two level 1 Fibonacci Extension. First one around $1368 and second one around $1446. My tow take profit points will be below these levels. The good thing about this trading idea is its great R/R ration that you can see on the chart!
I will definitely update this trading idea as the market proceed, so make sure you follow my account and stay tuned.
As always feel free to ask any question you have about my idea and share your own thoughts on the comment section. And if you like this idea make sure you hit the BOOST button.

ETHUSD - It is what it is - Still more downside to comeETHUSD looks bearish.
It is what it is . Probably many people would prefer to see higher prices but BTC broke the key support and ETH is lagging behind. It will have to catch up .
Probably some FUD would be a trigger for a dump.
What could it be? Do you have any clue? Feel free to share your FUD ideas in the comment section !

Ethereum longEthereum bounced off the ascending trendline and bounced off the support level. Bullish movement to resistance level at 1340 is expected to happen.

Updated Scenario for Ethereum ($1400) before lower lowsI got my old predictions wrong, with good CPI news as well the markets pumped.
I believe we could go to these levels before heading down again if we can break and hold above $1350 - I will be adding shorts around these levels.

Ethereum Analysis 03.12.2022Hello Traders,
welcome to this free and educational analysis.
I am going to explain where I think this asset is going to go over the next few days and weeks and where I would look for trading opportunities.
If you have any questions or suggestions which asset I should analyse tomorrow, please leave a comment below.
I will personally reply to every single comment!
If you enjoyed this analysis, I would definitely appreciate it, if you smash that like button and maybe consider following my channel.
Thank you for watching and I will see you tomorrow!

Ethereum Long ideaA short term buy on ETH. Just simply following structure with orderblocks.
Price could invalidate and go lower but I’m trading what I currently see.

#ETH/USDT 36%+ Potential Pump. RR 1:8 !!I've already shared the reason I am opening this long in my last BTC update.
(The link is at the bottom of this update)
ETH/USDT
Entry:- $1085 TO $1167
(5.39% is the accumulation range from CMP so plan your entry accordingly)
Stop Loss:- $1052.94
Target:- Open (Possibly +30%)
RR 1:8 (Highly Lucrative)
This is not financial advice. Always DYOR.
These are my trades.
Do not cry in the comments if you can't afford the Stop Loss or go for 125x gambling.
If you like me to post more. Share this idea with your friends and communities and please hit the like button.
I have been with you in the bullish days and the bearish days.
We are going to have an amazing bull run for sure.
Cheers!
Thank you
#PEACE

3 TradingView indicators for trading EthereumTrading Ethereum can be a completely different experience to trading Bitcoin and other cryptocurrencies. While most cryptocurrency will typically move in unison, each Cryptocurrency does still have its own fundamental factors unique to its particular ecosystem, which means that they can move at different intensities and sometimes these unique aspects means they won't move in unison at all.
This can be very much true for Ethereum and it can frequently diverge from general market sentiment and forge its own price action path. As such, Ethereum traders might like to pay attention to indicators that were designed to fit this asset class. In this article we explore three such indicators and their use with to trading Ethereum.
Performante's Average Ethereum Volume Indicator
The Performante's Average Ethereum Volume Indicator uses volume flow from the biggest cryptocurrency exchanges, to determine the average trading volume of the asset. The benefit of this indicator is that you now can see a more accurate and all-encompassing idea of the volume of the asset being traded, rather than a volume flowing through one exchange/ broker.
Ethereum Long-Short Ratio
This indicator is important for understanding market sentiment as derived from the number of long traders vs the number of short traders.
Effectively, the higher the ratio (the higher the orange bars) means that long traders out number short traders, the we might have more confidence in the bullish prospect of Ethereum. Conversely, a lower the ratio, or the lowering of the ratio, might indicate the declining bullish prospect of Ethereum.
Correlation Coefficient
After you select this indicator, you will be presented with a popup box for you to choose an asset that you can compare with Ethereum. Your selection here could be banking stocks, tech stocks, Bitcoin, another cryptocurrency, or any other asset that aligns with a theory you have about Ethereum moving in relation to the movement in another asset.
The Correlation Coefficient Indicator is range bound between 1 and –1. If the indicator is switching between the bounds of this range or hugging close to 0, it typically means that the relationship between the assets is not very strong or predictable (as 0 indicates no correlation). What you want to watch out for are assets where the indicator remains close to 1 (as this indicates a high positive correlation) or -1 (as this indicates a high inverse correlation). Either way, a positive or inverse relationship can be used to help determine the movement of Ethereum via this other asset.
