ETH/USD Analysis: Trading Opportunity in Real TimeHello, traders! Today, I'm testing some premium indicators on TradingView for the ETH/USD pair with a 1-hour timeframe. 🚀 I'm using tools like the Support & Resistance Matrix, Market Prediction Indicator, and Trend Navigator to find the best opportunities.
📌 Trade Details:
Entry: $3,311.07 (latest signal).
Take Profit: $3,400.00 (projected resistance zone).
Stop Loss: $3,237.44 (key support zone according to the indicators).
The Trend Navigator is still showing a bullish trend, and even though I’ve already taken the latest signal, there’s still time to analyze this opportunity! 📈 The projection indicates a potential upward movement, and we are well-positioned to take advantage of it if the price maintains this momentum.
🔥 My analysis: If we respect the blue trend line and hold the nearby support, the target is achievable. But always remember to manage risk and adjust your stop loss to protect capital.
What do you think of this entry? Leave me your comments, and don’t forget to like for more trading content! 🎥✨"
Ethereumsignals

A plan BUY ETHEREUM ETHUSDHappy new week and Congrat... Mr Trump.
This is my plan for ETHEREUM : BINANCE:ETHUSD
I saw a strong uptrend signal confirmed on D1 timeframe
Going to BUY ETHUSD at entry zone: 3400 - 3450
Target 49xx
Stoploss: 2900

ETHEREUM The Parabolic Rally to $10k has started!Ethereum (ETHUSD) is having a strong recovery rebound this week after marginally breaking below the 1W MA50 (blue trend-line) earlier. This indicates enormous buying pressure on the Bull Cycles first core Support level (the second being the 1M MA50 (red trend-line) which supported twice last Aug/Sep).
In comparative terms, relative to ETH's previous Bull Cycle, we are around the October 2020 levels, which was the last consolidation before the Cycle's main Parabolic Rally started. This is also evident on the 1W RSI fractals among the two. The rally exceeded by a small margin the 1.5 Fibonacci extension and formed the Cycle Top.
As a result, we expect ETH to hit at least the $10k level before this Cycle tops towards the end of the year. Technically, we should see the 1W MA50 support until the end.
-------------------------------------------------------------------------------
** Please LIKE 👍, FOLLOW ✅, SHARE 🙌 and COMMENT ✍ if you enjoy this idea! Also share your ideas and charts in the comments section below! This is best way to keep it relevant, support us, keep the content here free and allow the idea to reach as many people as possible. **
-------------------------------------------------------------------------------
💸💸💸💸💸💸
👇 👇 👇 👇 👇 👇

Ethereum 4-Hour Analysis: Ascending Triangle Points to a BullishWhat’s Happening with Ethereum?
The trend is BULLISH, and we’re seeing a triangle pattern that could be the key to our next big trade. Let me break down my strategy so you can take full advantage of this move!
My Strategy:
Pattern Identification: We’ve spotted an ascending triangle on the 4-hour chart with a key resistance at $3,472.
Entry (Buy Limit) $3,472: If the price breaks this resistance with strength, we’ll place a buy order and aim for $3,878.
Risk Management: To protect ourselves from unexpected reversals, we’ll set a Stop-Loss at $3,095.
Key Confirmation: We’ll only enter if there’s increasing volume to avoid false breakouts.
Why This Strategy? An ascending triangle like this often signals a continuation of the bullish trend. With solid risk management, we’re aiming for a strong risk/reward ratio while staying aligned with the market’s momentum.
Disclaimer: This content is for informational and educational purposes only. It is not financial advice. Always do your own research and consult with a licensed financial advisor before making any investment or trading decisions. Trading involves significant risk, and past performance is not indicative of future results.

Ethereum towards new ATH?After testing the resistance above 4,000, the flash crash in Alts impacted ETH/USD as well, resulting in a sharp drop to 3,500.
However, the strong support established at this level held firm, preventing further declines. Now, the price is approaching the resistance zone once again.
At this point, it seems the bulls are gaining momentum, making a breakout above the resistance highly likely.
If this breakout materializes, the price could accelerate significantly, with 5,000 emerging as the next logical target.

Like altseason arrived: ETH follows bullish chart patternsHello,
Like altseason arrived, Ethereum established a bullish trend in the green channel. Furthermore, the price has been in the consolidation of a symmetrical triangle (green triangle), which seemingly broke upward. The bullish channel and the symmetrical triangle indicate the optimal risk-reward ratio for a long position. If the break isn't a bull trap, ETH might continue going up until the $4500 psychological resistance, which aligns with the top of the channel. Breaking the channel upward could send ETH to $5300.
Following a bearish scenario, ETH might be rejected from the current price (top of the triangle), in which case, it might find support at $3400 - the middle of the channel.
Regards,
Ely

Healthy growth on EthereumEthereum is in an uptrend according to the Exponential Moving Averages (EMAs), but more importantly, the current price ($3700) is about EMA 20. Buying Ethereum at an average price has a positive risk-reward ratio. In a bearish scenario, ETH could bounce from EMA 200 ($3350) at the latest and still maintain a bullish trend. Anything below EMA 200 would have a bearish indication. If the current bullish trend persists, Ethereum eyes the $4000 psychological resistance.

ETH/USD "ETHEREUM" Crypto Market Heist Plan on Bullish SideHello!! My Dear Robbers / Money Makers & Losers, 🤑 💰
This is our master plan to Heist ETH/USD "ETHEREUM" Crypto Market Market based on Thief Trading style Technical Analysis.. kindly please follow the plan I have mentioned in the chart focus on Long entry. Our target is Red Zone that is High risk Dangerous level, market is overbought / Consolidation / Trend Reversal / Trap at the level Bearish Robbers / Traders gain the strength. Be safe and be careful and Be rich.
Entry 📈 : Can be taken Anywhere, What I suggest you to Place Buy Limit Orders in 15mins Timeframe Recent / Nearest Low Point take entry should be in pullback.
Stop Loss 🛑 : Recent Swing Low using 4H timeframe
Attention for Scalpers : Focus to scalp only on Long side, If you've got a lot of money you can get out right away otherwise you can join with a swing trade robbers and continue the heist plan, Use Trailing SL to protect our money 💰.
Warning : Fundamental Analysis news 📰 🗞️ comes against our robbery plan. our plan will be ruined smash the Stop Loss 🚫🚏. Don't Enter the market at the news update.
Loot and escape on the target 🎯 Swing Traders Plz Book the partial sum of money and wait for next breakout of dynamic level / Order block, Once it is cleared we can continue our heist plan to next new target.
💖Support our Robbery plan we can easily make money & take money 💰💵 Follow, Like & Share with your friends and Lovers. Make our Robbery Team Very Strong Join Ur hands with US. Loot Everything in this market everyday make money easily with Thief Trading Style.
Stay tuned with me and see you again with another Heist Plan..... 🫂

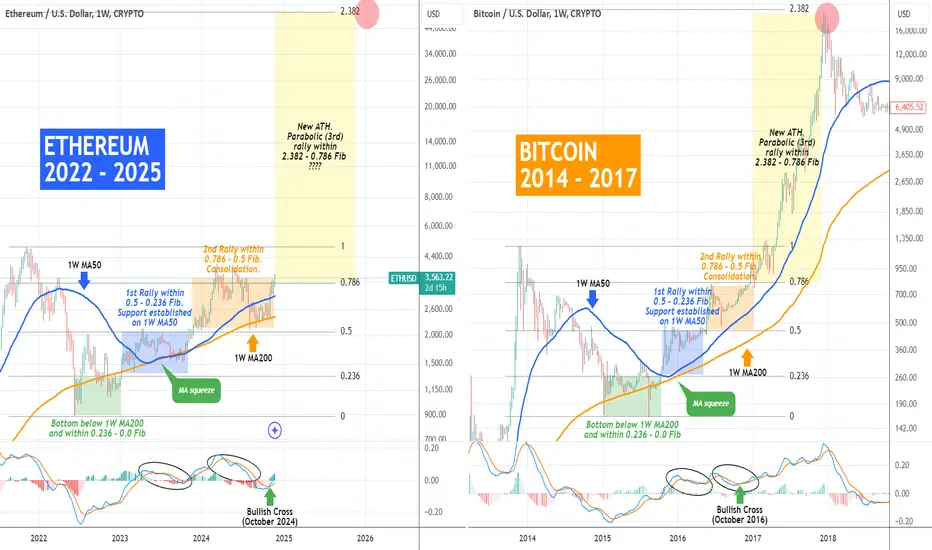
ETHEREUM Is it copying Bitcoin's 2014/17 Cycle towards $50k???Ethereum (ETHUSD) hasn't yet made a new All Time High (ATH), in contrast to Bitcoin (BTCUSD) but that isn't necessarily a negative development as it can highlight its enormous upside potential.
** ETH 2022/25 vs BTC 2014/17 **
A idea that strengthens this notion is today's analysis where you see ETH's current (2022 - 2025) Cycle against BTC's 2014 - 2017. As you can see so far the two Cycle's have been very similar with Ethereum replicating both the Bear Cycle and so far the majority of Bitcoin's past Bull Cycle.
** The Phases **
For more efficient comparison purposes, we have classified the Cycle in phases with the start being the bottom formation (Green Phase) below the 1W MA200 (orange trend-line) and within the 0.236 - 0.0 Fibonacci Zone. That gives way to the 1st rally (Blue Phase) within the 0.5 - 0.236 Fib with the 1W MA50 (blue trend-line) established as the Support. What follows is the 2nd Rally (Orange Phase) within the 0.786 - 0.5 Fib Zone and consolidation.
** October Bullish Cross and $50k?? **
The October 1W MACD Bullish Cross (Oct 2016 for BTC, Oct 2024 for ETH) signals the transition to the final stage (Yellow Phase) of the Bull Cycle, the Parabolic Rally to new ATH. For Bitcoin that peaked near the 2.382 Fibonacci extension. If that seems unrealistic for Ethereum's price today (the 2.382 Fib is just above $50k!!) in terms of market cap (and rightly so) just consider the impact that the ETFs' capital inflows have on the market. It remains to be seen, but nonetheless, ETH has enormous upside from here onwards and we're sure that even a +100% rally from the current price would be welcomed by the majority of the market.
-------------------------------------------------------------------------------
** Please LIKE 👍, FOLLOW ✅, SHARE 🙌 and COMMENT ✍ if you enjoy this idea! Also share your ideas and charts in the comments section below! This is best way to keep it relevant, support us, keep the content here free and allow the idea to reach as many people as possible. **
-------------------------------------------------------------------------------
💸💸💸💸💸💸
👇 👇 👇 👇 👇 👇
ETHEREUM Is this the parabolic rally to $11500?Ethereum (ETHUSD) gave us the perfect bottom buy entry on its 1M MA50 (red trend-line) last time we gave a signal on it (September 03, see chart below):
As you see this time on the 1W time-frame, following the last week the price saw the strongest weekly candle rise of the whole Bull Cycle, breaking and closing above its 1W MA50 (blue trend-line) for the first time since July 29 2024.
On top of that, the 1W MACD completed last week a Bullish Cross, the first since October 30 2023 (i.e. a year ago). That Cross was the final buy signal confirmation of the very aggressive multi-month rally that topped in March 2024. As a result, the current Bullish Cross should also be treated the signal we've been waiting to confirm the new Bullish Leg.
This time however, we are at this stage of the Bull Cycle where 4 years ago during the previous one, ETH started its Parabolic Rally, the most aggressive part of the Cycle. As you can see, in November 2020 the price was also above the 1W MA50, the 0.5 Fib and past a 1W MACD Bullish Cross. Also 1000 days have past since the previous Cycle Top, similar to this time also.
The rally that started then (Nov 2020) peaked marginally above the 1.5 Fibonacci extension, forming a top of the Higher Highs trend-line. As a result, we can expect ETH to target a new Cycle Top at $11500 (Fib 1.5 ext).
-------------------------------------------------------------------------------
** Please LIKE 👍, FOLLOW ✅, SHARE 🙌 and COMMENT ✍ if you enjoy this idea! Also share your ideas and charts in the comments section below! This is best way to keep it relevant, support us, keep the content here free and allow the idea to reach as many people as possible. **
-------------------------------------------------------------------------------
💸💸💸💸💸💸
👇 👇 👇 👇 👇 👇

ETHEREUM Closed August above 1M MA50, keeping bullish case aliveEthereum (ETHUSD) may have completed three straight red months (1M candles) but despite the recent correction, managed to close August above the 1M MA50 (blue trend-line), in spite of touching it earlier within the month.
This is a key Support level as it also held during the August - October 2023 bottom formation, initiating the multi-month rally up until March 2024. This makes it a long-term Support and as long as it is holding, it is keeping ETH within bullish territory.
At the same time, the price also held the 0.5 Fibonacci retracement level from the Cycle bottom. The last time that happened was during the previous Cycle in September - October 2020. After it held, this kick-started the Cycle's Parabolic Rally to just above the 1.5 Fibonacci extension level.
As a result, as long as the 1M MA50 is holding, we can expect the next High to be as high as 11500, even though 8k would seem more reasonable in terms of market cap and thus feasible as a long-term Target.
-------------------------------------------------------------------------------
** Please LIKE 👍, FOLLOW ✅, SHARE 🙌 and COMMENT ✍ if you enjoy this idea! Also share your ideas and charts in the comments section below! This is best way to keep it relevant, support us, keep the content here free and allow the idea to reach as many people as possible. **
-------------------------------------------------------------------------------
💸💸💸💸💸💸
👇 👇 👇 👇 👇 👇

ETH (Crypto ETHEREUM-USD) BUY TF H4 TP = 3347On the H4 chart the trend started on Aug. 08 (linear regression channel).
There is a high probability of profit taking. Possible take profit level is 3347
Using a trailing stop is also a good idea!
Please leave your feedback, your opinion. I am very interested in it. Thank you!
Good luck!
Regards, WeBelievelnTrading

ETH target over 100001D time frame
-
TP: $7306 / $10,000
-
(1) $2100 is the best entry if fell again
(2) ETH is running Elliott Impulse Wave, and just completed the 1st and 2nd wave
(3) 3rd wave will come around 9/E, and reach its high in Jan ~ March 2025
(4) The low of 4th wave can be seen in April ~ June 2025
(5) The high of 5th wave can be seen in Oct ~ Nov 2025
(6) Keep being patient

ETHEREUM ETFs are live! Is a new era of growth emerging?United States Ether exchange-traded funds (ETFs) posted net inflows of $106.6 million on their first day of trading. Ethereum (ETHUSD) saw the massive inflows led by BlackRock, Bitwise and Fidelity overcome the outflows from Grayscale and that may have set the tone of a new ear of growth for the market.
Much like Bitcoin's ETF launch back in January, ETH may see a similar rally that can finally take it past its All Time High (ATH). As you can see on this 1W time-frame chart, the post BTC ETD approval rally on January led to March's High. Another such Leg can see ETH past $5000 by September.
Apart from the undoubtedly great ETF news, this chart shows Ethereum's cyclical behavior, and as you can see, relative to the previous Cycle, its upside potential rests a little above the 1.5 Fibonacci extension level. That was the spot where the November 2021 ATH was priced. Our long-term Target range remains $10000 - $12000.
-------------------------------------------------------------------------------
** Please LIKE 👍, FOLLOW ✅, SHARE 🙌 and COMMENT ✍ if you enjoy this idea! Also share your ideas and charts in the comments section below! This is best way to keep it relevant, support us, keep the content here free and allow the idea to reach as many people as possible. **
-------------------------------------------------------------------------------
💸💸💸💸💸💸
👇 👇 👇 👇 👇 👇

ETHUSD Ethereum Market Robbery Plan to make moneyMy Dear Robbers / Traders,
This is our master plan to Heist ETHUSD Market based on Thief Trading style Technical Analysis.. kindly please follow the plan I have mentioned in the chart focus on Long entry. Our target is Red Zone that is High risk Dangerous level, market is overbought / Consolidation / Trend Reversal at the level Bearish Robbers / Traders gain the strength. Be safe and be careful and Be rich.
Note: If you've got a lot of money you can get out right away otherwise you can join with a swing trade robbers and continue the heist plan, Use Trailing SL to protect our money.
Stop Loss : Recent Swing Low using 4h timeframe
Warning : Fundamental Analysis comes against our robbery plan. our plan will be ruined smash the Stop Loss. Don't Enter the market at the news update.
Loot and escape on the target 🎯 Swing Traders Plz Book the partial sum of money and wait for next breakout of dynamic level / Order block, Once it is cleared we can continue our heist plan to next new target.
support our robbery plan we can easily make money & take money 💰💵 Join your hands with US. Loot Everything in this market everyday make money easily with Thief Trading Style.

Ethereum _ Falling Wedge Pattern Breakout. Traget is $3881In Ethereum, a Falling Wedge Pattern has formed and Breakout, also completing the 0.6 Fibonacci Retracement level. The next Target is $3881.

ETHEREUM Will an ETF approval cause a massive rally?Exactly a month ago (April 22, see chart below), we called for Ethereum's (ETHUSD) bottom and gave a medium-term buy signal:
With the SEC facing deadlines on May 23 and May 24 to decide on spot Ethereum ETF applications by Vaneck and Ark Invest, we might be in front of a massive rally. Even from a technical point of view, the historic Cycle performance of Ethereum suggests that currently we might be getting off a similar consolidation to August - October 2020.
Observe how the 1W RSI is making a bullish reversal after having pulled-back from a marginal Channel Up break-out. At the same time, the 1W LMACD is about to make the exact same Bullish Cross it did on the week of November 09 2020, when again it started to break above that consolidation.
What followed these events back then was a massive rally that peaked marginally above the 1.5 Fibonacci extension level. As a result, we remain bullish long-term, expecting a strong rise until the end of the year, targeting $12000 (Fibonacci 1.5 ext).
-------------------------------------------------------------------------------
** Please LIKE 👍, FOLLOW ✅, SHARE 🙌 and COMMENT ✍ if you enjoy this idea! Also share your ideas and charts in the comments section below! This is best way to keep it relevant, support us, keep the content here free and allow the idea to reach as many people as possible. **
-------------------------------------------------------------------------------
💸💸💸💸💸💸
👇 👇 👇 👇 👇 👇

ETHEREUM Massive support cluster on this Bull Flag. Target 10k??Ethereum (ETHUSD) traded exactly the way we wanted it last time we looked at it (January 09, see chart below)
At the moment, the price is trading below the 1D MA50 (blue trend-line), having recovered the 1D MA100 (green trend-line) on what was a bottom on the 6-month Bullish Megaphone. This Higher Low was almost priced on the 0.382 Fibonacci level.
That is similar to the June 15 2023 Bullish Megaphone Higher Low on the 0.382, which as it held the 1D MA200 (orange trend-line), it pushed the price to a rebound. However the 1D MA200 was broken (closed a 1D candle below) after and ETH had to find Support on the 0.5 Fib before it started the current Megaphone. The peak came almost on the -1.00 Fibonacci extension.
As a result, as long as Ethereum keeps the 1D MA200 intact, we are bullish. If it closes even a single candle under the 1D MA200, we will wait for a comfortable buy on the 0.5 Fib (2500). On both cases, the Target is $10000 (Fib -1.00 extension).
-------------------------------------------------------------------------------
** Please LIKE 👍, FOLLOW ✅, SHARE 🙌 and COMMENT ✍ if you enjoy this idea! Also share your ideas and charts in the comments section below! This is best way to keep it relevant, support us, keep the content here free and allow the idea to reach as many people as possible. **
-------------------------------------------------------------------------------
💸💸💸💸💸💸
👇 👇 👇 👇 👇 👇

ETHUSD 8HETH ~ 8H 📈
#ETH Make purchases gradually in this pattern, with a minimum target of 15%+. this is a bull pattern on a smaller timeframe.

ETHEREUM Can $9000 be a minimum target?We haven't looked at Ethereum (ETHUSD) since the start of the year (January 09, see chart below) but it did give us an excellent symmetrical buy opportunity and easily hit our $3000 Target:
We now move out to the 1W time-frame in order to understand where the current 2-week pull-back is positioned relative to the previous Cycle. As you can see, ETH is past a 1W MA50/ 100 Bullish Cross, as well as the first consolidation at the start of the green Channel Up, which during 2020/21 took it to its All Time High (ATH) of $4900.
It appears that we are on the symmetrical pull-back (blue Cup) after the Accumulation Phase's Resistance (Aug - Oct 2020). This can be even more efficiently observed on the 1W RSI, as we see the first strong pull-back within the overbought territory.
The previous Cycle peaked just above the 1.382 Fibonacci extension from the previous ATH. That gives us a Target of $9000 and that's the minimum in our opinion during this new Bull Cycle. The maximum is on the 2.236 Fib extension, measured from the Cycle bottom to the current High. In 2021 it fell practically on the same level as the 1.382 Fib. This time though it is considerably higher at $25000 and that gives us a maximum Target for this Cycle. What this means for us as investors is that, the majority of our ETH will be converted at 9k and we will leave just a few in case we see that 25k extreme.
-------------------------------------------------------------------------------
** Please LIKE 👍, FOLLOW ✅, SHARE 🙌 and COMMENT ✍ if you enjoy this idea! Also share your ideas and charts in the comments section below! This is best way to keep it relevant, support us, keep the content here free and allow the idea to reach as many people as possible. **
-------------------------------------------------------------------------------
💸💸💸💸💸💸
👇 👇 👇 👇 👇 👇

ETH to $4,000 Before Dencun Upgrade? ☀️☀️☀️The price of Ether rose 1.2 percent to $3,854 over the past 24 hours ahead of the implementation of its Dencun upgrade next week. This upgrade will slash Ether’s transaction fees (also known as gas fees) which currently are at the highest level since May last year.
Separately, the SEC is seeking comments on BlackRock and Fidelity’s spot ETH ETF applications, notably asking whether Ether’s proof of stake mechanism and concentration of control raise concerns about potential fraud and price manipulation. Interested third parties have 35 days to file their comments.
“I think it is inevitable Ether is next,” the co-founder and co-CEO of HANetf Hector McNeil told cryptonews. “If Bitcoin can be approved and meets all the liquidity and asset class thresholds then Ether qualifies.”
A bullish sun continues to shine over Bitcoin and Ether in the next 24 hours and week, signaling additional upside potential. Litecoin, Binance Coin, Polygon and Uniswap should also benefit from this positive trading trend, ATTMO shows.
Dogecoin, Avalanche and Polkadot face bearish clouds and downside risks over the next 24 hours but should profit from the bullish sun over the longer one-week horizon. The opposite is expected for Ripple’s XRP and Cardano, where there is upside potential in the short term and downside risks in a week’s time.
Follow us for more crypto news and weather reports!

ETHEREUM Is it about to start an insane parabolic rally?Ethereum (ETHUSD) has been consolidating since its High at the start of the year but on the longer term, the uptrend since the October 2023 Low is intact. The current analysis is basically an extension of our previous on November 23 2023 (see chart below):
As you can see the 1W MA50/ MA100 Bullish Cross (blue and green trend-lines respectively), has been formed for the first time since the August 17 2020 1W candle. That was the reason we previously drew comparisons with the August - September 2020 consolidation within the 0.618 - 0.5 Fibonacci range.
The 1W RSI is on a structured decline similar to that 2020 consolidation and that naturally can lead someone to believe that once it's over and a full 1W candle is closed above the 0.618 Fib, the Parabolic Rally of the Bull Cycle will start. So far even the symmetry from the Cycle Top to the current point in time is also identical to 2020 (around 970 days).
Do you think ETH will start an insane rally soon?
-------------------------------------------------------------------------------
** Please LIKE 👍, FOLLOW ✅, SHARE 🙌 and COMMENT ✍ if you enjoy this idea! Also share your ideas and charts in the comments section below! This is best way to keep it relevant, support us, keep the content here free and allow the idea to reach as many people as possible. **
-------------------------------------------------------------------------------
💸💸💸💸💸💸
👇 👇 👇 👇 👇 👇

ETHEREUM One more pull-back before $3000.Ethereum (ETHUSD) almost hit our 2450 Target on the last buy call we made (November 17 2023, see chart below) before it started to consolidate at the top of the 1.5 year Channel Up:
However it did turn out that the consolidation Megaphone, similar to January's, was the one that started on December 09 2023 and not before, as on our previous analysis. For that reason we adjusted the Channel Up, this time on the logarithmic scale, and it fits perfectly the current consolidation after the initial October Bullish Leg.
The 1D MA50 (blue trend-line) provided the first line of Support and if the January - February 2023 repeat continues, we should be expecting one final pull-back towards the 1D MA100 (green trend-line), which is where the March 10 2023 was made (also on the 1D MA200 (orange trend-line)). On top of that, the 1D RSI provides an excellent buy signal, as the 30.00 - 32.00 Zone has given 4 excellent buy opportunities in tha last 14 months.
The target is $3000, which is on the 1.5 Fibonacci extension level and almost represents a +100% rise from the October 12 2023 bottom. Those where the exact ranges of the April 16 2023 Higher High of the Channel Up.
-------------------------------------------------------------------------------
** Please LIKE 👍, FOLLOW ✅, SHARE 🙌 and COMMENT ✍ if you enjoy this idea! Also share your ideas and charts in the comments section below! This is best way to keep it relevant, support us, keep the content here free and allow the idea to reach as many people as possible. **
-------------------------------------------------------------------------------
💸💸💸💸💸💸
👇 👇 👇 👇 👇 👇
