Ethereum Stalls at $3,101.0FenzoFx—Ethereum broke past $2,880.0 but stalled near a bearish fair value gap. The daily chart shows a longwick bearish candlestick, signaling increased selling pressure.
With Stochastic at 90.0, ETH is short-term overbought. Resistance is at $3,101.0—if it holds, ETH may retreat to $2,880.0 or $2,638.0.
A close above $3,101.0 would invalidate the bearish outlook and pave the way toward $3,330.0.
Ethereumtechnicalanalysis

Ethereum Approaches $2,908 as Bullish Momentum FadesEthereum remains bullish, trading near $2,796 and approaching monthly resistance at $2,908. Stochastic shows an overbought reading of 81.0, suggesting short-term buying exhaustion.
Bearish Scenario : A pullback toward $2,651 is likely if $2,908 holds. Extended selling pressure could lead to a test of the anchored VWAP near $2,500.
Bullish scenario : A confirmed breakout above $2,908 would likely extend the rally toward $3,260.

Ethereum Bullish Bias Pauses After Reaching Weekly HighF enzo F x—Ethereum rose from $2,539.5, backed by VWAP and volume profile, but momentum eased after hitting the $2,651.0 weekly high. Stochastic signals overbought conditions at 87.0, hinting at possible consolidation or downside pressure.
Bullish scenario : The bullish trend remains intact above $2,500, with upside potential toward the bearish FVG at $2,741.0.
Bearish scenario : A close below $2,500 would shift focus to the $2,383 support zone.

ETH Momentum Builds Above Key SupportFenzoFx—Ethereum bounced from the $2,397.0 support and swept liquidity below the level, backed by a bullish FVG on the 4-hour chart. ETH is currently testing resistance at $2,500.0, and a breakout could lead to a retest of $2,539.0.
The bullish setup remains valid above $2,397.0; below that, $2,317.0 becomes the next support.

Ethereum Faces Resistance at $2,539.0Ethereum was rejected at the $2,539.0 resistance, a high-volume supply zone. If this level holds, ETH could drop toward $2,397.0, and a break below it may trigger further downside toward $2,192.0.
The bearish outlook is invalidated if ETH/USD closes above $2,539.0.

Ethereum's Monthly High Rejection: Is a Bearish Wave Coming?FenzoFx—Ethereum tested and swept the monthly highs at $2,813 but failed to sustain its bullish momentum. The 1-hour chart formed a bearish fair value gap, signaling increasing selling pressure.
Currently, Ethereum trades slightly below the monthly high at approximately $2,806, with immediate resistance at $2,813. If this level holds, ETH/USD could target the 50.0% retracement zone near $2,640.

ETH Tests The $1,623 Level as SupportFenzoFx—ETH rebounded at the $1,623 support level, indicating potential for an uptrend toward $1,755.
If ETH/USD drops below $1,623, it may test the 50-period SMA near $1,600, aligned with the 50% Fibonacci retracement.
>>> No Deposit Bonus
>>> %100 Deposit Bonus
>>> Forex Analysis Contest
All at FenzoFx Decentralized Forex Broker

Ethereum Trades Sideways Testing Critical Support FenzoFx—Ethereum trades sideways, unable to surpass $1,690 resistance. Currently, it hovers at $1,565, testing this level as support.
The bearish trend persists below $1,755. Stabilization under $1,565 may lead to dips toward $1,470 and potentially $1,370 if selling pressure increases.
>>> No Deposit Bonus
>>> %100 Deposit Bonus
>>> Forex Analysis Contest
All at F enzo F x Decentralized Forex Broker

Ethereum is Bearish: Watch this Resistance LevelFenzoFx—Ethereum is trading sideways, stabilizing above the 50-period SMA but has yet to form higher-highs. While the price remains above $1,755, the primary trend is considered bearish. A drop below this resistance could push the price toward $1,370 support.
On the other hand, if bulls manage to close above $1,755, a bullish wave could emerge, setting $1,950 as the next target.
>>> No Deposit Bonus
>>> %100 Deposit Bonus
>>> Forex Analysis Contest
All at F enzo F x Decentralized Forex Broker

Ethereum is Under PressureFenzoFx—Ethereum has lost 4.5% of its value today, erasing gains from the previous trading day. The immediate resistance level is $1,755, in conjunction with the 50-period SMA. The downtrend will likely resume if this level holds, targeting the previous lower lows at $1,370.
Please note that the bearish outlook should be invalidated if ETH/USD exceeds $1,755. If this scenario unfolds, the price may target $1,950.
>>> Trade ETH/USD swap free at FenzoFx Decentralized Broker.

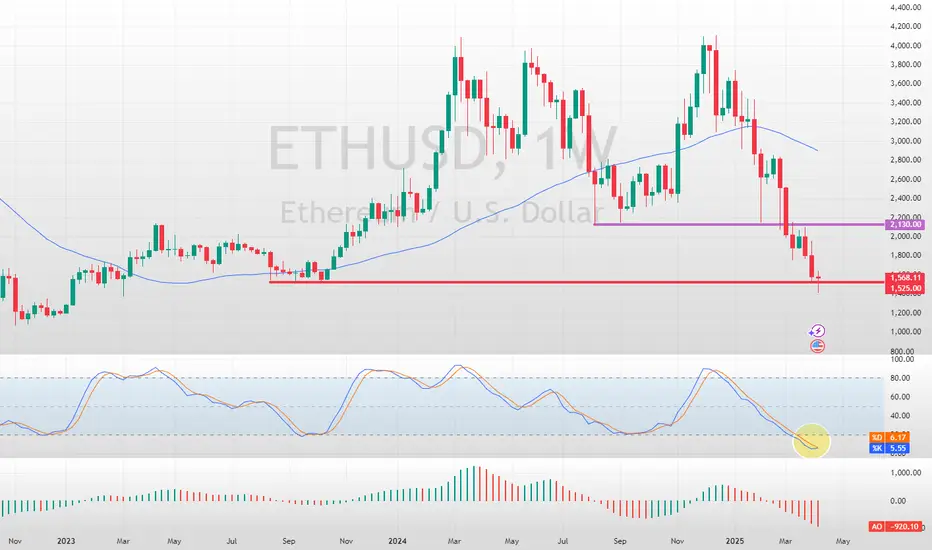
Ethereum Tests Critical Support LevelFenzoFx—Ethereum tests the critical support level at $1,525. A consolidation wave toward $2,130 could be imminent.
Ethereum (ETH/USD) - Bearish Continuation Setup
📉 Market Structure:
The chart displays a strong downtrend with Ethereum trading inside a descending channel. The price recently broke below a key support level and is now consolidating within a range.
🔍 Key Levels:
Resistance Zone: $2,050
Current Price: $1,884
Support Zone: $1,690
Target: $1,438
📊 Trade Idea:
If price retests the support-turned-resistance around $1,930–$2,050 and rejects, a strong move to the downside is likely.
A confirmed break below the $1,690 support zone could trigger further bearish momentum toward the $1,438 target.
Traders may look for short positions upon a bearish rejection at resistance or a confirmed breakdown.
🚨 Confirmation & Risk Management:
Bearish Confirmation: Rejection from resistance or a breakdown of the range.
Invalidation: A sustained breakout above $2,050.
Risk Management: Stop-loss placement above resistance to mitigate risk.
This setup aligns with the prevailing bearish trend, favoring short opportunities unless a strong reversal occurs.

ETH not dead yetLooking for a bullish count here on ethereum as we seem to be looking to continue higher.
The down move off the 2140$ high seems to be a corrective move as it is a three wave move, therefore not trend establishing.
Looking for further upside as we could moving sideways in a triangle in wave (iv).
Questions are more than welcome, trade safe!
Feel free to check out my other post here on Tradingview!

Ethereum Update!Little Update on our recent ETH TA like we somewhat expected we saw a rejection off of the top of this triangle that we have respected during our whole time trading within it, now theres definitely some good reason behind this rejection we have multiple layers of resistance all at the same level, first of all the top of the triangle itself, the 50 day EMA, the 0.6 FIB level are all strong points of resistance. Now on the other hand we could most definitely see a bounce off of our current spot we are sitting now we have multiple layers of support, The 20 day EMA, checked out the bollinger bands and our midline lines up perfectly with the 20 day EMA, we have the pivot point which is a pretty crucial area. Now if by chance we do see a drop below the teal pivot point tonight for our daily close, this could definitely trigger a slip to the downside which is not ideal for us trying to regain an uptrend, as far as support below our current level we have the bottom of the triangle itself, support at the top of the descending channel, and 2 additional layers of support just below the bottom of the triangle. So if we do see a downside i think it will be pretty quick for us seeing a rebound, now a likely scenario would be a false breakout to catch traders. this would look something like a break and close out of the bottom of the triangle making traders scream SHORT, before then catching support and regaining the triangle itself and likely a move to the topside, the market movers love false breakouts because it liquidates many traders. Forgot to mention but we have very solid support at the 0.786 FIB level which is also the S1 Support, so if we we're too look for a trade i would say an entry at the .786 FIB, little generous stop loss and a take profit around 2800$ (USD)! Now for the Squeeze momentum indicator we have what looks like the last stride of red (bearish) movement, we have seen a steady decrease in the red bars day after day showing bearish momentum fading away, now what we are looking for is potentially another red bar (decreased from today) before then pushing above the midline into bullish zone. The black crosses represent the bullish/bearish squeeze and when those crosses turn white that represents the squeeze release, which is the explosive part of this indicator! To see this for yourself backtest and line up the white crosses to price action itself! Not financial advice just my opinion!

Ethereum Buying ZonesImportant Buying Zones for Ethereum .
BUYING ZONE 1 - $2725 - $2890
BUYING ZONE 2 - $1700 - $1855
BUYING ZONE 3 - $1274 - $1450

Ethereum W-Pattern Breakout | Back to $4000?Hi guys,
we are currently seeing a breakout and a retest of a W-Pattern. Price Target: $4000

Ethereum Update!!Checking out Ethereum on the daily timeframe we are looking a bit shaky i can't lie, todays been a rough day for the markets overall and we have came way down out of are accumulation zone and we are currently sitting below the 0.2 FIB level which of course is not very ideal and if we do close below here the door is open for a push down to the 3667$ level. After that if we don't hold that support we are looking at the 3464$ level which i think is a good spot to catch a rebound, its a strong support level with tons of price action from months back, if we don't hold here we are looking at the 0.3 FIB or 3214$ which i can't see us going any further for the time being. as for resistances if we close where we are for tonights close we are facing resistance from the 0.2 FIB, the midline on the bollinger bands and the 3990-4K level. Looking at the bollinger bands we notice that price action currently is sitting on that bottom band and if we see a close ontop we could be in for a sharp downside drop likely too the 3464$ level or the 0.3 FIB. The RSI is giving me some hope, even though we crosses below the SMA we are currently ontop of strong support coming from months back and ideally we want price action to push back up above that 0.2 FIB so we can hopefully see a bounce off of this support level on the RSI, ideally in the longer outlook of things we definitely want to climb back and get above that midline, being below keeps u in a confirmed downtrend and being above and holding puts us back in an uptrend! Now the Squeeze momentum indicator, this gives me some hope aswell, we are approaching the midline on the SMI and what we want to see here is a green bar after daily close, this would give us the momentum needed to start making a push back up, the only problem is that if price action closes bearish then we are looking at an increased red bar for our next one and that could kick off yet another bearish squeeze which we dont want to see. Definitely some big closes tonight especially for BTC aswell, our overall direction going forward is still up in the air and we will have to see what our daily close brings us! NFA Just my opinion!!

Ethereum Breakout Coming soon!!?Looking at Ethereum it is pretty clear we have no sense of real direction and one thing that stood out to me very clearly is that we are in a wider ranged accumulation phase in the market. Shown by the blue shaded area we have respected this zone very well and are struggling to find a breakout point, what i believe is happening is a big 3 week accumulation period where we are seeing strong hands and big money scooping up Ethereum/ all of crypto before the next leg up. This phase can definitely mess with the emotions and can lead you to believe we are entering a bear market or just a downtrend period, i don't think this is the case though, smart money and big institutions are playing the waiting game striking fear into retail investors and overall giving uncertainty. The past couple days including today have been looking good we are seeing strong bull candles and a push back up into this zone after briefly falling underneath. First off lets take a look at some key levels, the support levels we need to hold onto are the S1, 4000$ (USD), and the very important 0.2 FIB level. Now the resistances that are very key goes as follows, the midline on the bollinger bands is a must regain level and will be a big test once we reach it, the 4400$ level, the crucial pivot point (P) this level if we can close above should give us some much needed bull momentum, then the 4600$ level, a break and close above here is important because it has been the respected top of this accumulation zone and for us to leave this phase this level is key. Then of course we have the 0 FIB level (ATH) which will give us mass amounts of momentum if we can regain it and enter price discovery mode. Now the bollinger bands, another reason why this 4600$ level is so important is because a break above here will land us right on that top bollinger band, and this as we all know can spark an explosive move to the upside and go on a significant run and likely easily breakthrough that ATH! Now the MACD we see that the histogram is decreasing showing us a decline in bearish momentum, want we want to see here is a push back into the green zone and see increasing green bars day after day, aswell as an explosive bull cross with the blue MA taking off from the orange. Not financial advice just my opinion!

Ethereum Next Leg Up!!?Ethereum has been following my second scenario yellow path pretty perfectly against Bitcoin, we are currently sitting just under resistance at 0.0769 which we have wicked off of multiple times already, weakening the level everytime. We are sort of moving sideways but i think the momentum is building up for ethereum and its only a matter of time before we smash through here! Then we are looking at resistance at the 0.0788 level, i do think we might face a little trouble here aswell but there are definitely some factors that could send us flying right through but we will have to wait and see when the time actually comes. The bollinger bands are providing us some nice support just underneath the 0.0733 level and then we also have support at 0.0716, so i think its comfortable enough to say we aren't going to go far we see further downside, what i am way more interested in is that top band on the bb's and this is one of the factors that could send us flying through both of these overhead resistance levels. If we continue to push up a little bit more we will be sitting right on this top band and if we can secure a daily close on here the chances of us having an explosive upwards breakout are pretty high, historically grabbing onto that top band majority of the time sends PA flying, same thing but opposite for the bottom band. Now the SMI, we are slowly moving our way up in a bullish squeeze, shown by the black crosses and aswell as the increasing green bars everyday, this shows a stronger bull squeeze and the more we increase the more explosive our squeeze release is going to be (shown by black crosses turning white). Now the Chaiken Money flow, we had a nice bounce off of the midline and strong turnaround to the upside, this shows that investors bought up the dip on ethereum and we have money flowing into ETH and since we are going against BTC on this chart its signaling money flowing into ETH rather than Bitcoin, with BTC.D settling and slowly dropping i think altseason is on the horizon and im expecting it to be an absolutely massive one! NFA just my opinion!

Ethereum Climbing Back Up!!Since we were trading withing the bullish triangle a little while ago i talked about some very nice looking upside on the horizon and we have seen just that with a strong breakout and a steady climb back to the upside! PS. This drawing was not the Bullish triangle i am referring too i erased it to clean up the chart a bit, we have taken out the 0.2 FIB level and we have had multiple retests with us being successful everytime, another key level we have successfully regained is the 3667$ and again we have had multiple retests succeeding. The next big test we are facing is the 4k level or aprx 3990-4000K level we have had one touch so far and we're rejected but we are still looking strong and seem to be taking a little cooldown resting on our current support level until we make our next move upwards! We also have uptrend support coming from around 2800$ and we have respected it all the way up till now, i see us holding onto this level following it upwards and ultimately i am looking for a reentry of our ascending channel shown above and then eventually the 0 FIB of course coming from our ATH! Looking at our Bollinger bands we seem to be inna very nice spot with price action well above the midline and not far away from that top band, i think we could be in for a rollercoaster ride up the top BB since we have not seen one in quite some time and we keep on wicking too the very top, likely just a matter of time before we have a nice upside day then eventually grabbing onto that top band taking it for a ride likely up towards that 0 FIB level, if the momentum is there i don't see us having too many problems shredding through this level and creating a new ATH and aswell entering price discovery mode! Looking at the Reversal Momentum Indicator we are in a slight downside right now but we see the orange curling heavy to the upside and coming towards the blue, we don't want too see a bearish reversal with the blue going under the orange but we could definitely see a little fakeout where we get a nice bounce off of the orange to continue this upside climb! Checking out the ADX we are looking good and seem to have found some footing a decent bit below our previous high, we are starting to turn to the upside with the direction looking to start an overall reversal after having some significant downside. A must watch for Ethereum is price action grabbing onto that top bollinger band, the RMI getting a bounce and keeping the blue ontop, and aswell the RSI which isn't currently on the chart, we need to stay above the midline to continue the uptrend, we are significantly above the midline currently near the top of the zone so thats why i decided to leave it out of this TA but always keep an eye on that! Not financial advice just my opinion!

Ethereum Big Upside On The Horizon!!Ethereum recently had a very strong breakout of this pennant and has been pushing the 0.2 FIB for the last 4 days, we want to continue to see momentum pushing upwards and ultimately a daily close above the 0.2 FIB at some point soon, none the less we are looking very good and very bullish! A daily close up and above the 0.2 FIB opens the door back up for us to regain the ascending channel which we fell out of somewhat recently and also as i said opens the door for big upside! Taking a look at the Wavetrend we are just starting to pass the midline and still have quite a bit of room to keep pushing up, and we are showing no signs of stopping, we see the red crosses are below our wave pushing us upwards with bullish momentum and we want to keep seeing our wave push vertically, lessening the chance of us having a bearish crossover and ultimately ending our current bullish wave. Now lets take a look at our squeeze momentum indicator, just today we have crossed over the midpoint and putting out our first green bar in quite some time and after a long drawn out bearish period! Things are really starting to look good, noticing the black crosses which indicate a current squeeze we haven't seen any grey crosses in awhile showing a squeeze release, all this momentum building up could be absolutely huge for Ethereum, once we see those grey crosses and more green bars we likely will be on the verge of a huge run upwards, just like what we saw nearing the end of July, we had a decent red period squeeze and shortly after we turned bullish we got that squeeze release which sent us flying as you can see in the ascending channel. (Remember, keep an eye out for those grey crosses) Now lets look at the ADX or the average directional index, we have been seeing a bigger downslope in the ADX but i have some positive news, it looks like we are catching some longterm support here and we are seeing the ADX starting to curl upwards which is a very great sign! If we can get a bounce off here we could be looking at the next upside "wave" for Ethereum, all things are pointing to this happening, and keep in mind this indicator is very smooth and we don't see any jagged movement or sharp turns up or down, its a gradual move and we could be seeing the beginning of that big move! Not financial advice just my opinion!!

Ethereum ready to take off!!?Looking at Ethereum vs Bitcoin we see a clear descending wedge which is very bullish in itself and as you can see to the left of our current wedge we had another descending wedge which blasted us upwards once we brokeout. Think we are looking very good overall and wouldn't put it past ETH to pull this off again! We have a very heavy support area below us shown by the rectangle, we have the pivot point which acts as support and then aswell as the bottom of the wedge which is also support, on the other hand though we do have a fair amount of resistance above us, the top of the wedge, the 0.2 FIB level, resistance at 0.0741 sats and then the R1 resistance. the beauty of this and the positive is the fact that we have had quite the correction and cooldown across the whole market and plus once we do start to see bullish momentum it is going to be explosive, plus don't forget the very bullish pattern we are currently in, once we start to take off i would say we can most likely easily blast through most of these levels because they are so close, and i would expect us to reach the R1 level before we start to see some pushback from the bears, even at that point though i think we could shred right through there after a couple attempts at the level. Looking at the MACD we are seeing a steady decline in the red bearish bars day after day and thats exactly what we want, bearish momentum draining out and giving the bulls that chance to really takeover. On the MA's we are seeing them getting pretty close together which is a good sign, meaning we are getting closer to a bullish cross, however there could still be a couple or few more days of decline due to the fact that the blue MA is slightly turning to the downside. The Wavetrend overall looks great, we are nearing the bottom zone which is the buy zone and we are seeing what looks like a sort of bottom out from this downtrend wave, like i said with the MACD we could still see a bit of a decline on the wavetrend but i really doubt we go much further, we want to keep an eye on those red crosses and as you can see we are pretty close to getting them underneath our wave to start giving us that push back up! Not financial advice just my opinion!

ETH DOMINANCE READY FOR A RUN UP!!Checking out ETH's dominance we notice that it looks like we have found some decent support here at 18.20% and we are seeing a couple transition candles, one a couple days ago and another one in the making today, now if we can hold this support and have another green transition candle i think we are set to make another run up! First off id like to compare the ETHUSD chart shown in the first pane (orange) vs the eth dominance chart, as we can see i've marked the start of run ups with vertical lines and as u notice when dominance starts to rise up so does the ETH price, as shown in the first pane, we have been in a nice uptrend recently on ETHUSD and now that we have seemed to have found a bottom here i think we are going to continue this, now keep in mind if BTC falls off a cliff this TA probably wont be valid anymore! Checking out the MACD we are looking good and it seems like we are starting to see a pushback and eventually a bullish cross, histogram is getting real flat and not moving a whole lot anymore. The Stoch RSI looks very good we are starting to see what looks like a huge upswing and an upcoming bullish crossover, even better we are currently in the oversold zone and it doesn't look like we have really anywhere else to go but upwards! Same thing kind of for the RSI we aren't in oversold but we have dipped into the confirmed downtrend area but i don't like its going to last, i think we are gonna see a blast right through that midline back into uptrend territory, we aren't very far off the midline and we are moving upwards now pointing in the right direction! Not financial advice just my opinion!
