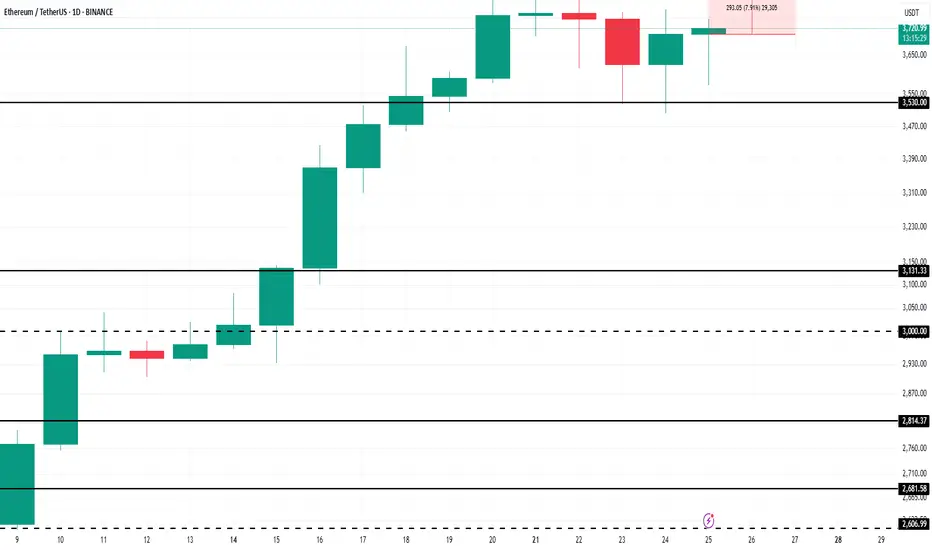
Ethereum’s $4,000 Target Alive as Historic Rally Signs EmergeBINANCE:ETHUSDT is currently trading at $3,680, just 9% away from the critical $4,000 resistance that many investors have been waiting for over the past seven months. The altcoin is expected to continue its upward momentum despite the recent consolidation, with the potential to breach the $4,000 mark soon.
Looking at broader technical indicators, the NUPL (Net Unrealized Profit/Loss) suggests that BINANCE:ETHUSDT is poised for a significant rally . The NUPL indicator, when reaching a threshold of 0.5, traditionally signals a pause in the uptrend, followed by a sharp rally.
$ BINANCE:ETHUSDT is currently nearing this threshold , which, in the past, has marked the beginning of powerful upward price action.
As long as BINANCE:ETHUSDT remains above its key support levels, the price is likely to surge toward $4,000 . If Ethereum can maintain its momentum, a breach of $4,000 could act as a catalyst for further gains.
However, should unforeseen selling pressure arise, $BINANCE:ETHUSDTprice could slip below the $3,530 support level. In such a scenario, Ethereum may fall to $3,131, invalidating the current bullish outlook. The key will be maintaining support and capitalizing on the retail-driven surge.
Ethereumusd
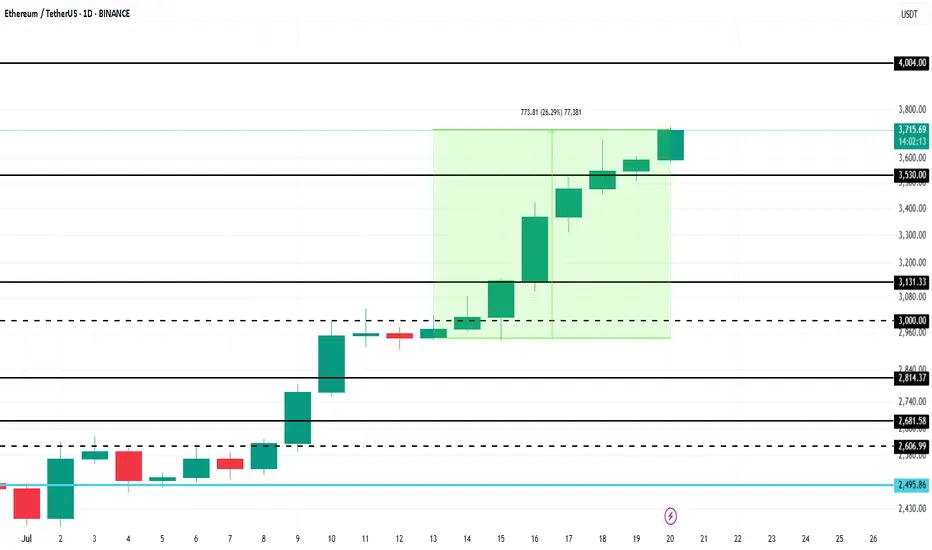
Ethereum Price Hits 6-Month High, Up Next $4,000BINANCE:ETHUSDT has managed to navigate recent market volatility with significant support from investors. As companies increasingly mirror Bitcoin’s corporate treasury use case, Ethereum is gaining traction.
BINANCE:ETHUSDT price surged 26% over the past week , reaching $3,715 and marking a 6-month high. The rally strengthened after ETH formed a Golden Cross last week. With this bullish momentum, Ethereum is now targeting $4,000 in the coming days, benefiting from investor confidence and growing institutional interest.
However, if BINANCE:ETHUSDT bullish momentum weakens and investors opt to sell, the price could decline to $3,131 . This would erase recent gains and invalidate the current bullish outlook.
Ethereum - Finally new all time highs!🔬Ethereum ( CRYPTO:ETHUSD ) will break out now:
🔎Analysis summary:
For more than four years, Ethereum has overall been moving sideways. However now Ethereum is once again retesting previous all time highs and preparing a bullish breakout. Multiple retests are generally considered bullish so the breakout is very likely to happen any time soon.
📝Levels to watch:
$4.000
🙏🏻#LONGTERMVISION
SwingTraderPhil

Ethereum/US Dollar 1D Chart - BINANCEdaily price movement of Ethereum (ETH) against the US Dollar (USD) on the Binance exchange. The current price is $2,992.08, reflecting a +1.39% increase (+$41.10) as of 09:54 AM CEST, July 11, 2025. Key levels include a resistance zone around $3,500-$4,000 and support near $2,736. The chart highlights recent buy and sell signals, with a notable upward trend approaching the resistance zone.

ETH/USD Setup | Thief Trading Blueprint for Profit.🔥🚨THE ETHEREUM HEIST PLAN: Thief-Style Trading Blueprint for Maximum Gains🚨🔥
💰Thief Mode: Activated | Time to Rob the Bulls 💰
📢🌍 Hello Money Makers, Crypto Crooks & Chart-Breaking Bandits! 🐱👤🤑💸
Welcome to the “Thief Trading Style” breakdown — a high-stakes, high-reward crypto market blueprint built on deep technical & fundamental intel. This isn’t your average strategy… it’s a full-blown heist on the ETH/USD market!
🧠 THE MASTER PLAN (ETH/USD – Day & Swing Trade)
🔎 Based on our Thief Mode analysis — blending market sentiment, trend psychology, and price action — Ethereum is ripe for a bullish robbery. We’re setting up shop at high-risk liquidity traps and targeting bearish overconfidence.
💥ENTRY STRATEGY – "The Vault Is Open, Time to Strike!" 💥
🟢 Go Long:
Swipe in on bullish momentum.
🕒 Set Buy Limit Orders at key pullback zones (swing highs/lows from 15m or 30m timeframes).
💼 Use DCA (Layered Orders) for multiple precision entries. The more layers, the stronger the loot stack.
🛑STOP LOSS – "Thief Rule: Don’t Get Caught"
📍Place SLs at logical swing highs/lows using the 1H timeframe
💡 Adjust according to lot size & how many entries you're stacking
Risk smart, steal smarter!
🎯TARGET – "Make the Escape at 2850.0 or Jump Early if Cops Close In!"
📌Set TP at 2960.0, or
📌Exit early if the market starts turning shady (exit before reversal signs appear)
⚔️SCALPER'S CODE – "Fast Hands Only!"
🧲Only scalp Long-side plays
🧠Use trailing SLs to protect stolen profits
💼Big wallets? Front-run the move
🪙Smaller bags? Team up with swing traders and follow the blueprint.
🚨MARKET CONTEXT – Why This Heist is Bulletproof
💥ETH/USD is showing bullish energy due to:
Macro & Fundamental Drivers
On-Chain Metrics showing accumulation
Sentiment Analysis leaning toward over-leveraged bears
Intermarket Correlation signaling rotation into altcoins
🔗Stay sharp, keep updated with: COT Reports, Macro Calendar, Crypto News Feeds
⚠️NEWS RELEASE WARNING – "Robbers Hate Surprises"
📛Avoid new entries during major news releases
📈Use Trailing Stop Losses to lock in profits
⛔Don’t leave positions unmanaged during volatility spikes
💖LOVE THE PLAN? THEN BOOST THE GANG!
🎯Tap the 🔥 Boost Button 🔥 and show support for the Thief Trading Style!
The more boosts, the more plans drop — let’s build a community of smart traders robbing the market legally (😉).
✍️DISCLAIMERS
📌This analysis is for educational purposes only — not financial advice.
📌Always trade within your own risk management rules.
📌Market conditions change fast — adapt, evolve, and don’t trade blindfolded.
🚀Stick around for more blueprints — the next heist is always just around the corner.
Until then… Lock. Load. Loot. 🐱👤🤑💰

Bear market starts August 2025 and Bottoms January 2027 Ethereum will bottom at $450 then 2027 and 2028 will be the best 2 years in the history of crypto and the world and ethereum will reach above $100,000 by end of 2028
the charts are obvious!
Not a Financial advise
Ethereum / U.S. Dollar 4-Hour Chart (BINANCE)4-hour candlestick chart displays the price movement of Ethereum (ETH) against the U.S. Dollar (USD) on the BINANCE exchange. The current price is $2,740.99, reflecting a +$124.74 increase (+4.77%) in the last period. The chart includes a buy/sell indicator with no current activity (0.00), a resistance zone highlighted in pink, and a support zone in light green. The price has recently surged, breaking through the $2,740.99 level, with additional price points ranging from $2,400.00 to $2,949.06 shown on the right axis. The time frame spans from late June to July 10, 2025.
ETH Ready for Lift-Off: Traders Eye +14% Surge Toward $2,813Ethereum has been consolidating in a large sideways range after recovering from a steep decline earlier this year. The chart clearly shows a defined support zone and key resistance area, with price currently trading just above mid-range and attempting to reclaim bullish momentum.
Chart Structure Highlights
• Support Zone: Around $2,231 – $2,232, which has been tested multiple times and held firmly, confirming strong demand here.
• Key Resistance / Take Profit Area: Near $2,813, a major level where price was repeatedly rejected in the past.
• Consolidation Box: A ~50-day range between support and resistance, suggesting accumulation.
• Recent Price Action: ETH is attempting to break out of the upper side of this consolidation, with buyers gradually stepping in.
Trade Setup
✅ Entry Zone: $2,450–$2,460
ETH is currently near this area, which represents a conservative breakout attempt from the range. Traders may look for confirmation candles closing above $2,460 for added conviction.
✅ Stop Loss: $2,231
Placed just below the lower edge of the support zone to protect against a failed breakout and renewed selling.
✅ Take Profit Target: $2,813
This is the key resistance level marked on the chart, offering approximately +14% upside from the entry.
Reward-to-Risk Profile
• Potential Reward: ~$353 (+14.3%)
• Potential Risk: ~$228 (-9.2%)
• Reward:Risk Ratio: ~1.55:1
Summary of the Setup
Ethereum has spent nearly 50 days consolidating between $2,230 and $2,813, and is now threatening a breakout to the upside. This creates a favorable swing trade scenario with a clear invalidation level below the strong support zone. A sustained move above the consolidation could target the $2,813 resistance in the coming weeks.

"ETH Bullish Heist: MA Breakout Confirmed! Next Stop 3600?"🔷🔹 "THE ETH HEIST: MASTERPLAN TO LOOT 3600!" 🚨💰 (Breakout + Pullback Strategy)
🌟 Yo, Fellow Market Robbers! 🌟 (Hola! Bonjour! Salaam!)
Listen up, Money Makers & Thieves! 🏴☠️💸
Based on the 🔥Thief Trading Style🔥, we’re about to pull off the ultimate ETH/USDT heist—Ethereum vs Tether is our target!
🔪 THE TRADE SETUP (LONG HEIST)
🎯 Entry Signal:
"The heist begins at MA Breakout (2900)! Wait for confirmation, then strike like a pro thief!"
Option 1: Buy Stop above MA (2900) for breakout momentum.
Option 2: Buy Limit on pullbacks (15-30min TF) for sneaky low-risk entries.
📌 ALERT! Set a breakout alarm—don’t miss the robbery!
🛑 Stop Loss (Thief’s Escape Route):
"Yo! If you’re entering on breakout, DO NOT set SL before it triggers! Place it at the nearest swing low (12H TF)—or risk getting caught by the bears! 🐻🔪"
🎯 Profit Target: 3600 (OR Escape Early!)
Scalpers: Only long scalps allowed! Use trailing SL to lock profits.
Swing Thieves: Ride the wave but exit before the cops (bears) arrive!
⚡ WHY THIS HEIST WILL WORK:
Bullish momentum + MA Breakout = Easy Loot!
Overbought? Trap? Reversal? Nah—we escape before the danger zone! (Yellow ATR = High Risk)
📢 THIEF’S WARNING:
🚨 News Alerts = Market Chaos!
Avoid new trades during high-impact news.
Trailing SL = Your Best Friend.
💥 BOOST THIS HEIST!
👉 Hit 👍 LIKE & 🔔 FOLLOW to strengthen our robbery squad! More heists = More profits! 🚀💰
Stay tuned, thieves… Next heist coming soon! 🏴☠️🔥

Ethereum Breakdown Ahead? Classic Head & Shoulders Pattern Hello Guys!
Ethereum looks like it’s setting up for a potential drop after forming a textbook Head & Shoulders pattern on the 4H chart.
This pattern (marked clearly with a left shoulder, head, and right shoulder) is often seen before a price reversal. Right now, ETH has already broken below the neckline (around $2,480), confirming the bearish pattern, and is currently retesting that level from below.
📉 What’s Next?
If the pattern plays out, we could see ETH drop toward the projected target zone around $2,200–$2,250, which is highlighted in blue on the chart. This zone also lines up with a previous area of interest and sits near a broken trendline, adding confluence to the setup.
✅ What I see:
Resistance: ~$2,500 (neckline retest)
Target: ~$2,200 support zone
Broken trendline adds downside pressure
Unless bulls reclaim the neckline quickly and push above the right shoulder (~$2,650), this looks like a bearish continuation setup.

Inverse Head and Shoulders on Ethereum: Short Opportunity ETH?I'm currently watching Ethereum , and things are starting to look interesting.
We’re seeing early signs of a potential break in structure to the downside, and I’m closely monitoring a bearish inverse head and shoulders pattern. On the 30-minute timeframe, I’m waiting for a clear break of market structure within the current range before considering a short entry.
Stop loss would be placed above the range, with the target outlined in the video.
This is not financial advice—please trade responsibly and always manage your risk.

ETH: Hardly Any Volatility Not much has happened for Ethereum since yesterday. According to our primary scenario, wave B in turquoise should imminently push higher, theoretically up to resistance at $4,107. Once these corrective rises conclude, wave C should take over, driving ETH down to complete the large green wave in the Target Zone below ($935.82 – $494.15). The low of this multi-year correction should lay the foundation for subsequent wave increases, likely causing new record highs above the $10,000 mark, as the weekly chart suggests. In our alternative scenario, ETH would embark on this bullish journey earlier. Currently at 27% probability, this alternative assumes the corrective low was already established at $1,385, which would imply a direct breakout above $4,107.
📈 Over 190 precise analyses, clear entry points, and defined Target Zones - that's what we do.

Ethereum’s 19-Day ETF Inflow Streak: What Really HappenedEthereum’s 19-Day ETF Inflow Streak: What Really Happened to Price, Structure, and Sentiment
Table of Contents
1. Executive Summary
2. ETF Backdrop: How the 19-Day Inflow Wave Took Shape
3. Chronology of Price: Day-by-Day Performance
4. Weekly Chart Anatomy: The “Pre-Tower Top” Signal Explained
5. Intraday Technicals: From $2,450 Low to the $2,620 Hurdle
6. On-Chain & Derivatives Lens: Funding, OI, CEX Balances
7. Fundamental Undercurrents: Dencun Afterglow, L2 Fees, Staking Yields
8. Risks & Catalysts: ETH vs. Macro, vs. BTC Dominance, vs. SEC Noise
9. Playbooks for Traders and Long-Term Allocators
10. Conclusion: A Pause, Not a Peak—If Key Levels Hold
________________________________________
1. Executive Summary
• Ethereum received 19 consecutive days of net inflows into spot-linked exchange-traded products (ETPs) totaling $1.37 billion, the longest positive streak since the 2021 bull-run.
• Over the same period ETH/USD rose 18.4 %, printing a local high at $2,750, but has since pulled back to $2,575 amid broad crypto risk-off and Middle-East tensions.
• The latest weekly candle morphs into a “pre-tower top” pattern—two tall green candles followed by a small-bodied doji—often a harbinger of heavy distribution if confirmed by another red week.
• Short-term structure improved Monday: price pierced a contracting-triangle ceiling at $2,550, reclaimed the 100-hour SMA, and now eyes $2,620 as the gatekeeper to renewed upside.
• Funding rates flipped neutral, exchange reserves hit a 7-year low, and staking deposits outpace withdrawals 1.7 : 1—on-chain signs that the sell-off is more leverage shakeout than top formation.
________________________________________
2. ETF Backdrop: How the 19-Day Inflow Wave Took Shape
2.1. The Players
Unlike Bitcoin’s mammoth U.S. spot ETFs, Ethereum’s inflow streak drew from Europe and Canada, where physically backed ETPs have traded since 2021. The three biggest contributors:
Product Country 19-Day Net Flow AUM Growth
21Shares Ethereum ETP (AETH) Switzerland +$502 m +38 %
CI Galaxy Ethereum ETF (ETHX) Canada +$458 m +29 %
WisdomTree Physical Ethereum EU +$227 m +24 %
Rumors of an SEC approval window “after the U.S. election” sparked pre-positioning; asset managers figured it was cheaper to accumulate now than chase later once liquidity explodes on Wall Street.
2.2. Flow Mechanics
When an ETP issues new shares, it must buy spot ETH or tap an AP that can supply coins—direct demand unmatched by equivalent selling pressure. Over the 19-day window, the net 396 k ETH of creation equaled 57 % of all new issuance from block rewards post-Dencun, creating a measurable supply squeeze.
2.3. Historical Context
The only longer stretch was January–February 2021 (27 days), which culminated in ETH exploding from $1,400 to $2,000. The key difference today: market cap is six times larger, so identical inflows exert a milder percentage impact, explaining why price “only” added ~18 %.
________________________________________
3. Chronology of Price: Day-by-Day Performance
Day Date ETF Net Flow Price Close % Δ vs. Prior Day
1 Mar 18 +$58 m $2,110 —
5 Mar 22 +$73 m $2,265 +7.3 %
10 Mar 27 +$94 m $2,430 +2.4 %
15 Apr 1 +$125 m $2,690 +3.8 %
19 Apr 5 +$81 m $2,750 +0.9 %
Across the stretch, realized volatility rose from 32 % to 46 %, but skew stayed positive, showing call demand outpaced puts until the very end, when geopolitical headlines flipped sentiment.
________________________________________
4. Weekly Chart Anatomy: The “Pre-Tower Top” Signal Explained
4.1. What Is a Tower Top?
In candlestick lore, a tower top comprises:
1. A tall green candle (strong breakout)
2. Another tall green candle (exhaustion)
3. A narrow doji or spinning top (equilibrium)
4. A large red candle (breakdown confirmation)
We currently have the first three pieces: the last two weeks of March delivered back-to-back 10 % advances; the first week of April closed as a +0.6 % doji. The pattern is not confirmed until a decisive red week engulfs the doji body (< $2,540).
4.2. Indicators
• RSI (weekly): 59 → ticking down from 68 high; still shy of overbought.
• MACD histogram: Positive but flattening.
• Bollinger bands: Price mid-point of upper band, room for one more expansion.
Conclusion: the candle warns of fatigue, but momentum hasn’t rolled over—yet.
________________________________________
5. Intraday Technicals: From $2,450 Low to the $2,620 Hurdle
5.1. Hourly Chart (Kraken Feed)
• Triangle Breakout: Price sliced through descending trend-line at $2,550, tagging $2,590.
• Moving Averages: ETH trades marginally above the 100-hour SMA ($2,575) but below the 200-hour ($2,610).
• Fibonacci Zones: $2,620 aligns with 0.5 retrace of the $2,750→$2,450 fall—classic reversal pivot.
A clean hourly close >$2,620 opens the door to $2,680 (0.618 Fib) and psychological $2,700. Failure rejects to $2,520 support cluster.
5.2. Order-Book Heat Map
Coinbase Pro data shows 1,300 ETH ask wall at $2,620 and a thinner 890 ETH bid at $2,520. Liquidity skew favors dip-buying, but bulls need market orders >1 k ETH to smash the ask block.
________________________________________
6. On-Chain & Derivatives Lens
6.1. Exchange Reserves
Centralized exchanges now hold 12.9 million ETH, lowest since July 2017. The 19-day ETF harvest accelerated an already extant down-trend of roughly 60 k ETH/week outflows, mostly into staking contracts and L2 bridges.
6.2. Staking Flows
• Beacon deposit contract: +188 k in April’s first week.
• Withdrawal queue: 11 k ETH—tiny relative to deposits.
• Effective deposit APR after Dencun: 3.2 %, still beating U.S. 2-year T-notes post-tax for many investors.
6.3. Perpetual Funding & OI
• Funding normalized to 0.007 %/8 h (≈ 3.2 % APR), down from 9 % at March highs—spec longs flushed.
• Open Interest shed $420 m in the two-day dip—liquidations, not fresh shorts, drove the wash-out.
6.4. Options Skew
• 25-delta risk reversal (1-month): flipped to –4 % (puts pricier than calls) for first time since January—hedging demand but nowhere near panic-level (–12 % in 2022 bear).
________________________________________
7. Fundamental Undercurrents
7.1. Dencun Afterglow & L2 Fees
Proto-danksharding (EIP-4844) slashed L2 data costs by 85 %, pushing average Arbitrum and Optimism transaction fees under $0.02. Cheaper blockspace fuels on-chain activity:
Metric Pre-Dencun Post-Dencun Δ
Daily L2 Txns 2.4 m 4.1 m +71 %
Bridged ETH to L2s 6.8 m 7.9 m +16 %
More usage → more gas burned → structural tailwind to ETH as a fee-burn asset.
7.2. DeFi TVL
Total value locked rebounded to $61 billion, led by EigenLayer and restaking hype. ETH comprises 68 % of TVL collateral—every lending loop pins additional demand.
7.3. Competing Narratives
• Solana season siphoned retail mind-share; SOL/ETH ratio popped 42 % YTD.
• Bitcoin L2s (Stacks, Rootstock) attempt to mirror Ethereum’s smart-contract moat, but dev tooling remains nascent.
•
Net: Ethereum retains developer supremacy (70 % of new GitHub commits among smart-contract chains) and therefore garners institutional comfort.
________________________________________
8. Risks & Catalysts
Factor Bearish Angle Bullish Rebuttal
Macro Sticky U.S. CPI halts Fed cuts → higher real yields weigh on non-yielders ETH staking yield + MEV is real cash-flow; Dencun lowers L2 costs → adoption offset
SEC Spot ETF Delay past Jan 2026 or outright denial kills U.S. inflow dream 19-day streak proves ex-U.S. capital is hungry; approval >0 is all it takes for supply shock
BTC Dominance Halving FOMO may keep Bitcoin’s share >55 %, starve ETH rotation Historical pattern: ETH rips 6-10 weeks post-halving as beta plays catch-up
Tower-Top Pattern Weekly confirmation could spark drop to $2,200 support Pattern fails if bulls recapture $2,750 quickly, turning doji into bullish flag
________________________________________
9. Playbooks for Traders and Long-Term Allocators
9.1. Short-Term Momentum (0–7 days)
• Bias: Range-trade $2,520–$2,620 until breakout.
• Instruments: ETH-perp on Bybit/Deribit, 3× leveraged tokens for reduced funding bleed.
• Trigger: 15-minute candle above $2,620 with ≥ $50 m aggregated CVD buys.
• Stop: $2,560 (triangle retest).
• Target: $2,680 then $2,700.
9.2. Swing (1–8 weeks)
• Bias: Accumulate dips as long as weekly stays >$2,350 (0.382 Fib of Oct→Mar leg).
• Tools: 1-month $2,500-$2,800 call spreads; spot with 25 % collar protection.
• Catalysts: SEC commentary May 23, FOMC June 18.
9.3. Position (6–18 months)
• Bias: Dollar-cost average into staking nodes; carry 4 % ETH on portfolio NAV.
• Thesis: EIP-4844 usage boom + probable U.S. ETF = $4–5 k fair value by 2026.
• Risk Control: Hedge 25 % notional via BTC-perp short if BTC.D >58 %.
________________________________________
10. Conclusion: A Pause, Not a Peak—If Key Levels Hold
The 19-day ETF inflow streak proves that institutional demand for Ethereum exists even without a U.S. spot vehicle. Price responded vigorously but not parabolically, reflecting the asset’s growing market-cap gravity. The nascent “pre-tower-top” weekly candle warns of exhaustion; confirmation, however, requires another bearish week that cracks $2,540 support.
Short-term order-flow shows willing dip buyers, staking metrics scream supply sink, and the macro backdrop—while shaky—fails to dent ETH’s relative value proposition versus fiat yields. Translation: Ethereum is vulnerable to headline-driven squalls but structurally sound.
If bulls recapture $2,620, the path to retest $2,750 and ultimately $3,000 reopens. Lose $2,450 and the tower top will complete, sending ETH toward $2,200 where ETF inflow buyers likely reload. For now, the balance of evidence favors consolidation with an upward skew—tower construction, perhaps, but no wrecking ball yet.

ETH/USDT Price Action Analysis — Bullish Continuation Expected 📊 ETH/USDT Price Action Analysis — Bullish Continuation Expected 🚀
🔍 Chart Overview (as of June 9, 2025):
This chart of ETH/USDT highlights a well-defined support and resistance structure, projecting a potential bullish move toward a main resistance target at $2,788.00.
🧱 Key Zones:
🔵 Support Zone: $2,440 – $2,480
Price rebounded strongly from this area, showing buyer interest and liquidity absorption.
🟠 Resistance Zone: $2,660 – $2,690
Previously rejected zone where supply overtook demand. Price must break and hold above this for further upside.
🔺 Main Resistance Target: $2,788.00
If resistance is cleared, this is the next major supply area, acting as a potential take-profit level.
📈 Price Action Insight:
Price is currently hovering near $2,538.37, approaching resistance.
The chart suggests a potential breakout scenario after a short consolidation.
A bullish breakout above $2,690 could trigger a sharp rally toward the $2,788 target.
The chart projects a pullback-retest pattern (break, retest, and continuation) before the final leg up.
⚠️ Risk Management:
Invalidation Level: $2,381.49
A break below this level would invalidate the bullish setup and could lead to further downside.
✅ Summary:
Bias: Bullish 📈
Entry Area: Break and retest above resistance zone ($2,660–2,690) 🔓
Target: $2,788 🎯
Invalidation: Below $2,381.49 🚫
📌 Note: Always use proper risk management and confirm breakouts with volume or momentum indicators (e.g., RSI, MACD).

Is Ethereum Back In Business? A Confluence of Bullish Patterns Is Ethereum Back In Business? A Confluence of Bullish Patterns, Brutal Liquidations, and Fundamental Strength
The cryptocurrency market is a theater of perpetual drama, a relentless cycle of fear and greed, innovation and volatility. In this unforgiving arena, Ethereum, the world’s second-largest digital asset, has once again captured the spotlight. After a period of underperformance that left investors questioning its momentum, a confluence of technical signals, market-shaking liquidations, and strengthening fundamentals has ignited a fierce debate: Is Ethereum truly back in business? The answer is not a simple yes or no but a complex narrative woven from bullish chart patterns, the chaotic fallout of political spats, and the quiet, inexorable growth of its underlying network.
At the heart of the bullish thesis lies a classic technical analysis signal: the Morningstar candlestick pattern. For traders and analysts who scour charts for clues about future price movements, the appearance of a Morningstar on Ethereum's monthly chart is a development of profound significance. Simultaneously, the market has been violently shaken by an $800 million liquidation event, a brutal culling of leveraged positions in both Bitcoin and Ether, reportedly triggered by a public feud between political and tech titans Donald Trump and Elon Musk. This event serves as a stark reminder of the market's fragility and its susceptibility to external shocks.
Yet, beneath this surface-level chaos, a different story is unfolding. On-chain metrics point to a network that is not just surviving but thriving. Institutional interest is surging, evidenced by substantial inflows into newly approved spot Ethereum Exchange Traded Funds (ETFs). Whales, the market's largest players, are sending mixed but largely accumulative signals. And technological upgrades continue to enhance the network's scalability and utility. This article will delve into these competing narratives—the hopeful story told by the Morningstar pattern, the cautionary tale of massive liquidations, and the quietly confident hum of Ethereum's fundamental growth—to paint a comprehensive picture of where the pioneering smart contract platform stands today.
The Morningstar's Dawn: A Technical Harbinger of a Bullish Reversal
In the lexicon of technical analysis, candlestick patterns provide a visual language for market sentiment. The Morningstar is one of the most revered bullish reversal patterns, a three-candle formation that often signals the end of a downtrend and the beginning of a new upward climb. Its appearance on a high-timeframe chart, such as the monthly chart for Ethereum, carries significant weight, suggesting a major shift in market psychology from bearish despair to bullish optimism.
To understand its power, one must first understand its structure. The pattern consists of three distinct candles appearing after a prolonged price decline. The first is a long bearish candle (typically colored red or black), which confirms the continuation of the downtrend and reflects the sellers' firm control. The second candle is the "star" of the pattern—a small-bodied candle that can be either bullish or bearish. This candle often gaps down from the previous one, indicating a moment of acute indecision in the market. The selling pressure that characterized the first candle has waned, but buyers have not yet seized full control. It represents a point of equilibrium, a pause where the prevailing trend loses its momentum. The third and final candle is a long bullish candle (typically green or white) that closes well into the body of the first bearish candle. This final candle is the confirmation; it signifies that buyers have decisively taken over, overwhelming the sellers and initiating a reversal.
The psychology behind the Morningstar pattern is a story of a power shift. The long bearish candle shows sellers are confident. The small middle candle reveals that confidence is cracking; a battle for control is underway. The final strong bullish candle declares the buyers as the victors, signaling that the path of least resistance is now upwards.
Recently, several crypto analysts have highlighted the formation of this very pattern on Ethereum’s monthly chart. After a period of consolidation and price decline, the emergence of a Morningstar suggests that the bottom of the recent downtrend may be in. Analysts see this as a macro reversal signal, a technical foundation for a potential rally. Some have set initial price targets around $3,300, viewing the current resistance levels as temporary hurdles that will likely be broken in the face of this powerful bullish formation. When combined with other indicators, such as trading volume, which ideally should increase during the formation of the third candle, the Morningstar provides a compelling technical argument that Ethereum is gearing up for a significant move higher. While no technical pattern is infallible, its appearance on a macro scale has undeniably injected a strong dose of optimism into the market, suggesting that Ethereum’s period of slumber may be coming to an end.
The $800 Million Purge: A Tale of Liquidations and Political Tremors
Just as technical analysts were celebrating the bullish omens on the charts, the market delivered a brutal reminder of its inherent volatility. A massive liquidation event, totaling over $800 million and by some estimates approaching $1 billion, swept through the cryptocurrency markets, disproportionately affecting leveraged traders in Bitcoin and Ethereum. In a span of just 24 hours, hundreds of thousands of traders saw their positions forcibly closed, a cascade of selling that sent prices tumbling.
Liquidations are the boogeyman of leveraged trading. When a trader uses borrowed funds (leverage) to amplify their position, they must maintain a certain amount of collateral. If the market moves against their position and their collateral falls below a required threshold, the exchange automatically closes the position to prevent further losses. This forced selling creates a domino effect. As prices fall, more long positions hit their liquidation points, triggering more selling, which in turn drives prices down further, liquidating even more positions. This is a liquidation cascade, and it can lead to rapid and violent price drops.
Recent data showed that long positions accounted for the overwhelming majority of these liquidations, indicating that the market was caught off guard by the sudden downturn. Exchanges like Bybit and Binance were at the epicenter of this financial storm, with Bybit alone reportedly accounting for nearly $354 million in liquidations. The largest single liquidation order was a multi-million dollar position, underscoring the high stakes involved.
What triggered this sudden market panic? Many analysts pointed to an unlikely source: a public and increasingly acrimonious feud between former U.S. President Donald Trump and Tesla CEO Elon Musk. The dispute, reportedly stemming from disagreements over a major tax and spending bill, spilled out onto social media, creating a storm of uncertainty that rattled investors. In today's interconnected world, high-profile clashes between powerful figures can have an immediate and tangible impact on financial markets, particularly on assets perceived as "risk-on," such as cryptocurrencies.
The public fallout was seen as a destabilizing event, injecting political uncertainty into an already fragile market. The fear was that the conflict could have broader economic implications or affect the regulatory landscape for technology and digital assets. This sentiment sparked a broad-based sell-off, not just in crypto but across traditional equities as well. For a market driven heavily by narrative and sentiment, the Trump-Musk tussle provided a powerful bearish catalyst, spooking investors and triggering the cascade of liquidations that sent Bitcoin and Ethereum prices sharply lower. The event serves as a crucial counterpoint to the bullish technical picture, highlighting how susceptible the crypto market remains to macroeconomic and political shocks, regardless of its own internal fundamentals.
The Bullish Undercurrent: On-Chain Metrics and Institutional Adoption
While the liquidation event painted a picture of chaos and fear, a deeper dive into Ethereum's on-chain data and ecosystem developments reveals a much more optimistic and resilient narrative. These fundamental metrics, which track the health and growth of the network itself, often provide a clearer long-term signal than the noise of short-term price fluctuations.
A Thriving and Growing Network
One of the most reliable indicators of a blockchain's long-term value is its network activity. On this front, Ethereum is showing undeniable strength. The number of unique active addresses interacting with the blockchain has been on a steady rise. Recent data shows a significant surge, with weekly active addresses surpassing 17 million, a testament to growing engagement and adoption. This isn't just speculative trading; it reflects genuine usage across Ethereum's vast ecosystem, including decentralized finance (DeFi), non-fungible tokens (NFTs), and Layer 2 scaling solutions.
Furthermore, the growth in new users joining the network is a powerful leading indicator of future demand. The rate of new address creation has been on an upward trajectory, signaling that Ethereum's value proposition continues to attract a broader audience. This organic growth is the lifeblood of any network, creating a flywheel effect: more users attract more developers, who build more valuable applications, which in turn attract even more users.
The Rise of Layer 2 and Technological Upgrades
A key driver of this network growth has been the maturation of Layer 2 scaling solutions like Arbitrum, Optimism, and Base. These networks handle transactions off the main Ethereum chain, allowing for faster speeds and dramatically lower fees while still inheriting Ethereum's security. The explosion of activity on these Layer 2s has been a game-changer, alleviating congestion on the main network and making Ethereum accessible to a wider range of users and applications.
Simultaneously, core protocol upgrades continue to enhance Ethereum's capabilities. The recent Pectra upgrade, for example, has improved scalability and further refined the network's deflationary mechanics. Since the implementation of EIP-1559, a portion of every transaction fee is "burned," or permanently removed from circulation. This, combined with the vast amount of ETH locked in staking contracts, creates a dynamic where the supply of available ETH is constantly shrinking. This principle of decreasing supply coupled with increasing demand is a fundamental recipe for long-term price appreciation.
The Arrival of Institutional Capital
Perhaps the most significant bullish development for Ethereum in recent times has been the approval and successful launch of spot Ethereum ETFs in the United States. This provides a regulated and accessible on-ramp for institutional investors to gain exposure to ETH, unlocking a potential wave of new capital. The early data is promising. In May 2025 alone, spot Ethereum ETFs recorded net inflows of over half a billion dollars, a sharp increase from the previous month.
This institutional validation is a powerful signal. It signifies that some of the world's largest financial players view Ethereum not just as a speculative asset, but as a foundational technology with long-term strategic value. This flow of "sticky" institutional money is expected to provide a strong support floor for the price and reduce volatility over the long run.
The Whale Watch: Accumulation and Confidence
The behavior of "whales"—large holders of Ethereum—provides another crucial, albeit sometimes conflicting, layer of insight. On one hand, there have been reports of significant accumulation by these large players. Data shows massive transfers of ETH from exchanges to private wallets, a classic sign of long-term holding, as it reduces the immediately available supply for selling. One notable transaction involved Galaxy Digital moving hundreds of millions of dollars worth of ETH into a private wallet, suggesting strong institutional confidence. Over the past month, data from on-chain analytics firms has shown that whale wallets have increased their holdings, while retail holdings have slightly decreased, a pattern often seen before a bullish market run.
However, the picture is not entirely one-sided. There have also been instances of long-term whales selling off portions of their holdings, contributing to short-term price drops. This reflects the diverse strategies among large holders. Some may be taking profits, while others are positioning for a long-term hold. Despite the mixed short-term signals, the broader trend appears to be one of accumulation and a net outflow of ETH from exchanges, which is a fundamentally bullish indicator. With exchange balances hitting seven-year lows, the potential for a supply squeeze is becoming increasingly real.
Conclusion: Navigating the Storm Towards a Bullish Horizon
So, is Ethereum back in business? The evidence suggests a resounding, if complex, "yes." The current market environment is a fascinating juxtaposition of short-term turmoil and long-term strength. The public spat between Trump and Musk, and the subsequent $800 million liquidation event, underscore the market's vulnerability to sudden shocks and the perils of leveraged trading. These events serve as a healthy dose of caution, reminding investors that the path forward will undoubtedly be volatile.
However, when we look past the immediate noise, the underlying picture is one of robust and accelerating health. The Morningstar pattern on the monthly chart provides a powerful technical signal that a macro trend reversal is underway, suggesting that the recent period of bearish sentiment has exhausted itself. This technical optimism is strongly supported by fundamentals. Ethereum's network is growing at a remarkable pace, fueled by the success of Layer 2 solutions and continuous protocol improvements that enhance its scalability and economic model.
The most compelling evidence, however, comes from the demand side. The launch of spot Ethereum ETFs has opened the floodgates for institutional capital, a structural shift that will likely define Ethereum's market for years to come. This, combined with the steady accumulation by whales and a shrinking available supply due to burning and staking, creates a powerful bullish cocktail.
Ethereum is navigating a perfect storm of conflicting signals. The violent waves of short-term liquidations and political drama can be disorienting. But beneath the surface, the deep currents of network growth, technological innovation, and institutional adoption are flowing strongly in one direction. For investors who can look beyond the immediate horizon, the story told by Ethereum's fundamentals, supported by classic bullish chart patterns, is not just one of being "back in business"—it's a story of a platform solidifying its position as a cornerstone of the decentralized future.

ETH 2025: $3000 is Key to Escaping Ethereum's Consolidation TrapEthereum (ETH) May Remain Consolidated Throughout 2025 if it Fails to Hit $3000: Here’s Why!
May 27, 2025 – Ethereum (ETH), the world's second-largest cryptocurrency, finds itself at a critical juncture. After a period of significant volatility and notable gains, ETH's price has entered a prolonged consolidation phase. While numerous bullish signals point towards a potential surge, a formidable barrier stands at the $3000 mark. Failure to decisively conquer this level could see Ethereum locked in a sideways trading pattern throughout much of 2025, deferring hopes of a new explosive bull run. This article delves into the intricate factors dictating Ethereum's price trajectory, exploring the tug-of-war between bullish aspirations and the stubborn realities of market resistance.
Section 1: The Current State of Ethereum - A Prolonged Consolidation
As of late May 2025, Ethereum continues to trade within a defined range, struggling to make a sustained break in either direction. The price has been attempting to pierce pivotal resistance zones, with recent attempts this month failing to hold despite decent volume. Some market observers note that Ethereum is currently consolidating between the $2,400 and $2,750 range. This period of consolidation is not unusual in cryptocurrency markets, often representing a "breather" after significant price movements or a period of price discovery as market participants digest new information and sentiment.
Historical chart patterns suggest that Ethereum may have entered a crucial price range, an "accumulation zone," which could prevent a significant breakout for several months. Certain technical indicators, which help identify trends when growth rates fluctuate, show ETH price entering bands that have historically preceded consolidation periods, sometimes lasting nearly a year, before the next major bullish wave. Given that ETH has already consolidated for approximately four months, another similar period could be on the horizon if key resistance levels are not breached.
This consolidation is a focal point for investors and analysts alike. On one hand, it can be seen as a period of building strength before the next upward move. On the other, prolonged consolidation can lead to investor fatigue and a potential drift lower if bullish catalysts fail to materialize. The market is currently in a state of anticipation, closely watching for signals that could indicate the end of this sideways movement. Ethereum's price is currently hovering in the mid-$2,500s, recovering slightly after brief consolidation and respecting key support levels.
Section 2: The $3000 Hurdle - A Critical Inflection Point
The $3000 level for Ethereum is more than just a number; it represents a significant psychological and technical barrier. A decisive break above this level would likely instill strong bullish sentiment, potentially paving the way for further gains towards previous highs and beyond. Conversely, a repeated failure to surmount $3000 could confirm the strength of the resistance, leading to a loss of upward momentum and an extended period of consolidation throughout 2025.
Market sentiment often coalesces around such round numbers. A breakthrough can trigger a fear of missing out, attracting fresh capital. Failure, however, can lead to disappointment and profit-taking, reinforcing the consolidation range. As of May 2025, ETH is expected by some to trade between $2,400 and $2,900, with a monthly close above $2,750 strengthening the case for retesting $3,000 in the coming quarter. Some projections suggest ETH might hover near the $3000 resistance in the summer months, potentially seeing profit-taking before a new range is established. If ETH fails to rise above the ascending trend line it has held since mid-2022, and with technicals like a potential bearish "Death Cross" (where a shorter-term moving average crosses below a longer-term moving average on weekly charts), the price could remain restricted below $2500 for a while, making the $3000 target even more challenging in the near term.
Section 3: Bullish Signals Amidst Consolidation - The Hope for a Breakout
Despite the consolidation, several bullish signals offer hope for an eventual breakout and a more dynamic 2025 for Ethereum.
Altseason Hopes
The term "altseason" refers to a market phase where alternative cryptocurrencies (altcoins) experience significant price surges, often outperforming Bitcoin. Ethereum, as the leading altcoin, plays a crucial role in signaling or even triggering such a season.
Recent technical analysis suggests that Ethereum has reclaimed a key technical level – the mid-line of a significant channel indicator on the two-week chart. This moving average-based band tracks long-term momentum. Historically, closing above this mid-line has preceded sharp price gains for ETH and marked the start of altseasons. For instance, after surpassing this mid-line in 2020-2021, ETH rallied dramatically. A similar pattern in late 2023 saw ETH climb significantly within a year. As of May 2025, the upper band of this channel represents the next significant resistance. A breakout above this could target previous cycle highs.
The impact on the broader altcoin market has also been historically significant. The combined market cap of altcoins (excluding ETH) surged considerably over a year after Ether's close above this channel's midline in past cycles. Some analysts suggest that ETH reaching certain key levels could signal the potential onset of an alt season.
Bitcoin Dominance and Altcoin Market Cap
The prospect of a 2025 altseason is further supported by patterns related to Bitcoin dominance – Bitcoin's market share of the total crypto market capitalization. Historically, after Bitcoin halvings, Bitcoin dominance tends to drop sharply, triggering altcoin rallies. This was observed in previous post-halving periods. With the latest halving in April 2024, a similar period is approaching, and a decline in Bitcoin dominance could occur within the next few months. If this trend repeats, some market observers anticipate the altcoin market cap could surge toward substantially higher figures. A falling Bitcoin dominance implies that capital is shifting from Bitcoin to altcoins, making them the market's primary focus.
Technical Formations
Several bullish technical patterns are currently visible on Ethereum's charts:
• Ascending Triangle: Ethereum's price action has been forming an ascending triangle pattern, characterized by a horizontal resistance level and a rising support line. This pattern typically indicates that buyers are gaining strength, pushing prices to higher lows against a flat resistance. A breakout above the horizontal resistance of this pattern could lead to a significant upward move.
• Inverse Head and Shoulders: Some analysts have identified an inverse head and shoulders pattern on daily trading charts, a classic bullish reversal pattern. The neckline of this pattern is cited around the $2,700 mark. A decisive close above this level could confirm the breakout, with an immediate target of $3,000.
• Bull Flag: On the daily chart, Ethereum appears to be forming a bull flag pattern, which is a bullish continuation pattern that typically follows a strong rally. The current sideways price action forms the flag, and a breakout could lead to a significant price increase.
• Bullish Market Structure: Despite the consolidation, the broader market structure for Ethereum can still be interpreted as bullish, with the potential for consecutive higher highs and higher lows to remain intact if key support levels hold. ETH trading above its key Exponential Moving Averages (EMAs) indicates a strong technical structure.
Analyst Sentiment
Market observers are cautiously optimistic, with many eyeing the $3,000 level as the next major milestone. Some predict that if Ethereum stays above $2,550, a breakout toward higher levels is likely in the near term. Holding above $2,500 is seen as crucial. If bullish momentum persists and broader crypto sentiment remains favorable, ETH could target the $4,000–$4,500 range later in 2025. Institutional interest, evidenced by spot Ether ETFs attracting inflows and Ethereum's growing market capitalization, also underpins a positive outlook.
Section 4: The Bearish Undertones - Risks and Fragility
Despite the array of bullish signals, Ethereum's path is not without significant obstacles and inherent fragilities.
Substantial Supply Near Cost Basis
A concerning factor highlighted by on-chain data is the substantial amount of Ethereum supply acquired near the current price levels. Analysis of blockchain data indicates that a very large volume of ETH supply, valued in the tens of billions of dollars, is near its cost basis and at risk of flipping into a loss if prices dip. This creates a precarious situation. If ETH's price were to fall below these investors' average acquisition price, it could trigger a wave of selling as holders try to minimize losses or break even. This sell-side pressure could exacerbate any downward trend or prolong the consolidation phase. There is also a significant cluster of investor cost-basis distribution around the $2,800 price level, implying potential sell-side pressure as ETH approaches this zone from investors looking to offload assets near breakeven.
Stubborn Resistance Levels
Ethereum is currently coiling under significant resistance. The $2,700 level has proven to be a formidable barrier, with ETH facing rejections multiple times in May. This level represents a key hurdle for bulls. Failure to convincingly break above $2,700, and subsequently $2,800 and the ultimate $3,000 target, could see selling pressure intensify. Each failed attempt can strengthen the perception of these levels as a ceiling, encouraging more traders to sell at these points.
Macroeconomic and Market-Wide Factors
The broader cryptocurrency market is susceptible to macroeconomic headwinds. Factors such as interest rate policies from central banks, regulatory developments, and global economic stability can significantly impact investor sentiment and capital flows into riskier assets like cryptocurrencies. While some anticipate potential interest rate cuts later in 2025 which could be bullish, ongoing quantitative tightening could pose a challenge. Bitcoin's dominance, while potentially set to fall, has also surged in early 2025, overshadowing altcoins for a period and reflecting a "risk-off" environment at times. Any negative shifts in these broader conditions could dampen Ethereum's breakout prospects, regardless of its specific technical or on-chain signals.
Section 5: Why Failure to Hit $3000 Could Mean Extended Consolidation in 2025
The $3000 mark is a critical psychological and technical threshold for Ethereum. Should the cryptocurrency fail to breach this level decisively in the coming months, several factors could contribute to an extended period of consolidation throughout 2025.
• Loss of Upward Momentum: A failure to achieve a widely anticipated price target like $3000 can significantly dampen investor enthusiasm. Bullish momentum is often self-reinforcing; when it stalls at a major resistance, the energy can dissipate, leading to a more cautious or bearish sentiment. Traders who bought in anticipation of a breakout might exit their positions, adding to selling pressure.
• Strengthening of Resistance: Each time a price level like $3000 (or even preceding levels like $2,700-$2,800) successfully repels an upward advance, it becomes a more established and psychologically potent resistance zone. More market participants will view it as a ceiling, placing sell orders around it, thus making future breakouts even more difficult.
• Capital Rotation: If Ethereum's price remains stagnant while other cryptocurrencies or asset classes show more promising returns, capital may flow out of ETH. Investors are constantly seeking the best risk-adjusted returns, and a prolonged consolidation in ETH could lead them to look for opportunities elsewhere in the dynamic crypto space or even in traditional markets.
• Investor Fatigue and Profit-Taking: Extended periods of sideways movement can lead to investor fatigue. Those who have been holding ETH through the consolidation might become impatient and decide to sell, either to lock in existing profits (if any) or to free up capital for other ventures. This is particularly true for the significant portion of supply bought near current price levels, where the desire to break even can lead to selling pressure if upward momentum wanes.
• Confirmation of Historical Patterns: As mentioned earlier, historical chart patterns suggest that Ethereum can enter extended consolidation phases before major bull runs. A failure to break $3000 would align with these historical precedents, suggesting that the market might indeed be settling in for a longer period of range-bound trading.
• Impact on "Altseason" Narrative: Ethereum's performance is often seen as a bellwether for the broader altcoin market. If ETH struggles to break key resistance and enter a clear uptrend, it could delay or diminish the prospects of a widespread "altseason," further contributing to a more subdued market environment for ETH itself.
Essentially, a failure at $3000 would signal that the current buying pressure is insufficient to overcome the selling interest at that level. This equilibrium could persist for an extended period, leading to the price oscillating within a defined range as bulls and bears remain in a deadlock. Until a significant catalyst emerges – be it a major network upgrade with immediate perceived value, a shift in macroeconomic conditions, or a surge in institutional demand that overwhelms sellers – Ethereum could find itself tracing a path of consolidation through 2025.
Section 6: Scenarios for 2025
Looking ahead, Ethereum's trajectory in 2025 largely hinges on its ability to overcome the current consolidation and the critical $3000 resistance. Several scenarios could unfold:
Scenario 1: Breaching $3000 and Igniting a Bull Run
This is the optimistic scenario favored by many ETH proponents.
• The Breakout: Ethereum successfully smashes through the $2,700-$2,800 resistance zone and then decisively conquers the $3000 psychological barrier. This breakout would likely be accompanied by a surge in trading volume, confirming strong buying interest.
• Targets: Once $3000 is overcome, analysts eye targets such as $3,200, $3,500-$3,600, and previous cycle highs around $4,100. Some even more bullish long-term predictions based on chart patterns suggest significantly higher targets if momentum is sustained.
• Altseason Trigger: A strong ETH rally, particularly one driven by reclaiming key technical levels, could indeed trigger a wider altseason. This would see significant capital flow into other altcoins, potentially leading to a massive altcoin market cap surge if Bitcoin dominance concurrently falls.
• Market Sentiment: Overall market sentiment would turn decisively bullish, fueled by positive price action and the realization of long-awaited breakouts. Institutional interest would likely further increase.
Scenario 2: Failure at $3000 and Continued Consolidation Throughout 2025
This scenario represents the central thesis of this article – a prolonged period of sideways trading.
• The Rejection: Ethereum makes attempts to break $3000 (or even struggles to consistently hold above $2700-$2800) but is repeatedly met with strong selling pressure. The price fails to establish a sustained uptrend above these key levels.
• Trading Range: ETH would likely continue to trade within a familiar range, potentially bounded by support levels around $2,300-$2,500 and resistance capping gains below $3000. This range could persist for a significant portion of 2025.
• Investor Sentiment: Investor sentiment would likely become mixed and potentially frustrated. While long-term believers might continue to accumulate, shorter-term traders could become disengaged due to a lack of volatility and clear direction. The "wait-and-see" approach would dominate.
• Impact on Altcoins: A stagnant Ethereum could dampen enthusiasm for a broad altseason, leading to more selective and narrative-driven gains in the altcoin market rather than a widespread euphoric rally.
Scenario 3: A Bearish Breakdown
While many signals are bullish or neutral (consolidating), a bearish breakdown remains a possibility, especially if broader market conditions deteriorate or if key supports fail.
• Support Failure: Key support levels, such as $2,450, $2,300, or even the psychological $2,000 mark, are breached decisively. This could be triggered by the large supply near cost basis flipping into loss and causing a cascade of selling.
• Negative Catalysts: This scenario could be exacerbated by negative macroeconomic news, stringent regulatory actions, or unforeseen issues within the Ethereum ecosystem.
• Price Action: A bearish breakdown would see Ethereum enter a downtrend, potentially revisiting lower support levels from previous market cycles. Technical indicators like a "Death Cross" on weekly charts, if confirmed, would add to bearish sentiment.
• Market Sentiment: Fear and uncertainty would grip the market, leading to a flight to safety, possibly increasing Bitcoin dominance or a move towards stablecoins.
•
The most probable outcome will depend on a confluence of technical breakouts, fundamental developments within the Ethereum ecosystem (like the impact of future upgrades), institutional adoption trends, and the overarching macroeconomic environment.
Section 7: Conclusion
Ethereum stands at a pivotal moment in May 2025. The allure of a significant rally towards $4,000 and beyond, potentially heralding a new altseason, is palpable, supported by historical precedents and bullish chart patterns. However, the path is fraught with challenges, most notably the formidable psychological and technical resistance clustered around the $2,700 to $3,000 levels.
The current consolidation phase, while potentially a healthy accumulation period, also carries the risk of morphing into prolonged stagnation if upward momentum cannot be decisively seized. The significant volume of ETH supply hovering near its cost basis presents a tangible threat, where a dip could trigger further selling pressure, reinforcing the consolidation or even leading to a decline.
Therefore, the central thesis holds considerable weight: should Ethereum fail to convincingly breach the $3000 mark in the coming months, it is highly plausible that the cryptocurrency could remain locked in a consolidative pattern for much of 2025. This would test the patience of investors and potentially delay the much-anticipated fireworks of a full-blown altseason.
The cryptocurrency market is notoriously dynamic and influenced by a myriad of unpredictable factors. While technical analysis and on-chain data provide valuable insights, they are not infallible crystal balls. Investors and traders must remain vigilant, continuously reassessing the evolving landscape, managing risk, and preparing for various potential outcomes as Ethereum navigates this critical juncture. The battle for $3000 will likely define ETH's narrative for the remainder of the year.

Ethereum Golden Cross: ETH Eyes $3,000 BreakoutEthereum Flashes Golden Cross: A Bullish Beacon or a Fleeting Glimmer for the $3,000 Target?
The cryptocurrency market is once again abuzz with technical signals, and this time, Ethereum (ETH), the second-largest cryptocurrency by market capitalization, is in the spotlight. Traders and analysts are keenly observing a "Golden Cross" that has recently manifested on Ethereum's price charts. This classic bullish indicator has historically been associated with potential upward momentum, igniting discussions and hopes among investors: could this be the catalyst that propels ETH bulls to conquer the coveted $3,000 price level?
Understanding the Golden Cross: A Primer
Before diving into Ethereum's specific prospects, it's crucial to understand what a Golden Cross signifies. In technical analysis, a Golden Cross occurs when a shorter-term moving average (MA) of an asset's price crosses above a longer-term moving average. Most commonly, this involves the 50-day moving average (50-MA) moving above the 200-day moving average (200-MA).
The rationale behind its bullish interpretation is straightforward: the 50-MA reflects the average price over the last 50 trading days, representing recent momentum. The 200-MA, on the other hand, represents the longer-term trend. When the shorter-term momentum (50-MA) surpasses the longer-term trend (200-MA) from below, it suggests that the recent buying pressure and positive price action are strong enough to potentially shift the overall market sentiment and initiate a more sustained uptrend.
However, it's vital to approach this signal with a degree of caution. The Golden Cross is a lagging indicator, meaning it confirms a trend that has already been underway for some time, rather than predicting a future one with certainty. By the time a Golden Cross appears, a significant portion of the initial upward move might have already occurred. Furthermore, like all technical indicators, it's not infallible. False signals can happen, where a Golden Cross appears but fails to lead to a sustained rally, sometimes even preceding a market downturn. Therefore, while a Golden Cross is a positive sign, it’s best used in conjunction with other indicators and a broader market analysis.
Ethereum's Current Landscape and the Significance of the Signal
For Ethereum, the appearance of a Golden Cross is a noteworthy development, especially considering its price action in recent months. After periods of consolidation and navigating broader market uncertainties, such a signal can inject a fresh wave of optimism. It often attracts trend-following traders and algorithms programmed to react to such patterns, potentially increasing buying pressure.
The journey towards $3,000 for Ethereum is not just a numerical target; it represents a significant psychological level. Reclaiming this mark would signify a strong recovery and could pave the way for further exploration of higher price territories. The Golden Cross, in this context, acts as a technical validation for bulls who believe in Ethereum's underlying fundamentals and its potential for growth.
Factors Fueling the Bullish Case for ETH to $3,000
Several factors, beyond the Golden Cross itself, could support a bullish push for Ethereum towards the $3,000 milestone:
1. Strong Network Fundamentals: Ethereum continues to be the dominant smart contract platform, hosting the vast majority of decentralized finance (DeFi) applications, non-fungible tokens (NFTs), and a burgeoning ecosystem of Layer 2 scaling solutions. Ongoing development, such as progress on future upgrades aimed at enhancing scalability and efficiency (like proto-danksharding with EIP-4844), bolsters long-term confidence.
2. The Impact of "The Merge" and Staking: The transition to a Proof-of-Stake (PoS) consensus mechanism (The Merge) has fundamentally changed Ethereum's tokenomics. It significantly reduced new ETH issuance and, coupled with the EIP-1559 fee-burning mechanism, has often made ETH deflationary during periods of high network activity. The growth in staked ETH, which secures the network and earns rewards for stakers, also reduces the liquid supply available on exchanges, potentially creating upward price pressure.
3. Layer 2 Scaling Solutions Gaining Traction: Solutions like Arbitrum, Optimism, zkSync, and StarkNet are increasingly handling a significant portion of Ethereum's transaction load. This alleviates congestion on the mainnet, reduces gas fees for users interacting with these Layer 2s, and improves the overall user experience, making the Ethereum ecosystem more attractive and scalable. As these solutions mature and gain wider adoption, they enhance Ethereum's value proposition.
4. Renewed Institutional Interest: While institutional adoption of crypto can be cyclical, a clear bullish signal like a Golden Cross, combined with improving macroeconomic conditions or regulatory clarity, could reignite interest from larger financial players looking for exposure to digital assets beyond Bitcoin. Ethereum's utility and its role as a platform for decentralized applications make it an attractive candidate for institutional portfolios.
5. Positive Market Sentiment: The cryptocurrency market is heavily influenced by sentiment. A Golden Cross can contribute to a positive feedback loop: the signal encourages buying, which pushes prices up, further reinforcing bullish sentiment and attracting more participants. If Bitcoin, the market leader, also shows strength, it often creates a favorable environment for altcoins like Ethereum to rally.
6. Growing NFT and DeFi Ecosystems: Despite market fluctuations, innovation within the NFT and DeFi sectors on Ethereum continues. New use cases, improved user interfaces, and greater mainstream adoption of these technologies can drive demand for ETH, which is used to pay for transactions and interact with these applications.
Potential Headwinds and Obstacles on the Path to $3,000
Despite the optimism generated by the Golden Cross, several challenges could hinder Ethereum's ascent to $3,000:
1. Macroeconomic Uncertainty: Broader economic factors, such as inflation rates, interest rate policies by central banks, and geopolitical events, can significantly impact risk assets, including cryptocurrencies. A deteriorating macroeconomic outlook could dampen investor appetite and stall any potential rally.
2. Regulatory Scrutiny: The regulatory landscape for cryptocurrencies remains a significant unknown in many jurisdictions. Unfavorable regulations or enforcement actions targeting Ethereum, DeFi, or staking could negatively impact its price.
3. Technical Resistance Levels: The path to $3,000 is likely to encounter several technical resistance levels where selling pressure might increase. Traders will be closely watching these zones, and failure to break through them decisively could lead to pullbacks.
4. Profit-Taking: As the price of ETH rises, especially after a significant signal like a Golden Cross, traders who bought at lower levels may decide to take profits, creating selling pressure that needs to be absorbed by new buyers for the uptrend to continue.
5. Competition: While Ethereum is the dominant player, it faces ongoing competition from other Layer 1 blockchains (e.g., Solana, Avalanche, BNB Chain) that also aim to offer scalable smart contract platforms. Significant advancements or adoption shifts towards competitors could impact Ethereum's market share and sentiment.
6. The "False Signal" Risk: As mentioned earlier, no technical indicator is perfect. The Golden Cross could prove to be a false signal if broader market conditions turn bearish or if unforeseen negative catalysts emerge.
Conclusion: A Promising Signal, But Prudence is Key
The appearance of a Golden Cross on Ethereum's charts is undeniably a positive development that warrants attention. It provides a technical basis for bullish optimism and could indeed be a contributing factor if ETH is to make a sustained push towards the $3,000 mark. The combination of this signal with Ethereum's strong network fundamentals, ongoing technological advancements, and the deflationary pressures from its tokenomics paints a compelling picture for potential price appreciation.
However, investors should approach this scenario with a balanced perspective. The Golden Cross is a piece of the puzzle, not the entire picture. Its predictive power is enhanced when considered alongside other market indicators, fundamental analysis, and the overall macroeconomic environment. While bulls may feel emboldened by this signal, the path to $3,000 will likely involve navigating volatility, overcoming resistance levels, and contending with potential external shocks.
Ultimately, whether Ethereum can leverage this Golden Cross to reach $3,000 will depend on a confluence of factors: sustained buying momentum, continued positive developments within the Ethereum ecosystem, a favorable broader market sentiment, and the absence of significant negative catalysts. For now, the Golden Cross serves as a beacon of hope for ETH holders, but diligent research, risk management, and an awareness of the inherent uncertainties in the crypto market remain paramount.

I see ETH break the trend lineETH owner buy enough coin in their wallet with breaking the descend line.

ETH Surges 20% Post-Pectra: Crypto's Ultimate Comeback?Ether Clocks 'Insane' 20% Candle Post-Pectra — A Turning Point?
The cryptocurrency market witnessed a remarkable event as Ethereum (ETH) surged by an impressive 20% following the successful implementation of the Pectra hard fork. This dramatic price movement has caught the attention of traders, investors, and analysts alike, sparking intense debate about whether this represents a genuine turning point for the second-largest cryptocurrency by market capitalization or merely a temporary respite in a challenging market environment.
The Pectra Catalyst
The Pectra hard fork, representing one of Ethereum's most significant technical upgrades since its transition to proof-of-stake, was successfully implemented in early 2025. This upgrade introduced crucial improvements to the Ethereum network, including enhanced transaction processing efficiency, reduced gas fees, and expanded smart contract functionality.
Unlike previous upgrades that sometimes resulted in "buy the rumor, sell the news" reactions, Pectra's implementation appears to have triggered substantial positive price action. The 20% candle marked Ethereum's largest single-day gain in over 18 months, propelling ETH past the crucial $1,900 resistance level that had previously acted as a ceiling for price movements.
The timing of the upgrade coincided with increasing institutional interest in Ethereum, creating perfect conditions for a significant price movement. Data from on-chain analytics platforms indicates that large wallet addresses began accumulating ETH in the weeks leading up to Pectra, suggesting informed capital was positioning ahead of the technical catalyst.
Institutional Buying Signals
On-chain metrics reveal compelling evidence of institutional participation in Ethereum's recent surge. Blockchain analytics firm Glassnode reported a substantial increase in large-value transactions exceeding $1 million in the 72 hours surrounding the Pectra implementation, with transaction volume reaching levels not seen since late 2023.
Several key metrics support this institutional narrative:
1. Exchange outflows have accelerated, with over 200,000 ETH leaving centralized exchanges in a single 48-hour period post-Pectra, indicating buyers intend to hold rather than trade.
2. The number of addresses holding more than 1,000 ETH increased by 2.8% in just one week, representing substantial accumulation by wealthy entities.
3. Futures open interest has expanded by over $2 billion since the Pectra announcement, demonstrating increased leveraged positioning.
4. Options markets show a significant skew toward calls, with the put/call ratio reaching its lowest level in 14 months.
These metrics collectively suggest that smart money sees the Pectra upgrade as a legitimate inflection point for Ethereum rather than a temporary technical bounce.
The Long Position Explosion
Perhaps most intriguing is the dramatic increase in long positions across various trading platforms. Data from cryptocurrency derivatives exchanges shows that long-to-short ratios have reached levels not seen since Ethereum's previous major bull run in 2021.
This positioning dynamic creates an interesting technical setup where further price increases could trigger a positive feedback loop as short sellers are forced to cover their positions, potentially accelerating ETH's upward movement.
Retail Sell-Off vs. Whale Accumulation
A fascinating dynamic has emerged in Ethereum's market structure: while retail investors appear to be reducing exposure, larger entities ("whales") are aggressively accumulating. This divergence in behavior between market participants has created an unusual tension in ETH's price action.
Blockchain analytics firm Santiment reported that addresses holding between 0.1 and 10 ETH have decreased their collective holdings by approximately 3% over the past month, indicating retail profit-taking or repositioning. Simultaneously, addresses holding over 1,000 ETH have increased their positions by nearly 7%.
This pattern often emerges during major market transitions, where retail participants, scarred by previous drawdowns, remain skeptical of recovery signals while institutional investors position for longer-term trends based on fundamental catalysts.
This dynamic creates an interesting market structure where future price movements may depend on which cohort ultimately proves correct in their assessment of Ethereum's prospects.
Technical Breakout Analysis
From a technical analysis perspective, Ethereum's 20% surge represents a significant breakout from multiple resistance levels that had contained price action for months. The move pushed ETH decisively above its 200-day moving average, a key indicator watched by trend-following traders.
The volume profile accompanying the move also supports the legitimacy of the breakout, with transaction volume reaching its highest level in nine months. This high-volume breakout typically indicates strong conviction behind the price movement rather than a technical fake-out.
Additionally, the Relative Strength Index (RSI), while showing overbought conditions in the short term, has broken out of a long-term downtrend on higher timeframes, suggesting potential for sustained momentum despite possible near-term consolidation.
Macro Context and Ethereum's Narrative Shift
Ethereum's dramatic move occurs against a complex macroeconomic backdrop that had previously contributed to crypto market weakness. Recent signals of potential monetary policy shifts, including discussions of rate cuts by central banks, have created a more favorable environment for risk assets broadly.
Beyond pure price action, Ethereum's narrative has evolved considerably in recent months. After facing criticism regarding high transaction fees and scaling limitations, the successful implementation of Pectra addresses several key concerns that had dampened enthusiasm for the network.
The upgrade's focus on reducing gas fees and improving transaction throughput directly counters the competitive threats from alternative Layer 1 and Layer 2 solutions that had been gaining traction by positioning themselves as more efficient alternatives to Ethereum.
This narrative rehabilitation, combined with Ethereum's established network effects and developer ecosystem, creates compelling fundamental support for the recent price action.
Sustainability Questions and Potential Challenges
While enthusiasm surrounding Ethereum's post-Pectra surge runs high, significant questions remain regarding the sustainability of this momentum. Several potential challenges could impact ETH's trajectory in the coming months:
1. Technical Overextension: The speed and magnitude of the 20% move have pushed short-term technical indicators into overbought territory, potentially setting up conditions for a correctional pullback.
2. Regulatory Uncertainty: The evolving regulatory landscape for cryptocurrencies, particularly regarding potential security classifications and staking activities, continues to create background uncertainty for Ethereum.
3. Competitive Pressures: Despite Pectra's improvements, alternative blockchains continue to innovate rapidly, potentially challenging Ethereum's dominance in specific use cases.
4. Macro Reversal Risk: Any shift back toward hawkish monetary policy could negatively impact risk assets broadly, potentially including Ethereum despite its technological progress.
5. Execution Risk: While Pectra's implementation was successful, future technical upgrades still carry execution risk that could impact market confidence.
Conclusion: A Genuine Turning Point?
As market participants attempt to determine whether Ethereum's "insane" 20% candle represents a genuine turning point or a temporary deviation, the weight of evidence increasingly suggests this could indeed mark a significant inflection point in ETH's market cycle.
The confluence of technical breakouts, on-chain accumulation signals, derivative positioning, and fundamental improvements through the Pectra upgrade creates a compelling case for sustained momentum. The divergence between retail selling and institutional accumulation further supports the notion that a meaningful market transition may be underway.
However, sustainable price appreciation will likely require continued technical execution, expanding adoption metrics, and at minimum, a neutral macro environment that doesn't actively handicap risk assets.
For investors and traders, the coming weeks will be crucial in determining whether Ethereum can build upon this momentum or if the surge represents another false dawn in a challenging market. But regardless of short-term price action, the successful implementation of Pectra unquestionably strengthens Ethereum's long-term value proposition as a leading blockchain infrastructure platform.


Warning: Low Ethereum Target LoomsThe Unthinkable Target: Is $1,000 ETH Really in Play?
Suggesting Ethereum could fall back to $1,000 might seem hyperbolic to those who remember its peak near $5,000. However, the crypto market is notorious for its brutal volatility and deep drawdowns. Bitcoin itself has experienced multiple corrections exceeding 80% from its all-time highs throughout its history. While Ethereum has matured significantly, it's not immune to severe market downturns or shifts in narrative dominance.
A $1,000 price target represents a roughly 65-70% decline from prices seen in early-to-mid 2024 (assuming a starting point around $3,000-$3,500) and an approximate 80% drop from its all-time high. While drastic, such a move could become plausible under a confluence of negative circumstances:
1. Severe Macroeconomic Downturn: A deep global recession, coupled with sustained high interest rates or a major credit event, could trigger a massive risk-off wave across all assets, hitting speculative investments like crypto particularly hard.
2. Regulatory Crackdown: Punitive regulations targeting DeFi, staking, or specific aspects of Ethereum's ecosystem could severely damage sentiment and utility.
3. Technological Stagnation or Failure: Major setbacks in Ethereum's scaling roadmap or the discovery of a critical vulnerability could erode confidence.
4. Sustained Loss of Narrative: If competing blockchains definitively capture the dominant narrative for innovation, speed, and cost-effectiveness, ETH could lose its premium valuation.
5. Technical Breakdown: A decisive break below key long-term support levels (like the previous cycle highs around $1,400 or psychological levels like $2,000) could trigger cascading liquidations and stop-loss orders, accelerating the decline towards lower supports, including the $1,000 vicinity which acted as significant resistance/support in previous cycles.
While not a base-case prediction for many, the $1,000 target serves as a stark reminder of the potential downside if the current negative pressures persist and intensify, particularly within a broader bear market context. The factors currently driving ETH's weakness provide fuel for this bearish contemplation.
Reason 1: The Underwhelming Arrival of Spot Ethereum ETFs
Following the monumental success of Spot Bitcoin ETFs in the US, which attracted tens of billions in net inflows within months of launch, expectations were sky-high for their Ethereum counterparts. The narrative was compelling: regulated, accessible vehicles would unlock a floodgate of institutional capital, mirroring Bitcoin's ETF-driven price surge.
However, the reality has been starkly different and deeply disappointing for ETH bulls. Since their launch, Spot Ethereum ETFs have witnessed tepid demand, characterized by weak inflows and, at times, even net outflows. The initial excitement quickly fizzled out, failing to provide the anticipated buying pressure.
Several factors contribute to this underwhelming debut:
• Pre-Launch Regulatory Uncertainty: The SEC's approval process for ETH ETFs was far less certain and more contentious than for Bitcoin. This lingering ambiguity, particularly around Ethereum's classification (commodity vs. security) and the handling of staking, may have made some large institutions cautious.
• Lack of Staking Yield: Unlike holding ETH directly or through certain other investment products, the approved US Spot ETH ETFs do not currently offer holders exposure to staking yields – a core component of Ethereum's tokenomics and a significant draw for long-term investors. This makes the ETF product inherently less attractive compared to direct ownership for yield-seeking capital.
• Existing Exposure Channels: Institutional players interested in Ethereum already had established avenues for gaining exposure, including futures markets (CME ETH futures), Grayscale's Ethereum Trust (ETHE, although less efficient pre-conversion), and direct custody solutions. The incremental demand unlocked by the spot ETFs may have been smaller than anticipated.
• Market Timing and Sentiment: The ETH ETFs launched into a more challenging macroeconomic environment and a period of cooling sentiment in the broader crypto market compared to the Bitcoin ETF launch window. The initial risk-on euphoria had faded, replaced by concerns about inflation, interest rates, and geopolitical tensions.
• "Sell the News" Event: As often happens in markets, the period leading up to the ETF approval saw significant price appreciation. The actual launch may have triggered profit-taking by traders who had bought in anticipation of the event.
The impact of these weak ETF flows is significant. It signals a lack of immediate, large-scale institutional appetite for ETH through this specific channel, removing a key bullish catalyst that many had banked on. It also contributes to negative market sentiment, reinforcing the narrative that Ethereum is currently out of favor compared to Bitcoin or other trending assets. Without this expected wave of ETF-driven buying, the price is more susceptible to selling pressure from other sources.
Reason 2: Derivatives Market Flashing Red - Low Interest, Negative Funding
The derivatives market, particularly perpetual futures, provides crucial insights into trader sentiment and positioning. Two key metrics are currently painting a bearish picture for Ethereum: Open Interest (OI) and Funding Rates.
• Low Open Interest (OI): Open Interest represents the total number of outstanding derivative contracts (longs and shorts) that have not been settled. While OI naturally fluctuates, consistently low OI relative to historical peaks or compared to Bitcoin's OI suggests a lack of strong conviction and reduced speculative interest in Ethereum. When traders are uncertain or bearish, they are less likely to open large, leveraged positions, leading to subdued OI. This indicates that fewer market participants are willing to bet aggressively on ETH's future price direction, especially on the long side.
• Negative Funding Rates: Funding rates are periodic payments exchanged between long and short position holders in perpetual futures contracts. They are designed to keep the futures price tethered to the underlying spot price.
o Positive Funding: When the futures price trades at a premium to spot (contango) and bullish sentiment dominates, longs typically pay shorts. This incentivizes shorting and disincentivizes longing, helping to pull the prices back together.
o Negative Funding: When the futures price trades at a discount to spot (backwardation) and bearish sentiment prevails, shorts pay longs. This indicates a higher demand for short positions (either speculative shorting or hedging long spot holdings). Consistently negative funding rates, as observed for ETH during periods of weakness, are a strong bearish signal. It means traders are actively paying a premium to maintain short exposure, reflecting widespread pessimism about the price outlook.
•
The combination of low Open Interest and negative Funding Rates creates a negative feedback loop. It shows reduced speculative appetite, a dominance of short positioning, and a lack of leveraged longs willing to drive the price higher. While extremely negative funding can sometimes precede a "short squeeze" (where rising prices force shorts to cover, accelerating the rally), the persistent nature of these conditions recently suggests underlying weakness rather than an imminent explosive reversal. This bearish derivatives landscape acts as a significant headwind, absorbing buying pressure and making sustained rallies difficult.
Reason 3: The Relentless Rise of Competing Layer-1s
Ethereum's primary value proposition has long been its status as the dominant, most secure, and most decentralized platform for smart contracts and decentralized applications (DApps). However, its reign is facing its most significant challenge yet from a growing cohort of alternative Layer-1 (L1) blockchains, often dubbed "ETH Killers."
While Ethereum still dominates in terms of Total Value Locked (TVL) in DeFi and overall network value, competing L1s like Solana, Avalanche, Cardano, and newer entrants are rapidly gaining ground in crucial areas of network activity:
• Transaction Throughput and Fees: Many competitors offer significantly higher transaction speeds (transactions per second) and dramatically lower fees compared to Ethereum's mainnet. While Ethereum's Layer-2 scaling solutions aim to address this, the user experience on some alternative L1s can feel faster and cheaper for certain applications, attracting users and developers.
• Active Users and Daily Transactions: Chains like Solana have, at times, surpassed Ethereum in metrics like daily active addresses and transaction counts, particularly fueled by specific niches like meme coins, high-frequency DeFi, or certain NFT projects. This indicates a migration of user activity seeking lower costs or specific functionalities.
• Developer Activity and Ecosystem Growth: While Ethereum retains a vast developer community, alternative L1s are aggressively courting developers with grants, simpler tooling (in some cases), and the allure of building on the "next big thing." This leads to vibrant DApp ecosystems growing outside of Ethereum.
• Technological Differentiation: Competitors often employ different consensus mechanisms (e.g., Proof-of-History, Avalanche Consensus) or architectural designs that offer trade-offs favoring speed or specific use cases over Ethereum's current approach (though Ethereum's roadmap aims to incorporate many advancements).
The impact of this intensifying competition is multifaceted. It fragments liquidity and user attention across multiple platforms. It challenges the narrative of Ethereum's unassailable network effect. Crucially, it reduces the relative demand for ETH itself, which is needed for gas fees and staking on the Ethereum network. If users and developers increasingly opt for alternative platforms, the fundamental demand drivers for ETH weaken, putting downward pressure on its price relative to these competitors and the market overall. Ethereum is no longer the only viable option for building or using decentralized applications, and this increased competition is clearly impacting its market position and price performance.
The Path to Reversal: What Needs to Change for Ethereum?
Despite the current headwinds and the looming shadow of lower price targets, Ethereum is far from dead. It possesses a resilient community, the largest developer base, significant first-mover advantages, and a comprehensive roadmap for future upgrades. However, a sustainable trend reversal requires tangible progress and shifts across several fronts:
1. ETF Flows Must Materialize: The narrative needs to shift from disappointment to tangible success. This requires sustained, significant net inflows into the Spot ETH ETFs, potentially driven by broader institutional adoption, clearer regulatory frameworks globally, or perhaps future ETF iterations that incorporate staking yields (though regulatory hurdles for this are high).
2. Derivatives Sentiment Needs to Flip: Open Interest needs to build substantially, indicating renewed speculative conviction. More importantly, funding rates need to turn consistently positive, signaling a shift towards bullish positioning and leveraged longs re-entering the market.
3. Successful Execution of Ethereum's Roadmap: Continued progress and successful implementation of Ethereum's scaling solutions are paramount. Wider adoption and tangible impact from upgrades like Proto-Danksharding (EIP-4844) reducing Layer-2 fees, and clear progress towards future milestones like Verkle Trees and Statelessness, are needed to demonstrate Ethereum can overcome its scalability challenges and maintain its technological edge.
4. Reigniting Network Activity and Demand: Ethereum needs compelling new applications or upgrades to existing protocols that drive genuine user demand and increase the consumption of ETH for gas. This could come from innovations in DeFi, NFTs, GameFi, decentralized identity, or other unforeseen areas. The narrative needs to shift back towards Ethereum as the primary hub of valuable on-chain activity.
5. Favorable Macroeconomic Conditions: Like all risk assets, Ethereum would benefit significantly from a broader shift towards risk-on sentiment, potentially fueled by central bank easing (lower interest rates), controlled inflation, and stable global growth.
6. A Renewed, Compelling Narrative: Ethereum needs a clear and powerful story that resonates beyond its existing user base. Whether it's focusing on its superior security and decentralization, its role as the foundational "settlement layer" for the digital economy, or a new killer application, a refreshed narrative is needed to recapture investor imagination and justify a premium valuation.
Conclusion: Ethereum at a Critical Juncture
Ethereum's recent price struggles are not arbitrary; they are rooted in tangible factors: the lackluster performance of its spot ETFs, bearish signals from the derivatives market, and the undeniable pressure from faster, cheaper Layer-1 competitors. These elements combine to create an environment where contemplating a fall towards $1,000, while bearish, is a reflection of the significant challenges the network faces.
However, Ethereum's history is one of resilience and adaptation. It has weathered bear markets, technical hurdles, and competitive threats before. The path back to sustained growth and potentially new all-time highs is challenging but not impossible. It hinges on reigniting institutional interest via ETFs, flipping derivatives sentiment, successfully executing its ambitious technological roadmap to counter competitors, and benefiting from a supportive macro environment. Until these positive catalysts materialize convincingly, Ethereum may continue to lag, and the possibility of further downside, even towards the $1,000 mark in a severe downturn, will remain a topic of discussion among market participants navigating the crypto giant's uncertain future.

ETHUSDT – Eyes on the Green Line!ETHUSDT – Eyes on the Green Line!
“Momentum is building, and all signs point to the next key level—the green line is in play!”
🔥 Key Insights:
✅ Trend Remains Strong – No reason to fade the move.
✅ Green Line = Next Target – That’s where liquidity & reactions will matter.
✅ Pullbacks = Buying Opportunities – No FOMO, we wait for strategic entries.
💡 The Smart Plan:
Look for Dips to Load Up – Volume & CDV should confirm strength.
LTF Breakouts = Strong Entry Signals – Follow structure, not emotions.
Green Line = First Major Resistance – Expect reactions, manage risk accordingly.
“If momentum holds, Ethereum is headed straight for the green line—watch closely!” 🚀🔥
A tiny part of my runners;
💼 STMXUSDT: 2 Buying Areas
🐢 TURBOUSDT: Buy Zones and Buyer Presence
🌍 ICPUSDT.P: Massive Upside Potential | Check the Trade Update For Seeing Results
🟠 IDEXUSDT: Spot Buy Area | %26 Profit if You Trade with MSB
📌 USUALUSDT: Buyers Are Active + %70 Profit in Total
🌟 FORTHUSDT: Sniper Entry +%26 Reaction
🐳 QKCUSDT: Sniper Entry +%57 Reaction

Ethereum Not Dead- i know some peoples think ETH will go to 250$ or 500$, so wait for it...
- I've always maintained that I'm not a fan of ETH because of its scalability limitations and centralization, for that reason ETH needs some messy L1...L2...etc..
- That said, my opinion doesn’t matter much, ETH is here to stay. The Ethereum ecosystem hosts thousands of projects; I’d say it’s too big to fail.
- i used Bitstamp exchange to look further back in the chart's history.
- i simplified this monthly chart so much that even a 10 year old kid could understand it, just check the RSI low levels and compare it with previous years. Again, check the max RSI level for the previous ATHs.
- i won't discuss where to buy because, whether you get ETH at $1,800 or $1,500, the bull run for ETH and Altcoins hasn't started yet.
Happy Tr4Ding !
