ETHUSD Major Bull RetestThe retest is easily observed with the price being above the major bull trend line
Similarities can be seen in the 1,2 annotations
This will be the final retest before major bull activity resumes
Ethereumusd

ETH Sell a break setup.Ethereum - Intraday - We look to Sell a break of 4148 (stop at 4231)
Short term bias has turned negative.
There is no indication that the selloff is coming to an end.
A break of bespoke support at 4150, and the move lower is already underway.
We look for losses to be extended today.
Our profit targets will be 3908 and 3808
Resistance: 4380 / 4460 / 4520
Support: 4250 / 4150 / 4000

ETHUSD Curve and ContinuationA nice curve can be drawn to explain the continuation expected on ETHUSD
This is a portrayal of that curve, which is not on the log chart
ETH still has energy

ETH bull run price targetHello, everyone!
Today I want to introduce the ETH price analysis. Let’s consider it with the Elliott Waves. I suppose that now ETH is in Wave 4 and as you already know, it’s target is between 0.382 and 0.5 Fib retracement for the previous impulse. Thus, if you want to trade ETH, $4000 is a goo buy price.
What is the target? The Wave 5 is incoming and it’s target is 0.61 Fib from the difference between Wave 1 beginning and Wave 3 end, measured from Wave 4 bottom. The anticipated target is next to $6000, in case of altseason it is realistic target. Bitcoin can go sideways this time. Now we don’t see the true divergence with MACD on the daily chart. Trends usually finishes with the divergence on the higher timeframes. I will update analysis when it happens.
DISCLAMER: Information is provided only for educational purposes. Do your own study before taking any actions or decisions at the real market.

Ethereum buy a dip setup.Ethereum - Intraday - We look to Buy at 4461 (stop at 4378)
Daily signals are bullish.
There is no clear indication that the upward move is coming to an end.
20 1day EMA is at 4450.
We look to buy dips.
The previous swing low is located at 4452.
Our profit targets will be 4688 and 4748
Resistance: 4680 / 4780 / 4870
Support: 4520 / 4450 / 4400

Another ETH Scenario ETHUSDW formation price aiming for that 5 point to complete the W
The 50MA is playing a key role on this daily chart, showing consistent bounces off it
It is also within a large ascending channel

ETHUSD Wild scenarioit is quite a high target point
but it does provide a nice channel
Personally I'd exit at 8K

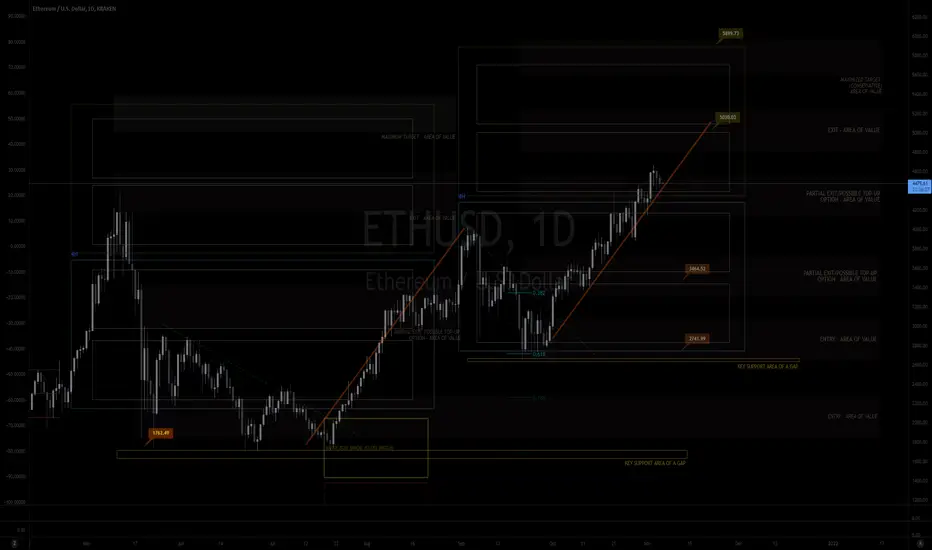
MY MINIMALIST ANALYSIS FOR ETHEREUM$ETHER
ADJUSTED TARGET AREA OF VALUE ON THE CHART
11.06.21
0830H +8 SINGAPORE
Disclaimer:
The findings of the following analysis are the sole opinions of the publisher of this idea and should not be taken as a piece of investment advice.
ALERT:
AN AREA OF OPPORTUNITY FOR A TOP-UP for those who did not PARTIAL EXIT at THE 4.3K USD ATH.
The Market has amazingly moved along the TOPS and BOTTOMS of our BOXES, signifying TURNING POINTS of PRICE ACTION.
Congratulating all those who have climbed the SWING together with me. The MARKET is still very BULLISH and now EXPANDING.
The BULL SEASON for CRYPTOS is dictated by the BULLISH STRENGTH OF PRIMARILY BITCOIN and then ETHEREUM. We still have more room for the UPSIDE.
REMINDER:
INDICATED ARE ENTRIES, PARTIAL EXITS/TOP-UPS, EXITS, and MAXIMIZED AREAS OF VALUE
"FOLLOW THE WHITE RABBIT!"
Just Follow the TOPS and BOTTOMS of the BOXES as a GUIDE where the MARKET will take you.
HOW TO USE THIS MINIMALIST CHART
Created on a MONTHLY, WEEKLY & DAILY Analysis (The Dynamics of the Market.)
It is designed for SWING TRADES at the BOTTOM. I do not SHORT, though, you can still use it.
You can CLICK AND hold THE CHART and PAN or DRAG IT.
TARGET ZONE IDENTIFICATION
The LARGE BOXES (Tops and Bottoms) are MAJOR pivot points that will occur sometime in the future. While the SMALL BOXES (Tops and Bottoms) are MINOR pivot points .
These can be entries to a BUY/ SELL POSITION, EXIT/PARTIAL EXIT/TOP-UP AREAS,
and, if you wish to hold longer for a MAXIMUM TARGET EXIT AREA OF VALUE - CONSERVATIVE (If price action conditions are right at that given moment.)
At times I include WAY BEYOND PARABOLIC Price TARGETS depending on The Character of the Market (CRYPTOS ONLY).
Watch out for your Volume , Chart Patterns, Candlestick Math, FIB COILS ( ABC ), Price Action, FIB LEVELS, Market Dynamics, especially institutional and retailer trading psychology .
Wishing you all The Best Trades and Thank you all for your Appreciation and Support of My Work.
Much thanks to My 3 Mentors. They are so much of a Blessing that I also wish to Share.
Vive Le Autist!
Looking for feedback, ETH KILLING ITI have been trading for about 8 months and i would be bullish on ETH now anyway, but I wanted to know if what I have on my chart is pretty much the starting point, and is correct to laying out these resistance and support areas which can then help you devise you strategy for entering and exiting a trade (provided I am swing trading this in this example....I was initially going to buy in as soon as I saw the price come down and bounce off of what was an area of support around the high 4200s I believe, and head towards this crazy rise it is currently on. That would have been the perfect entry point based on what the price did. My exit probably would have been a bit early because I was going to sell off some profit at a gain of about 25% or so, and I thought I was being greedy! I would have made some money, but would have watched it continue to shoot up....any thoughts from my experienced veteran traders out there? Did what I say make sense? I hope so, and ETH is going up, up, up........good luck guys!

ETH Buy a dip setup.Ethereum - Intraday - We look to Buy at 4216 (stop at 4137)
Daily signals are bullish.
There is no clear indication that the upward move is coming to an end.
Dips continue to attract buyers.
We look to buy dips.
50 4hour EMA is at 4210.
Our profit targets will be 4439 and 4489
Resistance: 4380 / 4460 / 4500
Support: 4300 / 4200 / 4150

ETHUSD Wick ObservationVery similar price structures
An increase the same % as the prior would put ETH at around 7.5K
Very subtle pair due to the short timeframe between points
I'm all for it though!

ETHUSD Analysis An analysis of the channel that has formed on the 4Hr chart for the ETHUSD pair
Price has moved cleanly through a point of resistance with ease, suggesting further bullish momentum and potentially breaking of the channel
ETH is a great pick for a long
The bars pattern is very speculative
Heres a longer timeframe / more detailed chart

ETH/USDTB 4HOUR UPDATEWelcome to this quick ETH/USDT analysis.
I have tried my best to bring the best possible outcome in this chart.
ETH/USDT analysis is head and shoulder and after Trend and break and inverse head and shoulder 100MA bounce and bullish signal and 100MA break after ETH/USDT is bearish
Sorry for my English it is not my native languages.
Do hit the like button if you like it and share your charts in the comments section.
THANK YOU...

ETH #ETH Ethereum Log Chart $24K incoming?This is a monthly chart on a Log scale for Etherum for three cycles. I included in Fibonacci patterns as well as taking into account days. Drop in a comment and I will surely give you my feedback. I am unsure if it is all too possible but $24K ETH to USD seems to be coming soon. Something is brewing for sure. Disclosure: This is just my opinion and not any type of financial advice. I enjoy charting and discussing technical analysis . Don't trade based on my advice.

ETH Buy the dip.Ethereum - Intraday - We look to Buy at 4001 (stop at 3911)
Daily signals are bullish.
Dips continue to attract buyers. We look to buy dips. 50 4hour EMA is at 3991.
Our profit targets will be 4258 and 4298
Resistance: 4200 / 4280 / 4375
Support: 4100 / 4000 / 3900

Ethereum Update 25/10/21: 44% from the 161.80% fibs @ $5,974Ethereum is currently only 22% away from the price target at the 127.20% fibs @ $5,068 and 44% from the 161.80% fibs @ $5,974...$6k ETH very soon 🎯🔥🚀, Since the buy signal triggered, Ethereum has grown over 30% retesting the ATH on the 21st October @ $4356. From this move ETH has retraced 5% and looks like it is ready for another retest and soon $5,068🎯
Our current ETH price targets from the current price:
127.20% fibs @ $5,068 (22% Gain)
161.80% fibs @ $5,974 (44% Gain)
261.80% fibs @ $8,592 (108% Gain)
423.60% fibs @ $12,828 (210% Gain)
Please see previous analysis below. Happy Trading :)
Update 14/10/21:Ethereum poised for a parabolic run Target @ $5k. A strong Buy signal was triggered on the Daily Chart (10/10/21) with the 13 EMA crossing up above the 50 SMA . We have been very patient with this move as a fake-out looked likely to form, from the current price level ETH is showing a clear breakout above the 78.60% Fibs, currently Ethereum is only 15% away from the ATH price in May @ $4361. This move to the 161.80% looks like it will be a very impulsive wave and may play out in 2 push phases. From the current price ETH is 42% away from the ATH , since the buy signal triggered ETH has grown over 18%+.

ETHUSDT Next Target $10,000 ?ETHUSDT Technical Analysis Update
ETHUSDT currently trading at $4100
Major resistance trend line breakout in day chart. price can consolidate at 4000- 4400 level before making new ATH.
Long Entry level: $3900 - $4100
TP 1 : $5000
TP 2 : $6000
TP 3 : $7500
TP 4: $10,000
Stop loss: $3000
Max leverage : 2x or buy it on spot market

Continued thoughts on ETHUSDMajor trendline reclaimed up is coming
UPTOBER xD
This has been my general consensus for the past few analyses

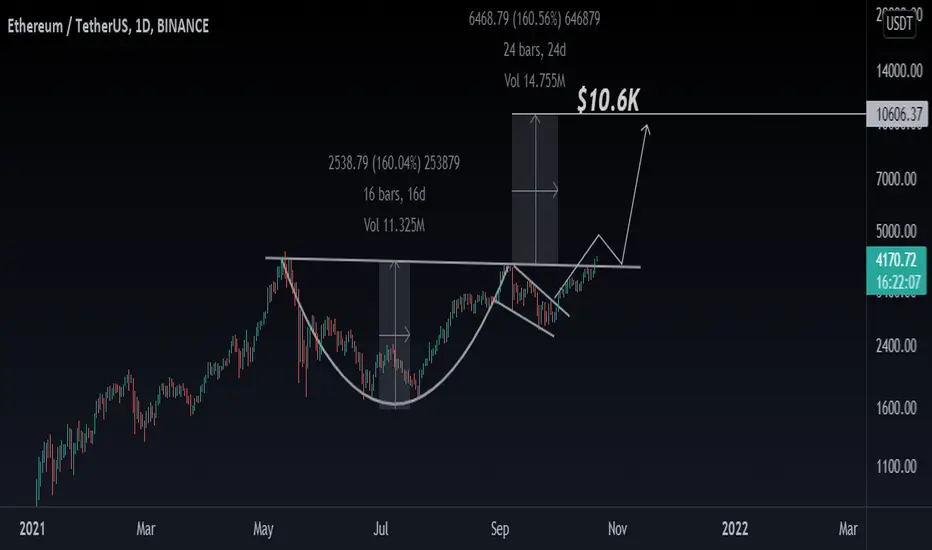
Ethereum, ETH, ETHBTC, BTC, Daily Chart$ETH Cup Handle Confirm Pump. #ETH has been taking its time but the setup is perfect for mooning to ATH
Ethereum Price Blasted Past $4,000; Closing In On $4,400
Ethereum is on the final approach to $4,400 after bringing down the barrier at $4,000.
The SuperTrend and the MACD indicators sustain buy signals as buyers flock to the market.
The cryptocurrency market is currently shining a light on the altcoins following weeks where Bitcoin has solely rallied to higher levels. Ethereum appears to be leading the pack after making a comeback above $4,000.
Ether is not the only altcoin on the upward roll because Solana trades at $183 at writing after rallying nearly 17% in 24 hours. Other double-digit gainers include Litecoin and OKB with 10 and 18.5%, respectively. Most altcoins are posting considerable double-digit gains.
Ethereum Price On The Home Stretch To $4,400
While Ether has kept the uptrend intact over the last couple of weeks, it has not made it to $4,000 until now. Altcoins mainly experienced the challenge because Bitcoin continued to shake the ground for new levels. At the moment, BTC is trading within an inch of the all-time highs.
Ethereum has come a long way in the last 24 hours, first defending support at $3,800 and later lifting beyond the critical supply zone marked in red. The second-largest cryptocurrency trades around $4,160 at writing, while bulls look toward the record high achieved at $4,400 in May.
Meanwhile, the technical picture is strongly bullish based on the Moving Average Convergence Divergence (MACD) indicator and the Relative Strength Index (RSI). The latter recently crossed above the mean line; simultaneously, it sustained a buy signal since late September.
The RSI affirms the growing bullish grip on ETH, and as it moves into the overbought region, more buy orders are anticipated. Another buy signal from the SuperTrend indicator emphasizes the bulls’ influence, thus propping Ethereum for the ultimate breakout to $4,400.
Ethereum Price Intraday Levels
Spot rate: $4,177
Trend: Strongly Bullish
Support: $4,000
Resistance: $4,400

Ethereum Climbing Back Up!!Since we were trading withing the bullish triangle a little while ago i talked about some very nice looking upside on the horizon and we have seen just that with a strong breakout and a steady climb back to the upside! PS. This drawing was not the Bullish triangle i am referring too i erased it to clean up the chart a bit, we have taken out the 0.2 FIB level and we have had multiple retests with us being successful everytime, another key level we have successfully regained is the 3667$ and again we have had multiple retests succeeding. The next big test we are facing is the 4k level or aprx 3990-4000K level we have had one touch so far and we're rejected but we are still looking strong and seem to be taking a little cooldown resting on our current support level until we make our next move upwards! We also have uptrend support coming from around 2800$ and we have respected it all the way up till now, i see us holding onto this level following it upwards and ultimately i am looking for a reentry of our ascending channel shown above and then eventually the 0 FIB of course coming from our ATH! Looking at our Bollinger bands we seem to be inna very nice spot with price action well above the midline and not far away from that top band, i think we could be in for a rollercoaster ride up the top BB since we have not seen one in quite some time and we keep on wicking too the very top, likely just a matter of time before we have a nice upside day then eventually grabbing onto that top band taking it for a ride likely up towards that 0 FIB level, if the momentum is there i don't see us having too many problems shredding through this level and creating a new ATH and aswell entering price discovery mode! Looking at the Reversal Momentum Indicator we are in a slight downside right now but we see the orange curling heavy to the upside and coming towards the blue, we don't want too see a bearish reversal with the blue going under the orange but we could definitely see a little fakeout where we get a nice bounce off of the orange to continue this upside climb! Checking out the ADX we are looking good and seem to have found some footing a decent bit below our previous high, we are starting to turn to the upside with the direction looking to start an overall reversal after having some significant downside. A must watch for Ethereum is price action grabbing onto that top bollinger band, the RMI getting a bounce and keeping the blue ontop, and aswell the RSI which isn't currently on the chart, we need to stay above the midline to continue the uptrend, we are significantly above the midline currently near the top of the zone so thats why i decided to leave it out of this TA but always keep an eye on that! Not financial advice just my opinion!

What an 11K Ether would look like ETHUSDJust a visual on the moonshot if the price went to 11K the upper range for my predicted target
This moonshot is monstrous

ETHUSD Comparable Points BULLSI just realised on the log chart for ETHUSD that the same structure we are experiencing now is poised between .786 and .618
using this information I can predict I possible top at 11K which is close to my previous target of 8K
Using both these targets ill come to a decision around that area when I will sell (if I will)
Linking important charts that are relevant and you should check out
