Ethereum Deathcross and New TrendlineEthereum has performed a 50, 100MA Deathcross
Also a new trendline has established, if this is true this trendline and hodls, the price will skyrocket
I expect price to dip a bit below the trendline and recover (black circles)
Ethereumusd

ETHUSD 20K and Mosaic Using spirals we can predict future tops
In this case it points to 20k
Also included a mosaic using triangles

The ETH might break this channel, so pay close attention 😲😲There is some uncertainty on the Ethereum chart, locally you can see that the ETH is trading in a channel along the lower boundary, as the price rises we can also see the volume decrease, which is not a good signal, if the price breaks this channel and tests it as a resistance, it might be a good opportunity to go short with the targets noted below.
Write in the comments all your questions and instrument analysis of which you want to see.
Friends, push the like button, write a comment, and share with your mates - that would be the best THANK YOU.
P.S. I personally will open entry if the price will show it according to my strategy.
Always make your analysis before a trade

Spot the Triangle ETHUSDETHUSD is currently in a large falling wedge on the 4Hr chart
This will most likely break out to the upside
You can see how many rising wedges (supposedly bearish) break out to the upside on a low timeframe (4Hr)
More of an artistic piece than a forecast, but the falling wedge still hodls potential
I am long Ethereum
Check out charts below for sharper ideas

ETH-BTC Fascinating Ribbon Pattern3 Bearish Peaks can be observed on the ribbon indicator
This lead to a bear run
Now 3 Bullish Peaks (based on trend) can be observed on the ribbon indicator. Is this an early indicator for a larger bull run on the BTC pair for ETH?
For me it is.
Currently price is under 0.786 on the 3rd peak, and should hold above the pattern that has formed, leading to a larger breakout
I forecast a ~0.3 top

ETH buy at support.ETHUSDT - Intraday - We look to Buy at 1866 (stop at 1796)
Pivot support is at 1850.
The previous swing low is located at 1860.
Dips continue to attract buyers.
We look to buy dips.
A lower correction is expected.
Our profit targets will be 2066 and 2126
Resistance: 2050 / 2150 / 2250
Support: 1950 / 1850 / 1730

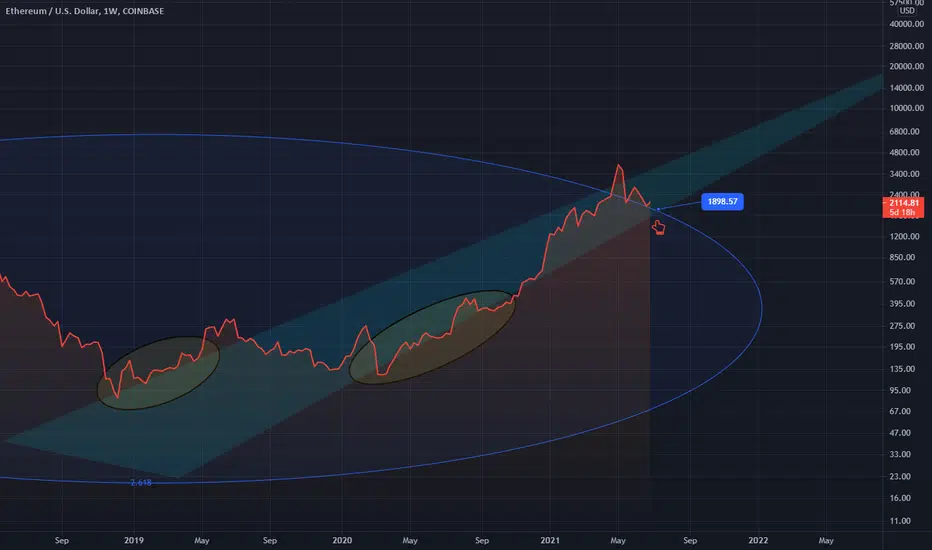
ETHUSD Where to expect the next move UPAn idea using a fib circle of the trend through the bear market
Shows price sitting just above 2.618
Price may float around ~1900, 2000 until early -> mid July
I hodl ETH
Ethereum Scythe ETHUSDScythe usually (from past observations) lead to bullish continuation
If the lower band of the fib channel holds it will break out beautifully

ETH: Shorting resistanceETHUSDT is at resistance and the chances of a breakout look slim.
Based on my analysis, that:
2K is now resistance
180 EMA is acting as resistance above 2K
We will reenter the Ichimoku cloud and move down
I have looked at ETHUSDT in higher timeframes (Daily and 4HR) it really looks bearish based on what I have seen, (Links below).
I'm opening a short at 2013 with a STOP LOSS at 2070.

ETH: Still bearishETHUSDT right now is still in a downtrend, and with a strong resistance above it.
ETHUSDT is at the 2K resistance and to further reinforce the bearish bias:
Below the Ichimoku cloud
Below the 180 EMA
Still in a downtrend
I believe we are in a new range for ETHUSDT with the upper resistance at 2K and the lower support at 1.4K, other s/r can exist within the range.
Considering the last time we were in this range it took 67 days to breakout, we need further consolidation before anything can happen on the upside.
Most probably we will be hitting the 1.4K support a few times in the next coming days.

Buy the dipThose who are holding onto cash, buy the dip and hold fast.
Please note that cryptocurrencies are speculative assets which carry a very high degree of risk and any speculation in such assets can result in a complete loss of capital. This idea is shared for educational purposes only and should not result in speculative decisions in any digital asset.

Ethereum - Is going to reach value area??? 😯🧨Hello friends.
Ethereum rebounded from $1,730 support level, the volume increased, it means that stop losses were collected and the price got liquidity to buy.
There is a value area on the chart above, as well as a key resistance level of $2250, below is the support level of $1730, now price is moving near the local trend line to the resistance level.
I expect that price may go up to the value area and already there I will look for entry points into the position.
Be careful and set stop losses!
Write in the comments all your questions and instrument analysis of which you want to see.
Friends, push the like button, write a comment, and share with your mates - that would be the best THANK YOU.
P.S. I personally will open entry if the price will show it according to my strategy.
Always make your analysis before a trade

ETH - I'm waiting for correction and building new trendline 🤨Right now I don't see a clear situation for traders.
At the moment ATR is over 100%, the correction has already started and we are going to go to the first and second area, after that, I will wait for the trend line creation, the break-up, and the retest of this line, and this moment can be a good point to enter the position.
Write in the comments all your questions and instrument analysis of which you want to see.
Friends, push the like button, write a comment, and share with your mates - that would be the best THANK YOU.
P.S. I personally will open entry if the price will show it according to my strategy.
Always make your analysis before a trade


ETH Sell the oversold correction.ETHUSDT - Intraday - We look to Sell at 2387 (stop at 2471)
Daily signals are bearish.
This has resulted in signals for sentiment being at oversold extremes and we look for a move to the upside.
20 1day EMA is at 2420.
A lower correction is expected.
Preferred trade is to sell into rallies.
We look for a temporary move higher.
Our profit targets will be 2137 and 2087
Expiry: 48h
Resistance: 2000 / 2150 / 2250
Support: 1950 / 1800 / 1730

Ethereum will increase in following hoursHi everybody
As you can see it in the following hours Ethereum will experience a considerable rise in its figure. Long position!

ETHUSD Monthly ObservationComparison between similar candles
Only if this current monthly candle closes below the giant one formed prior is a bear market confirmed
Until then, bulls have dominance, even if it seems they don't
Don't get shaken out
The giant wick acts as a support

ETH: Ready for a breakdown?ETHUSDT looks ready for a breakdown:
We are above the 180 EMA, resistance-turned-support, and the Ichimoku cloud.
But, we have formed a triangle, that looks ready for a break, considering the current trend is still a downtrend.
The triangle will probably break down pushing us below the Ichimoku cloud, turning it into resistance.
Volume has been following quite closely the moves in price, so no divergence here.
I believe this last few hits against this area of support have eroded the buyer's capacity for keeping prices this high, confidence is not great and bearish sentiment might soon go into overdrive at any sign of FUD.
Based on this, I'm really looking for lower ETHUSDT prices and going back into the 2K to 1.5K range for a while.
ALWAYS PRACTICE RISK MANAGEMENT, RISK MANAGEMENT IS THE MOST IMPORTANT SKILL IN TRADING.

Ethereum pullback to 2K??!Ethereum looks like we are going to see a pullback to 2K before we start moving back up again. We saw a break of the 0.5 FIB level and our next major support is just over 2K. We see the MACD has been very jagged recently with multiple bullish and bearish crosses and now we are just seeing the start of another bearish cross. It seems like ETH wants to start moving up but is being held down by BTC just like most of the market. very rare to see a 2 green bar cycle on the macd histogram that's why i think we are being held down. Also something very crucial to watch is that bottom bollinger band we are creeping closer and closer to that bottom band and if we do start riding it we could be in for a significant pullback maybe even lower than 2K. But i personally will see this as a great buying opportunity and will look to grab some more. And we all know the strength of ETH we have already witnessed it earlier in this cycle! Now the RSI does seem to be getting stuck below that 50. point midline and we keep seeing bounces off of it and i wouldn't be surprised if we see another. Remember only when we see a full break above this level and a confirmed hold will ETH be considered in a uptrend. So as we continue like this just like 99.9% of the market we are in a confirmed downtrend and or a mini bear market. I dont think this bullrun is over at all i believe we are just seeing a cooldown with big institutional money flowing into these projects but thats just my opinion! Not financial advice!

Other occasions the 100MA was tested ETHUSDChart showing other times the 100MA was tested
Pretty bullish signs are evident

ETH buy the dip.ETHUSDT - Intraday - We look to Buy at 2302 (stop at 2202)
Daily signals are mildly bullish.
Pivot support is at 2306.
Dips continue to attract buyers.
We look to buy dips.
Our profit targets will be 2569 and 2629
Resistance: 2550 / 2630 / 2700
Support: 2450 / 2400 / 2300

Ethereum ready to come back !ETH / USDT looks ready to take off
We just need a push of BTC
+20% incoming

