Ethereum $ETHUSD PT 5,000-5,200 and higherEther is excelling while the bitcoin sideshow is barely making gains. BNB breaks out on DeFi, going past $100 billion in market capitalization Monday.
Ether (ETH) trading around $3,290 as of 21:00 UTC (4 p.m. ET). Gaining 10.7% over the previous 24 hours.
Ether’s 24-hour range: $2,941-$3,300 (CoinDesk 20)
Ether well above the 10-hour and the 50-hour moving averages on the hourly chart, a bullish signal for market technicians.
Ether was trading around $3,290 as of 21:00 UTC (4:00 p.m. ET), gaining more than 10% over the prior 24 hours. The second-largest cryptocurrency by market capitalization is the crypto story for Monday because the asset hit a fresh record high of $3,300 around 18:15 UTC (2:15 p.m. ET), according to CoinGecko.
“Ether has accelerated to new highs, reaching the targeted level of ~$3,000 from its April breakout far sooner than indicated,” noted technical analyst Katie Stockton, in Fairlead Strategies’ Monday market update. “It is not wise to fight momentum, so we are reassuming a bullish near-term bias, somewhat reluctantly.”
Momentum, in the form of ether spot exchange volume, is clearly high. Ether volume tallied $35 billion Sunday, with bitcoin just a bit higher at $39 billion. Together, the two assets changed over $74 billion in value Sunday – and that’s on a weekend day. Traders will be eyeing volume for the rest of the business week to see where the price settles, particularly with ether continually hitting fresh levels on the spot market.
Meanwhile, over $20 billion in locked value inside decentralized finance, or DeFi, has been gained in the last month, according to data aggregator DeFi Pulse. The value of ether, combined with traders looking for yield that exists for parking crypto in DeFi, is a fundamentally bullish sign for the Ethereum network overall.
“ETH has been powering for the past two years on the booming DeFi industry with a total value locked above $70 billion,” noted Elie Le Rest, partner at quantitative trading fund ExoAlpha. Le Rest also mentioned to CoinDesk the ambitious ecosystem upgrade Ethereum 2.0 as part of the catalyst for traders to punch buy on ETH. “Despite the high fees experienced by the Ethereum network, the market is starting to reflect the anticipated growth of ETH 2.0 into the price of ETH.”
The ether futures market is hitting brand-new levels not seen before, pushing open interest up to $8.8 billion and topping the previous record of $8.4 billion reached April 15, according to analytics provider Skew.
“I bet the launch of ETH futures has increased the comfort level of the massive asset managers that have sent U.S. stock market capitalization north of 200% of GDP and global bond yields negative,” said George Clayton, managing partner at investment firm Cryptanalysis Capital. ”I think ETH is acting like an institutional platform.”
Ethereumusd

ETHUSD - The next entry point! Not a financial advice - This is my trading diary ! It helps me think about my ideas.
Do your own plan and you will be successful in the long run.
Finally my computer is working again.
Ethereum keeps being bullish and it finds itself at price discovery. I am still long on ETH and would accumulate more if price drops to retest previous all time high. - Nice mid-term entries would be 2630 - 2520. The Pair against BTC keeps being strong.
Nothing else to add on this. This has been a very profitable (and easy) trade so far.
#eth #ethereum #tradingidea


ETHUSD ideaSome major trendlines from the inception of the Ether coin
Bull continuation is likely
Its like an expanding wedge since the start

#eth 3Days ATHETH hit ATH
maybe can have a temporary sale on this resistance
if breakdown 12% can back to $2500 support
if open and close @2850 eth can hit to 4k+ soon with 50% profit

Ethereum Strength, MACDEthereum is showing a lot of strength on the MACD vs BTC which has just undertaken a bearish cross on the weekly MACD
If there was any time for a flippening this would be the time for it
HODL your ETH!!

Ethereum 4 HourBreak up into the upperside of the formation
Great long entry at these levels, Prior price action suggests big moves upwards
Added more the other day
This is the 4 Hour chart for Ethereum

Ethereum Classic & SupportsETC in engaged with the Support 32 . In case of breaking the support , rising up to 38 is expected . But still have to be careful.

Ethereum HourlyIdea for Ethereum
Higher lows, tight range is now
More likely to pop off to bull side

Ethereum on verge of breakoutWeekly chart
Large breakout on a weekly timeframe should occur
Added Ethereum to my current position
Ethereum Update 2 After loosing the support, the share needs to get it back for the next positive move! If Not, Re-adjustment up to the bottom of the channel is possible. It Strongly needs the buyers ENERGY!

ETH/USD Falling Broadening Wedge/ 4 Hour ChartHello people!
ETH/USD Potential Falling Broadening Wedge in the 4 hour chart. is a Very Bullish Pattern.
Even through this flash crash which has pulled all towards the bottom I still think that the BULL RUN is not over yet. Here are also 2 support lines below us which have always held well as support or resistance. I will again increase my trade on my lines, since I had a limit order at 1980$. If the breakout on this Falling Broadning Wedge results I will increase my trade after the confirmation.
The last ETH breakout we have also traded for a long time from 1550$ and at the breakout point at 1800$ we have increased our trade and have gone up to the target and have realized there above 80% and let the rest run with SL in profit.
Am curious what will happen in the crypto market this week.
Have fun with the trade and great profits.
Registration link for PHEMEX EXCHANGE:
phemex.com
Registration link for BINANCE EXCHANGE:
www.binance.com
Registration link for IMBA EXCHANGE: imba-exchange.co
YOUTUBE CHANNEL from EGALITE:
www.youtube.com
Homepage: egalitesignals.com
EGALITE

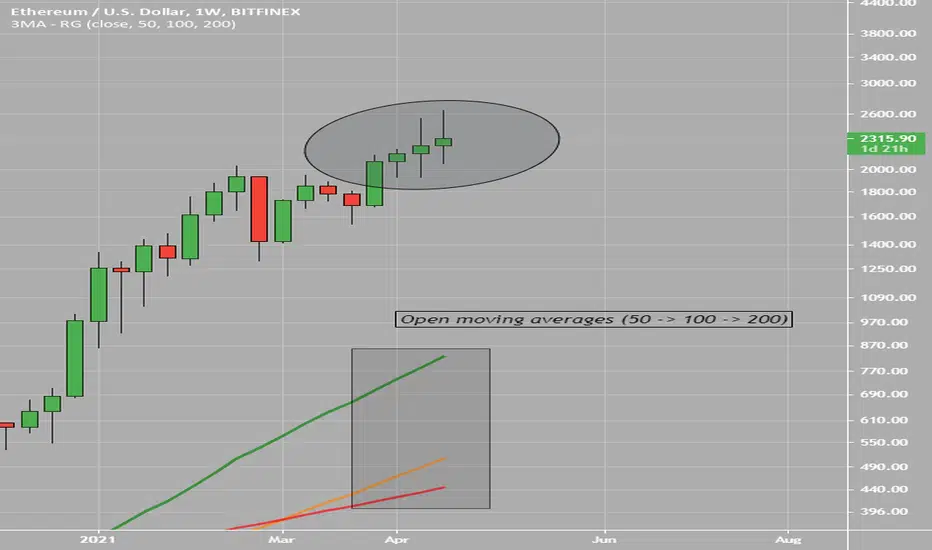
Further looking at ETHUSD and ETHBTCAnalysis for ETHUSD and ETHBTC
These are the daily charts
On the ETHUSD chart an expanding ascending wedge can be observed, this will likely continue, leading the price to mid 3,000's
This theory supported by the bullish state of ETHBTC with "open" moving averages (50 -> 100 -> 200) and a wide Gann range
Ethereum looks very strong, while Bitcoin looks rather weak at this current stage
I wonder how it will play out
This previous idea of mine shows ETHUSD breaking free of the two fib circles, allowing for a massive bullish range, further supporting the bullish theory of this post
I am long Ethereum

ETH.D To IncreaseEthereum dominance is looking to increase after hitting the bottom of the expanding wedge formation
We are looking for a right shoulder to form from this upward move, confirming the larger head and shoulders pattern within this wedge
Personally I think this will be the move to break this wedge formation, but if not the right shoulder will occur.
Included other chart patterns within this larger wedge, (falling wedge, symmetrical triangle)
I am long Ethereum

ETH tumbles to $2,000 as losses to $2,000 linger
Ethereum rejected at the 50 SMA on the four-hour chart.
Ether bulls battle to secure immediate support at $2,000, highlighted by the 100 SMA.
The least resistance path is south, but support at $2,000 may bring back market stability.
Ethereum bounced off support at $2,000 amid the weekend session declines. Bulls fought around the clock to reclaim most of the ground to $2,500, but the uptrend stalled under the 50 Simple Moving Average (SMA) on the four-hour chart. Recovery became a challenging task, allowing bears to swing into action.
Ethereum technical levels worsen
The four-hour chart suggests that the short-term technical levels have weakened in the last 24 hours. The Moving Average Convergence Divergence (MACD) indicator failed to secure the ground within the positive region. The slide into the negative territory is a massive bearish signal. The gravitational force is accentuated by the MACD line (blue) crossing under the signal line. As the signal line’s divergence widens, the bearish grip gets more vigorous.
In the meantime, Ethereum trades around $2,100 amid increasing overhead pressure due to the 100 SMA at $2,200. Losses to $2,000 beckon amid the bearish picture. The 200 SMA is in line to offer support; however, if lost, declines may extend to the next anchor zone at $1,800.
It is worth keeping in mind that if support at $2,000 holds, a rebound such as Sunday may occur. Reclaiming the ground above the 50 SMA could trigger massive buy orders as investors speculate the rise to $2,500.
Ethereum intraday levels
Spot rate: $2,095
Trend: Bearish
Volatility: High
Support: 200 SMA and $1,800
Resistance. The 100 SMA and 50 SMA on the four-hour chart

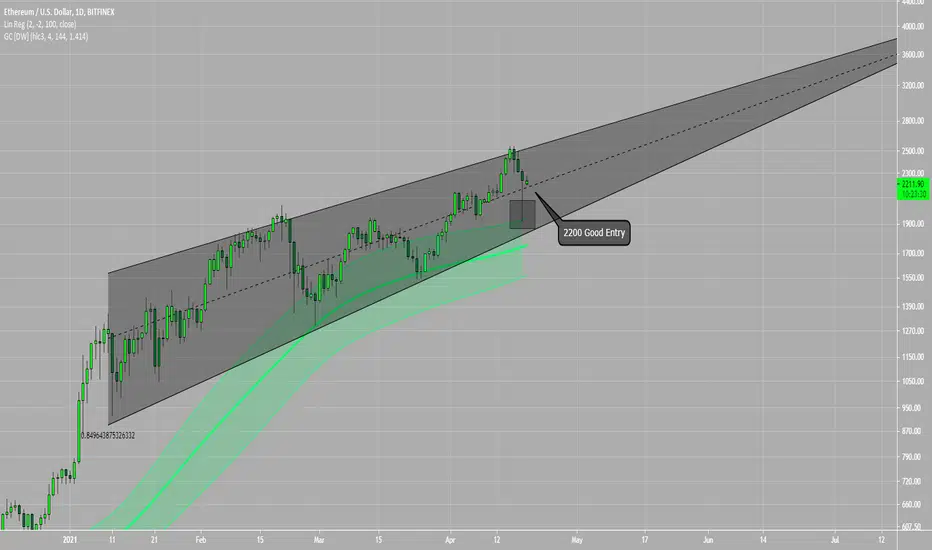
Ethereum Linear Regression DailyWith a strong R value of 0.85, this is a strong linear regression trend
I find 2200 a nice entry point, just above the middle of the regression trend (for traders)
Ethereum price looks very healthy, with a wick extending to the top of the Gaussian Channel
Weekly ETH looks just as good
Digital Diamonds !
MACD fakeouts Ethereum and LINK for examples
The MACD can be seen to attempt a reversal but is overcome by bullish momentum
An observation
I am long ETH and LINK

Likely breakout 50% Fibonacci line support, relatively oversold, and hoping for a small dip to breakout.

ETH price cracks $2,500, shifts attention to $3,000
Ethereum is almost completing an ascending triangle target of $2,664.
The slightest resistance path remains north despite bearish advances.
Ethereum price is on a roll to new all-time highs following a recent break above an ascending triangle pattern. As discussed on Thursday, establishing support above $2,400 was key to securing the uptrend to $2,500. At the time of writing, Ethereum teeters at $2,505 after making a tremendous milestone.
The daily chart illustrates the formation of an ascending triangle. This pattern forms in an uptrend and tends to signify continuation. The triangle brings to light a consolidation period before a breakout comes to life.
Two trend lines create an ascending triangle, connecting a series of equal peaks and sequential higher lows. A breakout comes into the picture when the price slices through the x-axis. Note that triangles are known to have exact breakout targets measured from the lowest to highest points.
For instance, following Ethereum's break above the triangle, the uptrend has been moving toward the 34% target to $2,664. The primary goal at the moment is to secure higher support, preferably above $2,500. Support at this level would prove to the investors that the uptrend is intact and market stability has not been compromised. Besides, bulls will have the opportunity to focus not only on the triangle target but the rise to $3,000.
The Moving Average Convergence Divergence (MACD) indicator’s position affirms that the uptrend is intact. As the MACD moves higher within the positive region, the bullish grip strengthens.
On the flip side, closing the day under $2,500 may increase bearish pressure. Support at $2,400 might be tested, and if broken, Ether could spiral toward $2,000, marking the beginning of a significant correction.
Ethereum intraday levels
Spot rate: $2,500
Trend: Bullish
Volatility: Low
Support: $2,400 and $2,000
Resistance: $2,556

Ethereum $ETHUSD Long Term target PTs 2990-3740-4500-8000Ether and altcoins
Ether (ETH) trading around $2,334.94 as of 20:00 UTC (4 p.m. ET). Climbing 1.49% over the previous 24 hours.
Ether’s 24-hour range: $2,268.57-$2,399.61 (CoinDesk 20)
Ether trades between its 10-hour and 50-hour averages on the hourly chart, a sideways signal for market technicians.
Ether, along with many other alternative cryptocurrencies (“altcoins”), also logged more gains on Wednesday.
Besides ether, which is the No. 2 cryptocurrency by market capitalization, one of the most staggering growth spurts was seen with dogecoin (DOGE), the beloved meme cryptocurrency that was created back in 2013.
As a result, dogecoin now has a market capitalization of more than $16 billion, surpassing that of bitcoin cash (BCH) and chainlink (LINK), per Messari data.
Dogecoin’s sudden price surge also came with escalating trading activity: data from Coingecko also shows that dogecoin is the No. 5 most traded token of the day, only behind tether (USDT), bitcoin (BTC), ether (ETH), and xrp (XRP).

ETH SMALL AND MID TERM POSITIONin this scenario we can buy in this triggered point, in small term we can take profit in tp1 and in mid term we can take profit in tp2.

ETH reaching for new record highs above $3,000
Ethereum bulls' persistent push for new all-time highs yields after breaking $2,300.
Ether's path with the least hurdles is north, as confirmed by the MACD on the four-hour chart.
Closing the day above $2,300 could allow bulls to focus on $3,000.
Ethereum has been keen on joining the ongoing bull cycle. Initially, it was an uphill task to reclaim the ground above $2,000, but bulls never lost focus. Support at $2,200 confirmed the market stability, allowing buyers to glance at higher price levels. Meanwhile, ETH dodders at $2,320 amid the roll to another new record high.
Ethereum gains ground as $3,000 beckons
At the time of writing, the least resistance path is upward, as reinforced by the Moving Average Convergence Divergence (MACD). This indicator is nether exclusively bullish or bearish biased. However, it identifies positions where traders can buy the dip or sell the top. Moreover, the MACD foresees the asset's general trend and measures the momentum.
A MACD line (blue) crossing above the signal line implies that traders should be buying more or holding in anticipation of growth. On the other hand, crossing underneath the signal line hints at the trend flipping bearish.
In the meantime, the MACD emphasizes that Ethereum is comfortably in the bulls' hands. As the divergence from the signal line expands, the bullish momentum strengthens. Note that crossing above the $2,500 would be a significant milestone for Ethereum and may trigger massive buy orders toward $3,000.
Ethereum intraday levels
Spot rate: $2,333
Trend: Bullish
Volatility: Expanding
Support: $2,200 and $2,100 and $1,900
Resistance: Undetermined

ETH is still a great buySort of a repost
Just want to remind everyone about ETH's explosive potential at these levels of discovery
