ETH plunges toward 1,400 as crypto market generally bleeds
Ethereum hit a wall slightly above $1,700, opening Pandora’s box for losses under $1,600.
The least resistance path is downwards based on the MACD.
Ethereum abandoned the mission to lift to $2,000, slightly above $1,700. Losses came into the picture with Ether falling below several key support levels, such as $1,650 and $1,600. At the time of writing, Ethereum is trading at $1,570 amid the bearish call to dip further.
The entire cryptocurrency market is in the red, led by Bitcoin’s dip to $52,000. If Ethereum does not find support at $1,500, we can anticipate another dip toward $1,400 or the descending channel’s lower boundary support as illustrated on the 4-hour chart.
Meanwhile, Ethereum’s downtrend has been validated by the Moving Average Convergence Divergence (MACD). The indicator is used in technical analysis to show positions to buy the dip and sell the top. When the MACD line (blue) crosses beneath the signal line, traders are advised to sell.
On the other hand, it is a call to buy when the MACD line crosses above the signal line. The indicator also shows the general trend in the market. At the time of writing, the least resistance path is downwards.
The same bearish outlook has been validated by a death cross pattern on the 4-hour chart. This pattern comes into the picture when a short term moving average crosses under a long term moving average. For instance, the 50 Simple Moving Average (SMA) recently crossed below the 100 SMA, implying that the trend had flipped bearish.
Ethereum will resume the uptrend if it holds above $1,600. A move such as this will show the investors that recovery is possible. Gains toward $1,700 will come into the picture as buyers join the market from the sidelines.
Ethereum intraday levels
Spot rate: $1,570
Relative change: -8
Percentage change: -4%
Trend: Bearish
Volatility: High
Ethereumusd

EOSUSD Is going to be one of the biggest hitters this year! 1HRBeen following EOS for some time since it came out.
I have a projection of 25+ by July easily.
Short term $5 is inbound in for sure!
Anything dealing with Ethereum has my attention.
Ethereum will be over 30k by 2022-23.. :)
Lets get it baby! Super excited

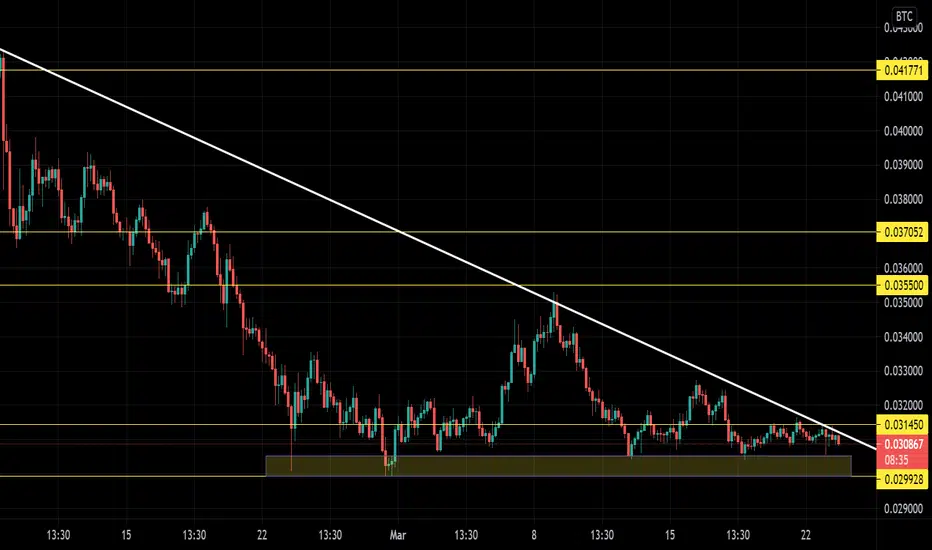
Ethereum chart review Ethereum re-tested 31500 resistance and got rejected. If drop back to green support zone most probably will dump lower since it was tested for 3 times.
Ethereum Forecast - $1440 or $1000? Bearish momentum has tartedHello Guys,
Scenario 1
I see two possibly scenario as bearish momentum is starting. The most possible and probable scenario is that ETH will retest the $1440-$1400 zone. This is a very strong support here, previously the price dumped back from this zone. It was the 2017-2018 ATH of the ethereum at the time. This year the price has struggles 4-5 times to brouk up this zone. After that when the price returnt down to this level this became a highly respected support zone. Additionally this zone overlap the the 1D 100 moving avarega which is not on the picture, but if you set it up, you will see. Conseqvently this is a very very powerful support. That's why my personal opinion is the price will go up from that area. I see arounf 70% possibility for it. This might be a good Buy Entry for everyone who missed it till now.
Scenario 2
I think this scenario is less likely, but also possible. I think there is a 30% possibility for it, which is more than enough. In this case the prace my hesitate at the $1440-$1400 area, but will break it down towards $1100-$1000. This is also a very very powerful support. I can't see lower price this year for ether. The $1100 - $1000 area overlaps the 1D 200 moving avarega area which is also a very very strong support. Additionaly this zone was support twice in January for Ethereum. Furthermore there is forming a strong bullish XABCD pattern if we reach this level. This could mean a very good buying opportunity.
This is my personal opionion, not a trading advice. Anyway if anyone missed the Ethereum, this bearish momentum could be perfect timing.
Leave your tought in the comment section to see what is your opinion and the likely scenario
Regards,
CryptoMex

ETHUSDT may be about to show its hand... and it's bullish...ETH has been a test of patience lately and has been in this sideways price action since 08-MAR. We did see a test of key level (1,930) but nothing came out of it but more sideways. However, something tells me we may be about to see another test of 1,930 soon, especially if we see a break above current price levels.
Note that many traders are probably looking at current price structure as bearish (resembling a H&S pattern) and sellers could be jumping in, anticipating a move lower. If you're a bull like I am, you'll see these as potential trapped bears...
Place your bets, folks!

ETH breakdown intensifies as cryptocurrencies bleed
Ethereum tumbles below the ascending channel as losses to $1,400 linger.
The downtrend is validated from a short-term technical perspective based on the MACD.
Support above the 200 SMA and a move past the 50 SMA would lead to gains targeting $2,000.
The cryptocurrency market is swimming in in red waters following the bearish wave on Monday. Ethereum dropped from highs above $1,900 to seek support at $1,700. The declines are believed to have come into the picture following the report regarding banning digital assets in India.
Despite the massive drop, Ethereum has weathered down the losses much better than Bitcoin, which drop from highs above $60,000 to levels around $54,000. At the time of writing, Ether is trading at $1,740.
The immediate downside is protected by the 200 Simple Moving Average (SMA) on the 4-hour chart. Further down, the 100 SMA is in line to provide support. If these two anchors fail to hold, investors can expect ETH to drop to $1,400.
Meanwhile, the Moving Average Convergence Divergence (MACD) validates the downtrend with its negative gradient. The MACD line (blue) already crossed under the signal line, signifying the increase in selling pressure. More losses will come into play if the MACD dives into the negative region.
The least resistance path is downwards amid a rise in volume. Therefore higher support is the only way to secure Ethereum for a recovery. Otherwise, the drop to $1,700 is quite conservative, keeping in mind the recent rising wedge pattern with a target at $1,300.
It is worth noting that support at the 200 SMA will return market stability. A stable market will allow bulls to focus on recovery. Settling above the 50 SMA at $1,800 would give way to gains eyeing $2,000.
Ethereum intraday levels
Spot rate: $1,745
Trend: Bearish
Relative change: -55
Percentage change: -3%

Ethereum Market Cap IdeaIdea for ETHMCAP
I expect the bull run to continue while the channel on the RSI is intact
Sitting above (1) level on the fib retracement
This is a bullish sign
The only bearish sign is the price action above (1) which is similar to the price action when the top occurred in the previous bull run
However I think the bulls will prevail, take my bias into account though

eth pushing above the 0.7 FIB levelIf we see a daily candle close above current levels which will be above the 0.7 FIB level i believe we will see a strong push to the ATH/ FIB level of 1. Our Macd is looking very bullish and is showing no signs of slowing down, aswell we are seeing good support from our ichimoku cloud continuing to print green support clouds. I think if we do see a push to the ATH we may encounter some heavy resistance and could reject us the first try, but ultimately i see us breaking this level in the coming week and then continue on the push higher creating more support and new ATHS! Not financial advice just my opinion.

Ethereum Gann Bullish OutcomeComparison point at 0.618 and 2.618
If the curve holds it will open a large range within the (1/1 - 1/2) Gann range, this is a big range extending up to around 6.3k
A bearish Idea for ETH
Another more long term bull idea
I am long ETH


ETH 2 more FIB Levels till ATHETH has been performing amazing and with a recent golden cross on the MACD i think we are bound to push for that ATH and eventually a new one! we have 2 more overhead FIB levels we need to break before we achieve a new ATH, the upcoming 0.7 FIB where we were recently rejected and the ATH FIB of 1. the ichimoku cloud has been bringing us big support and looks like we could start to see the form of another big green cloud. Overall long term very bullish on ETH, also EIP 1559 upgrade expected to go live in July or August could have us see even more upside . NFA just my opinion.

Ethereum Short Term Bearish ScenarioUsing the channel tool we can plot a channel for the recent bull move
Similarities can be seen in the beginning of the channel to now (fat arrow)
Suggesting a bear move
Black dotted line is a possible support line and the best area to enter
I have faith that Ethereum's bull run will continue long term however
I am long Ethereum, hence my stance on this idea.

$ETH $2500 next !trendline became resistance.
If we can break through this trendline
we will see $2500 next !
1.618 fib extension aligns perfect with that psychological level.

ETH looks dumpy afThere are many new copies of ETH coming out with cheap access to the EVM, price of ETH will plummet

#ETHUSDT #4H #ethereumHi guys..its the latest analyze chart of #ETHUSDT in 4H time frame .if you are interested any crypto that you want analyze with me and any questions please do not hesitate and comment below the chart!
if u like it press like-comment and folow me.thx

ETH-BTC Indicator Analysis - BullishA bullish case for ETH-BTC
Similarities in price action can be seen within the boxes
This is better shown on the log trend indicator
The 200MA is extremely flat, suggesting that it may rise rather than fall
Also the Ichimoku indicator shows that price has broken above the cloud, now the cloud will act as support for price rather than resistance, such as it did in the previous scenario (first box)
Attaching some other ETH-BTC ideas
I am long Ethereum..

BTC vs ETH - DivergencesETH seems to have a bullish divergence while BTC lacks one
Maybe this is a parabolic premonition as I have suggested in my earlier posts
Feels good to validate it with a TSI divergence
Comparison post
I am long ETH
Attaching relevant ideas

Stretching BTC DominanceETH is in an ascending broadening wedge
BTC.D is at the top of a descending broadening wedge
As a major altcoin I expect ETH to move in the opposite direction of BTC.D
Ultimately however my belief is that ETH will be carried to the top by bitcoin
It's either that or a flippening, and chaos would ensue if that occurred, unneeded chaos..

Ethereum Chart ArtUsing triangles to make cool colour patterns
In this case it is the recent uptrend formed on Ethereum
I believe this channel formed will breakout to the upside in a strong fashion, it is just a matter of time
Enjoying making cool patterns like this
Linking some more serious ETH predictions

ETH looking for that move upETH looks good we have broken through the 0.3 FIB we will just need to close out the daily candle above this FIB level, then i think we will see some upside, also the Stoch RSI has came out of the oversold area and looks like its coming back up. We will want to see a MACD crossover to bring the Blue line ontop of the orange, which it looks like we could see that soon. Next target level to break if everything keeps going the way it is, is the 0.5 FIB level. Not financial advice just my personal opinion.

#ETHUSDT #4H #ethereumHi guys..its the latest analyze chart of #ETHUSDT in #4H timeframe .if you are interested any crypto that you want analyze with me and any questions please do not hesitate and comment below the chart!
if u like it press like-comment and folow me.thx

The Monster Uncaged - Hidden Inverse H&SClear relationship between the two price point touches at their respective 1.618 trends (bear and bull)
This is a very bullish outlook for Ethereum, hence the title
A pattern like this of this magnitude will push Ethereum a lot higher
Crazy bullish long term

ETH battles immediate resistance, and bulls look toward $2,000
Ethereum is on the verge of a breakout, but first, it must break the 50-day resistance.
A step beyond the ascending channel’s middle boundary will open the door for gains aiming for $2,000.
Ethereum managed to sustain the uptrend above $1,400, avoiding the drop to $1,200. Recovery, although gradual, seems to be coming into the picture toward the end of the Asian session on Wednesday. Ether is exchanging hands at $1,520 while bulls fight to break above an immediate but crucial resistance level.
The daily chart highlights the resistance brought about by the 50 Simple Moving Average (SMA). If bulls overcome this hurdle, the journey toward $1,600 will become apparent. On the other hand, bulls must focus on stepping above the seller congestion zone at $1,600 to pave the way for gains eying $2,000.
The bullish outlook has been validated by the Relative Strength Index (RSI) as the indicator slowly approached the midline. A further movement toward the overbought area will cement the bulls’ influence over the price.
Simultaneously, Ether is trading within the confines of an ascending parallel channel. The pattern’s support played a key role in stopping the potential losses to $1,200 earlier this week. Moreover, buyers are using the lower edge of the channel as a springboard to higher levels. Note that trading above the channel’s middle’s boundary resistance might trigger massive buy orders as Ethereum is catapulted toward the coveted $2,000.
On the other hand, the remarkable breakout may fail to occur if the immediate 50-day resistance remains intact. Simultaneously, if overhead pressure increases, Ethereum will retest the support at the channel’s lower edge. If this buyer congestion zone is shattered, ETH will spiral toward $1,200 in search of formidable support.
Ethereum intraday levels
Spot rate: $1,520
Relative change: 30
Percentage change: 2%
Volatility: Low
Trend: Bullish
