ETHUSD Developing FurtherThe future of finance,
Check defipulse.com for the current moonshot that's happening within the DeFi space
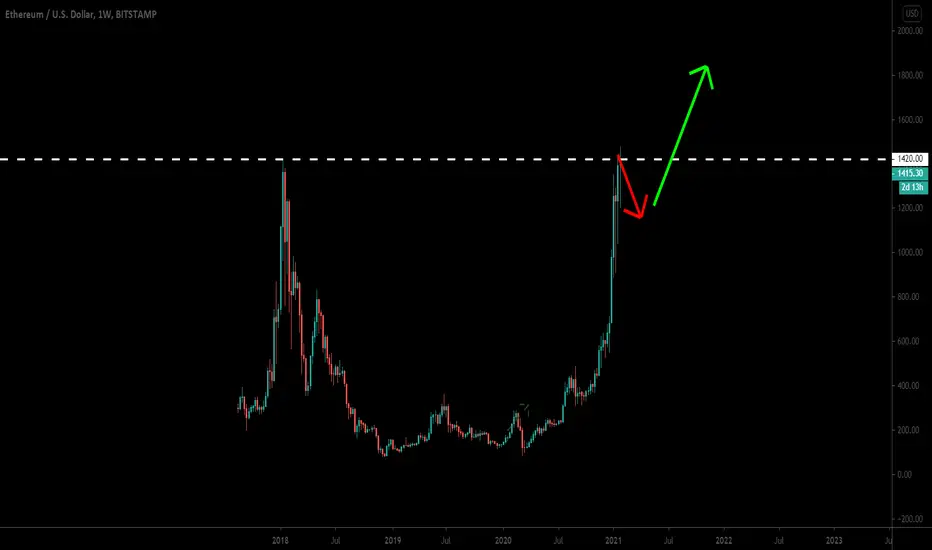
(a) is a similar point of reference and the basis for the bars pattern predicting the future move
I believe the parabolic move (in blue circle) was a premonition for what is to come
Some of my previous work on ETH
Ethereumusd


ETHUSDT, short continue. Target 1450.Hi friends. Price want go more lower to 1450. All purchases (ETHUSDT) from support are sold and we can going to 1450 in near time. Volume analysis thanks to ""Earned Pro". Follow me.

ETHEREUM - new ATHs as expected 🏆🥈I have posted several ideas on Ethereum the last few weeks and it has gone really well, bought dips nicely and the direction in mind was clearly going NORTH....
All this until FEB 8th.... (detailed video coming up soon)
stay tuned for more

ETH Literally to the stars!Underlying bull trend on ETHBTC that I have just noticed
This will dominate as the bear trend has reversed (breakout from a falling wedge)
ETHUSD can be seen forming a flag (bullflag) from a curved flagpole or (scallop)
This is really bullish and I am heavily invested, imo you should hop on board aswell
Everyday DeFi Pulse is pushing new highs, showing the power of projects built on top of Ethereum
Some popular ones are Maker, AAVE, and UniSwap (gems can be found among the saturation)
This is my reasoning behind a massive move for Ethereum, it seems ETHUSD price isn't reflecting currently the bullishness of projects built on the platform
Hopefully this post allows some realization for whales
We have recently been exposed to a lot of buyers through WallStreetBets, I assume a lot of these new believers will join the cryptocurrency movement.
Generational wealth is in effect.
Some of my older work on ETH
Big things coming for ETH and Vitalik

ETHEREUM - Been a good 'example' 🧮Patience is key in trading guys. Many of you get emotional, expect your trade or investment to rise on a straight line.... sorry, not gonna be happening
Well, Ethereum has been such a GREAT example of how:
1. the direction is clear (has been a buy- look at our ideas)
2. every time it corrects it offered an opportunity to buy again
3. it did also offer opportunities for short positions (especially for us who hedge a lot)
patience (check our various ideas) paid out and is paying out
So what's next? For us is taking profit time (again) and we keep some for a rise further higher. We are also trying and compounding some small short positions (25% atm).

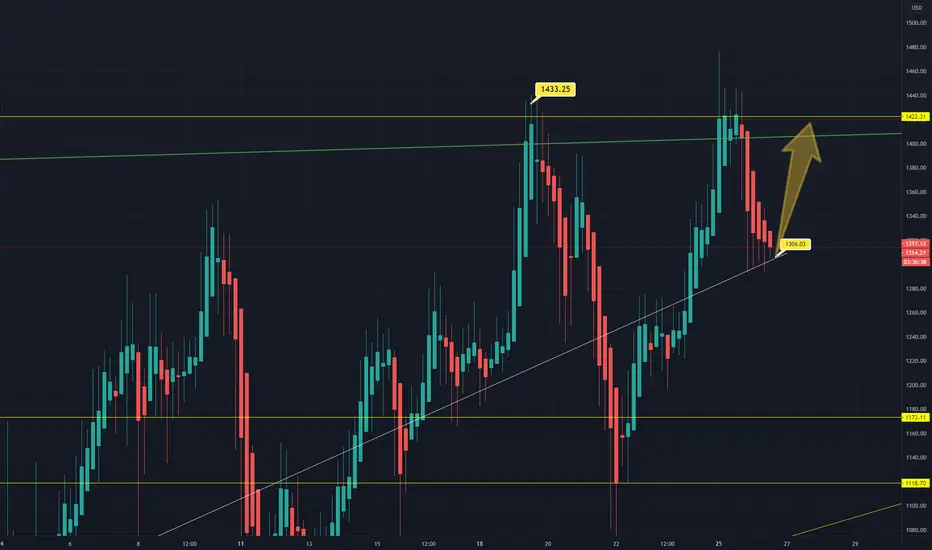
ETH price prediction and ANALYSISETH is waiting for action. We are moving between $1480 and $1424. Ethereum does not have enough power to move higher up to $1480.
We can see a BEARISH divergence on RSI and low volume. It seems like the market is exhausted. If we break uptrend TL, you can short it. But I prefer to BUY with a price drop of around $1259.

ETH-USD finishing the last shoulder for shortseems like even ETH is shrugging. I believe we're gonna set a new ATH and be bearish for little bit but enjoy the bull for now mates.
Please like and follow to support and comment your thoughts and ideas, thanks.

Big ascending triangle formationEthereum is forming a beautiful pattern.
Candle closing above U$1.500 is the safest point to entry.
U$1.400 is a good price to stop loss.
The ascending triangle target is U$1.800, but we can see much higher prices due to the moment of euphoria on the crypto market.

Ethereum (ETH) Less Than $1600 Is Damn CheapHey friends, hope you are well, and welcome to the new update Ethereum coin.
14000% rally:
From 2015 to 2016 the price action of Ethereum rallied from $0.15 to $21.49 that was more than 14000% gain.
22000% rally:
After 14000% gains, the price action of Ethereum started the next rally from 2016 to 2018. This time it was more than 22000%, that was almost doubled move than the previous one.
Bullish Cypher move:
it can be also observed that before the second bullish rally the priceline also formed a big harmonic Cypher pattern on the monthly chart and started this big move from the potential reversal zone of this bullish pattern.
Bullish Gartley move:
Now recently back in March 2020, the price action completed another bullish harmonic Gartley move on the monthly time period chart. I also shared this move in march as below:
Now from the potential reversal zone of this pattern the price action has rallied more than 1500% sofar and reached the highest resistance level in its history.
Conclusion:
As the priceline of Ethereum has been reached the highest resistance level in its history. This big harmonic Gartley move is a powerful signal that the priceline of Ethereum is again going to make a big move like 2016 to 2018, and it can be doubled than the previous rally.
ETH buy the dip.Ethereum - Intraday - We look to Buy at 1116.5 (stop at 1064.4)
Daily signals are bullish.
A lower correction is expected.
We look to buy dips.
Bespoke support is located at 1100.
200 4hour EMA is at 1100.
Our profit targets will be 1273.1 and 1335.1
Resistance: 1350.0 / 1380.0 / 1440.0
Support: 1220.0 / 1180.0 / 1100.0

ETHEREUM - We remain BullishOur updated Ethereum chart. Shake-offs were opportunities to Buy again and we remain bullish on the asset. Unlike the previous month that we were focused on Bitcoin I remain focused on Ethereum at this stage simply because the fundamentals are strong (new version and CME futures) as well as the fact that the price of Ethereum keeps flirting with new all time highs, thus more headlines and new investors.
All this until February 8, where as I have stated before it will be time to short it.

Ethereum 4~5k+ TargetEthereum 2017 ATH Scenario
1) Ethereum daily candle closed just 6 days above U$1.200 (major resistance);
2) Ethereum touched just one time U$1.400;
3) 4 days after touch U$1.200, dropped down to U$770;
4) 24 days after touch U$1.200, dropped down to U$550;
Atual Scenario (2021 ATH)
1) Ethereum daily candle closed 17 days above U$1.200 (major resistance)!!!
2) Ethereum touched 4 times U$1.400!!!
3) 12 days after touch U$1.200, went up to U$1.400.
4) 21 days after touch U$1.200 (today), the price is U$1.300.
Comparison of scenarios
It is very obvious that the current scenario is totally different from 2017 ATH.
The ATH range (U$1.200 ~ U$1.400) is maintaining itself and does not want to fall, there is a lot of buying power close to ATH.
It's just a matter of time to break $ 1,400 and rush to 4~5k+ level.
PS: I believe it will happen this year, in the coming weeks / months.
PS2: When ethereum breaks ATH, with daily candle closing above U$1.500, alt season will start strong.

Ethereum in channelETH / USDT
price move in channel...
We can see now price lost middle line support of channel if it can't back up quickly then there is high possibility to test the lower trendline
We can see also 200EMA Dynamic support at lower trendline support
this area can rebounce the price if reached
The bulls should hold this zone well for ETH to remain Bullish
Good luck

Another ETH expectation (not official)Hi, this post is not official and is not 100% proabable.. do not consider it in your decision making.
Follow us and like and share this post to support us.
Regards

Ethereum Buy a break setup.Ethereum - Intraday - We look to Buy a break of 1484 (stop at 1414)
Price action resulted in a new all-time high at 1475.
A break of 1475 is needed to confirm follow through bullish momentum.
Daily signals are bullish.
We look for gains to be extended today.
We can see no technical reason for a change of trend.
Short term RSI has turned positive.
Our profit targets will be 1694 and 1784
Resistance: 1475 / 1600 / 1700
Support: 1380 / 1300 / 1220

ETH - Time to buy againOur updated chart. Can it go to all time highs? Yes it can.
Could it just correct lower? Yes it can
Why do I buy it? Because it's right on support. I use stop losses and do intra-day trading.
Ethereum price potential to $3,000 becomes apparent
Ethereum holds firmly onto support at the 50 SMA on the 4-hour chart.
ETH begins the uptrend afresh, targeting levels above $1,500.
A possible double-top pattern could jeopardize the rally to $3,000 and perhaps lead to more losses.
Ethereum has been adamant to follow in Bitcoin’s footsteps over the last couple of weeks. The flagship altcoin executed its own rally even after BTC ran out of steam. The rise to a new all-time high was particularly encouraging to the investors, whose confidence in recovery to levels around $3,000 has increased greatly.
Ethereum seeks higher support before resuming the rally
The recent spike from the support slightly above $1,100 elevated Ethereum to highs around $1,481 (on Coinbase). It was clear that buyers eyed an upswing past $1,500 but Ether lost momentum, leading to a reversal.
The 50 Simple Moving Average on the 4-hour chart has provided support for Ethereum at $1,300. ETH is trading at $1,365 as bulls push for a return to price levels beyond $1,400. The Moving Average Convergence Divergence or MACD suggests that Ethereum is gradually falling back into the hands of the bulls, evidenced by the move into the positive territory.
Trading above $1,400 will add credibility to the expected move past $1,500. Moreover, a move of this magnitude could trigger the fear of missing out (FOMO) as investors rush to take advantage of another rally targeting $3,000. According to the Chief Technology Officer at Bitfinex, Paolo Ardoino:
"The Ethereum price has pierced another all-time high. The potential of ether is becoming more and more apparent as it demonstrates a formidable capacity to support many projects. Ethereum is a key platform for building blockchain projects and is an integral part of launching decentralized applications. With DeFi protocols exceeding $19B in TVL and showing no signs of decelerating, we may see the price of ether grow alongside its use."
Looking at the other side of the fence
It is worth noting that Ethereum may slow down the uptrend if the double-top pattern on the 4-hour chart confirms. This will likely increase the selling pressure in the market, hence delaying the breakout. Moreover, losses may come into play that may retest support at the 50 SMA, 100 SMA, and 200 SMA.

Ethereum on the road to usd2000? Ethereum is still bullish on all timeframes despite the Btc selloff, and has the chance to outperform Bitcoin this year!
Please leave me a message if you want to test the buy and sell indicators that i am using.

ETH broke Monthly resistance since 2018ETH / BTC
ETH finally broke strong Monthly resistance since 2018
This can open the way for ETH/USD to achieve new ATH soon
Weekly candel closure is important (after few hours from now )
But most important one is the next week for BTC and all the market (Monthly candel)
Take care because big move soon in market

Key ETHUSDT step to new ATH...Market is currently in the bull leg of a broad rising channel and price is currently stalling at 1350, which has been a key price level if you look to the left.
Break that and there's no reason we should not attempt a new ATH shortly.


