Ethereum 4 hours vs 1 Day timeframeEthereum receives a sell signal on the 4 hours timeframe, but still a buy on the daily.
Please leave me a message if you want to test the buy and sell indicators that i am using.
Ethereumusd

ETHEREUM - Attempting to buy this dipOur updated chart, we already tried to buy the dip this morning unsuccessfully but this attempt now seems to have good chances to succeed.
A dip after a new high, just another day at work really.
Let's rise Ethereum!
ps. in this case stop loss is a must, i already hit one today, attempting it again now, persistence wins. You can always try small and compound it once it goes well.

LTCBTC can reach the ATH nowCritical resistance:
In the US Dollar market, the price action of Ethereum is crossing a critical resistance zone. This area starts from $1200 and ends up to $1600.
25 SMA broken out:
Now if we switch to the Ethereum with Bitcoin pair chart. Then on the weekly time frame, the price action has broken out the 25 simple moving average and moving to the upside to 200 simple moving average. Once the 200 SMA will be broken out then a very powerful bull run can be started.
This move can be the same as in the US Dollar market when the price action broke out 25, 50, 100 and, 200 simple moving averages and the smallest time period moving average moved above all and the biggest time period MA moved below all. Then the priceline of Ethereum reached very close to all-time high price.
Conclusion:
The priceline of Ethereum has achieved another milestone by crossing up the 25 simple moving average with Bitcoin pair weekly chart. If the 200 SMA will be broken out then it can reach the all-time highest price in the Bitcoin market as well.

ETHEREUM - New ATH before shorting big on February 8th? Why?
Because CME Group to Launch Ether Futures on February 8, 2021
Will share more with you all before time. Maybe find the hint on this previous video about Bitcoin, the city of Chicago, the bears and bulls. (from 0:45 to 4:00 mins you will find the hint, it's loud and clear)

ETHEREUM to $33k By 2022Ethereum path to $33k by 2022. My biggest allocation.
#Ethereum #ETH
-CryptoCurb

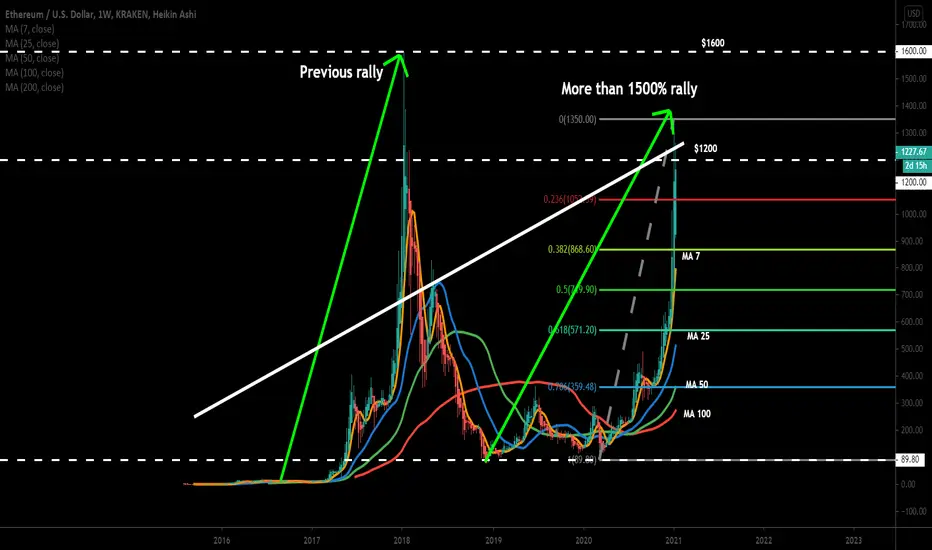
ETH completing another setup to turn more bullish in long termThe importance of SMA 7 and 25:
The previous rally of 2017 ended when on the weekly chart, the simple moving average 7 crossed down the SMA 25. This time sofar the price action is retesting, again and again, the SMA 7 and did not break down it sofar.
Critical resistance and Cup & Handle Formation:
On the long-term weekly chart, the price action is in a critical resistance zone which starts from $1200 and ends at $1600. Here the price action has found the resistance of Cup and Handle pattern at $1200. And retraced almost up to 0.382 Fibonacci level to complete the handle of Cup.
Attempting breakout resistance in the Bitcoin market:
On the Ethereum with Bitcoin pair’s weekly chart, the price action of Ethereum has formed a strong uptrend line support. And now trying to break out the 25 simple moving average resistance.
Conclusion:
If the price action will break out the 25 simple moving average resistance in the Bitcoin market. Then it can turn more bullish against Bitcoin and a very strong bull run can be seen in the US Dollar market as well.
For harmonic trading signals join:
www.patreon.com
Ethereum price meets imminent barrier above $1,200
Ethereum recovers tremendously following a recent breakdown to $900, prices rise above $1,200.
ETH/USD is dancing in the confines of a rising wedge pattern; a correction seems imminent in the near-term.
Ethereum has recovered considerably after falling to $900 earlier in the week. The price action was lock-step at first, mostly due to the resistance at $1,100. However, Ether managed to overcome the hurdle, leaving an open-air for exploration. On hitting levels above $1,200, ETH’s uptrend appears to be grinding to a halt and might give way to a pullback if a chart pattern is confirmed.
Ethereum draws closer to a rising wedge pattern breakdown
The largest altcoin is also trading at the apex of an ascending wedge pattern, suggesting that a reversal is in the offing.
The bearish outlook forms when an asset's price ascends with pivot highs and lows while converging at a single point referred to as the apex. A breakdown usually occurs before the trendlines converge.
The typical breakdown is mostly confirmed by decreasing volume (highlighting a divergence between volume and price). Breakdowns are generally fast and drastic, thus need to be spotted precisely for them to be profitable.
Similarly, if Ethereum fails to hold above $1,200 losses might still come into the picture. Additionally, the 50 Simple Moving Average on the 4-hour chart must be defended at all costs to ensure that massive declines are kept at bay.
Nonetheless, it is worth noting that Ethereum will sustain the ongoing momentum if support above $1,200 is kept intact. The wedge pattern also needs to be ignored mainly by bulls focusing on the next crucial hurdle at $1,300. Price action beyond this level could see ETH/USD rally to $1,400.
Ethereum intraday levels
Spot rate: $1,225
Relative change: -6
Percentage change: -0.5%
Trend: Bullish
Volatility: Low


Ethereum will wake up in 2021 {ETH}This is my vision for the coming months. Ethereum is currently behaving against its ability and potential, so it does not sell its eth, but buys more, this year new capital funds will enter the game, and the ethereum project itself will be more extensive.
This year will be good for eth

ETH price TARGET revision + where to GET INEthereum is going down like crazy. Yeah, it was overbought, and yes, the previous rise was massive, but I understand that many buyers just wanted to be IN. So if you bought it higher, and now you need to dilute your position, I can show you some levels to enter into ETH.
Despite this massive fall, we are still bullish, but... It does not mean that we can't go lower. If you are prepared to BUY, save some cash for lover levels.
Here you have levels for LONG positions:
$939
$905
$853
$831
$805

ETH 1D pattern "Cup and handle" is worth readingIt is very likely that the model "Cup and handle" is formed on the ETHUSDT chart.
The cup has been forming for 3 long years, or 1095 days.
The ETHUSD price could not overcome the previous high of $1440 at the beginning of 2018. As of now, a high is $1350.
Given that BTCUSDT has updated a high of more than twice, logically, the ETH price should be around $3000, but it did not happen.
According to the formation rules of the pattern "Cup and handle" , the formation of the handle cannot last longer than 1/3 of a cup, ie a maximum of 365 days or a year until the next powerful impulse.
We already feel how we will be hated for such thoughts), because everyone thinks: growth, growth, only growth!
Ideally, the smaller the handle, the stronger the shot up. Therefore it is necessary to watch carefully formation of the handle, and to do it on the given chart it is necessary to like and to write the comment!
We assume two levels for the formation of the bottom of the "handle" - they are $470 and $350. The process of the price lowering there will be long and tedious, especially when most do not believe it yet.
We take this global idea as a basis and we will generate short-term ideas based on it, with targets closer.
For example, now the most logical fall to $800 or even to $600, from which we can expect a solid price rebound.
Another important condition in the formation of the "handle" is the volume: in the first half of the "handle" they must be low, such as reluctant fall, no one believes in it and does not sell.
As soon as you see that the average daily volumes begin to grow, it is worth thinking about buying.
Or even easier, follow us and we will tell you :)
Follow the market in cold blood, without rose-colored glasses and then your deposit will increase.
You are not the creators of projects to fanatically believe in them. You are traders - bought-sold, put the profit under the mattress :)
PS:
We wrote about a possible BTCUSD cost fall two days ago in the weekly digest, read it in full)
_______________________________
Since 2016, we have been analyzing and trading the cryptocurrency market.
We transform our knowledge, trading moods and experience into ideas. Each "like under the idea" boosts the level of our happiness by 0.05% . If we help you to be calmer and richer - help us to be happier :)

ETHUSDT 1,125 key level broke. More weakness ahead?Unless buyers take that level back, we should see further weakness or more sideways to down price action. Market seems to be attempting a bottom right now so we shall see. Volume is wanting but it could attract more buyers if current levels hold.

ETHUSDT, short to 1000. After passive solds.Hi everybody. So we have a picture when big players sold too much ETH near strong and maximum daily level 1253. After that price go down to 1105 but there nothing investions on this downward part. And thats why i think 1000 its a better price for medium term investments.

ETHUSDT just bounced off that 1,125 key level... Now to ATH?Yes, please. ;)
We may still see more trading range price action (note the lackluster volume) but as long as 1,125 holds on a daily closing basis, short-term buyers should be on the right side of the market.


ETH (next is 1250$-1350$)ETH / USDT
Ethereum Brokeout above Ascending traingle after 5x test
Now ETH should hit new local high soon
Next target = 1250 - 1350 (weekly resistance)
=> Trendline + EMA 50 should HOLD
And candels not closing below to remain bullish
If you like my ideas support me
by likes comments and follow
Good luck 🤞

ETHUSDT stalling below very key level. What's the significance?1,125 (based on Binance data) is the highest monthly close since JAN-2018. This should be a very significant price to break and would become a strong support level if price does go higher, which IMO is quite probable in the near term.

ETHUSD an expected Cup & Handle Can Lead it to $2200Hi friends, hope you are well and welcome to the Ethereum.
A powerful breakout:
Previously I shared two major moves with you in 2020. One was the Ethereum coin found a weak Ichimoku bearish cloud resistance on the weekly chart and it was expected that this time the Ethereum will breakout this cloud with a powerful bullish divergence.
The second was the big Gartley move on the monthly chart and the priceline was entered in the potential reversal zone of this harmonic pattern.
Finally, the price action of Ethereum coin started a powerful bullish move and rallied from $131 to $1150.
Now the price action is moving above the Ichimoku bullish cloud, and the bullish cloud is moved up at $750.
A big Cup & Handle formation is expected to hit $2200:
On the long-term monthly chart, the price action has formed a very big soft round shape move and found a resistance at $1150. If the price action will be rejected from here then a rally to the downside can complete the Cup & Handle bullish reversal move. This bearish rally can be up to the half of the bottom to the resistance of the Cup, which is $550 approximately. Now if we take the measurement of the hight of the Cup from the resistance to support, and place it at the breakout point then the next target can be $2200 at least.
The EMAs on weekly char and the combination of indicators and oscillators:
If the formation of handle starts then we can expect that the priceline of Ethereum can test the exponential moving averaged 21 on weekly time period chart, that is at $550 at the time of writing. I am also using some additional indicators to get more confirmations. Here I have placed the moving average convergence divergence (MACD), Stochastic and Momentum indicators. At the moment the Stochastic has given bear cross (sell signal) from the oversold zone, but we should wait for MACD and momentum indicators to turn bearish as well, then it can be a confirmation for the starting of correction rally that can complete the formation of the handle.
Conclusion:
If the price action of Ethereum will be rejected by $1150 resistance then it can form a big bullish reversal Cup & Handle that can lead the priceline to $2200 in coming days.

ETHUSDT, short after rebuy was sold.Hi friends today ETHUSDT and i want to help you with it. I mark all interesting market processes on ETHUSDT chart window. Like you can see exchange sold all purchases. So we go down - it's my opinion - it will be a second way (2 way).
Levels thanks to X-Lines script. Bears target 922.5 and 786.4.
Follow me. Tell a friends ;)

Ethereum next possible moveEthereum possibly making wave B of (Y) in the simple corrective structure.
I am expecting a further fall in price to a minimum of 850

Ethereum on the verge of Parabolic moveBITFINEX:ETHUSD
Ethereum and the rest of the Altcoin market is on the verge of a 2017 like parabolic move. The purple fractal that is overlaid is the 1W BTC/USD chart, and as you can see Ethereum has always mimic'd the moves of big brother bitcoin, so i expect a move similar to the blue fractal on the chart to play out in the coming weeks. This would reflect the recent parabolic move Bitcoin has just about completed, setting up a altseason rally in tandom with the fractal to support my analysis.
In addition, this channel should trade well and shows that PA is at the very bottom near support, putting a test of the channel top at about $2250 in the future.
- PennyBags

ETHUSDT, chance to short now from 748.Hi friends. Level 748 is a strong X-Lines daily level in past. So i think that price can fall price to x-lines level 705 in near time. Follow me.
