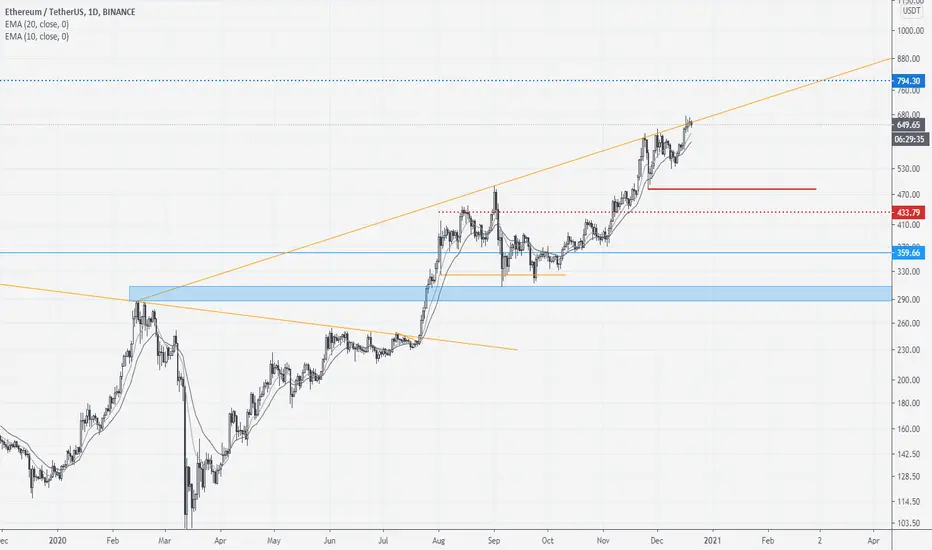
ETH 12h Bearish wedge - a fall signal2 weeks have passed since the previous global idea was published. The time has come to correct it, since the idea work out stopped halfway.
The previous idea was published when the ETH price was $610 , from where the clearly predicted fall stopped at $535 (a low was $530).
Then there was the predicted growth from the level of $535, but it stopped, exactly halfway to the target of $780-800, fixing a high $676.
The ETHUSDT price has been falling for the last 2 days. The fall stopped at the lower limit of the bearish wedge.
Now the most positive scenario that can be expected is a rebound to $650-655.
If buyers are unable to raise the price above $655 , then sellers will start to press, lowering the price to $610 first.
And when the boundaries of the wedge break down, then the fulfillment of the "Bear Wedge" pattern with the lower targets of $450-480 is activated.
The option of fixing the price above $660 and moving further towards $800 is still unlikely.
_______________________________
Since 2016, we have been analyzing and trading the cryptocurrency market.
We transform our knowledge, trading moods and experience into ideas. Each "like under the idea" boosts the level of our happiness by 0.05%. If we help you to be calmer and richer - help us to be happier :)
Ethereumusd

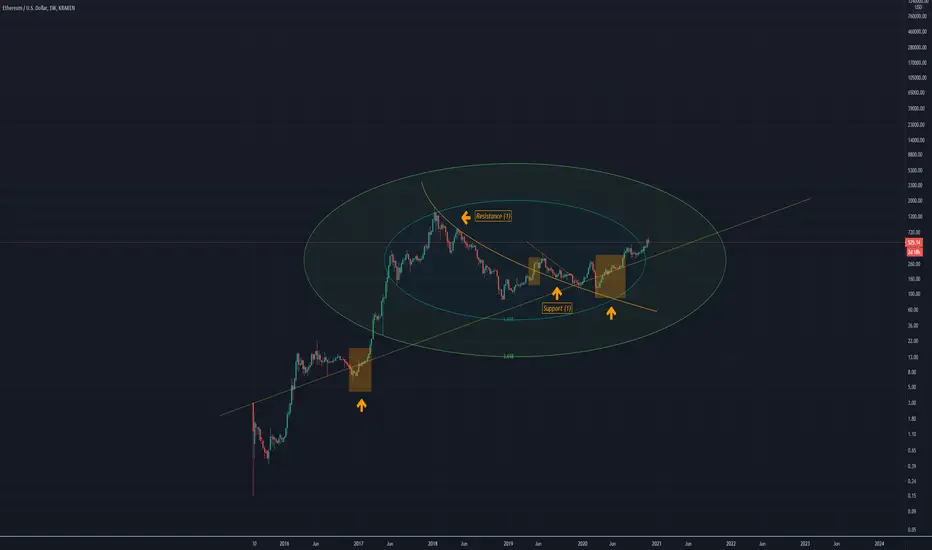
ETHUSDT stalling at the 650 level. Here's part of the reason whyMarket is reacting to resistance trend line drawn from the FEB-2020 HIGH. Looks like a rising wedge that could facilitate a bear leg to re-test previous lows. I have my doubts we will see a big pullback mainly because of the strength of the preceding trend but don't take my word for it. A target for such a pullback would be that 480 level (good buy level for me). If we see a weekly close above 650, increased chances of market seeing 800 first before any non-trivial pullback.
Still bullish overall of course.
Ethereum - Daily UpdateBottom Line: Bullish against 310.95.
Key Levels: Below 370.83, 310.95, 315.36 Above 488.12
Outlook: Expecting ETH to recapture its 488.12 high and beyond.
Analysis: The break above 460.02 signals the fourth wave triangle consolidation discussed yesterday is complete, and the further move above 468.42 today puts Ether back on track to challenge the next upside hurdle at 488.12. The bulls are in control while 441.16 stays intact as support.


ETH/USDT ( very important zone )ETH/USDT
Ethereum price now resting above 3 supports :
1- Trendline support since beginning of November
2- also we can see 200EMA just little below (Dynamic support)
3- Another support we are also on 0.618 fib level (540$)
If next candels closed below this mean high chance we can drop further more to 515-480$ area
Possibility of drop is higher
However if bulls enter here and next candels closed above the trendline again this mean bearish scenario is invalidated and we go up
And you should ready for anything
Do you agree ?
Never trade blindly and always have a plan
Good luck and happy trading for you all 🌹

ETHUSD formaing bullish BAT | Upto 22% move expectedOn 4-hour chart, the price action of Ethereum is completing the final leg of bullish BAT pattern, soon it will be entered in the potential reversal zone.
Buying And Sell Targets:
The buying and sell targets according to harmonic BAT pattern should be:
Potential reversal or buying zone: $ 513.56 to $ 497.91
Fibonacci projection or sell zone: $ 550.86 to $ 607.51
Stop Loss:
The potential reversal zone area that is up to $ 497.91 can be used as stop loss in case of complete candlestick closes below this level.
Possible profit and loss ratio:
As per above targets this trade has a profit possibility of 22% and as per the above-mentioned stop loss, the loss possibility is 3.1%.
Note: Above idea is for educational purpose only.

ETHEUR Impulse observation(2) up
(1) down
Pair of scallops.
This is not a forecast just an observation.
Right now I am concerned about the disconnect crypto seems to have from SPX and others.
Everything seems to be bullish in the crypto world (well, mostly)
Its hard to call what this disconnect will lead to.
However im just expressing my thoughts, of course.


Ethereum - Intraday Update - 12/03/20 (Short-term)Ethereum - Intraday Update - 12/03/20 (Short-term)
Bottom Line: Subdividing higher within wave iii of (iii)

Etereum (ETHUSDT) - platform launch took place[b ]Global trend up
Local trend up
Break out mirror level
to the moon!
You will learn the best place where we can trade this instrument at low risk.
Write in the comments all your questions and instruments analysis of which you want to see.
Friends, push the like button, write a comment, and share with your mates - that would be the best THANK YOU.
P.S. I personally will open entry if the price will show it according to my strategy.
Always make your analysis before a trade
last idea

Anoher Potential Scenario As Bitcoin has been rejected from ATH, and exposed to a harsh sell off while dragging the the altcoins downward as well.
Although the 850usd of 2. price target is on the way on the longer time frame , a mid target might form while whole crypto market waits at BTC ATH treshold.
A potential scenario might reveal itself in the coming days
That a reverse flat bottom triangle might also point to a 756 usd target which also coincide with my previous target of 771 usd.
Remember that these targets are all mid way targets.
For now, for ETH for the seeable future, the pattern points to 1.450-1470 Levels

At KEY resistance level can it break through this time?*DISCLAIMER: I am not a financial advisor and this is not financial advice as these are purely my opinions and speculations. I may also own or trade any of the symbols and cryptocurrencies mentioned in this video so do not make your trading or investing decisions based on this video. I do not guarantee any results nor am I responsible for your actions. You should always do your own due diligence before trading or investing in this market as it is extremely risky. Affiliate links are also included in this same video description section here and if you decide to support me by using any of them, I may receive a referral bonus or commission.
*Follow me for the latest cryptocurrency analyses on my watchlist
*Thank you to those who donated, I very much appreciate it.
*Let me know in the comment section if you agree or disagree, would love to hear your ideas too.

ETH bullish bounce & next resistance levels to watch for*DISCLAIMER: I am not a financial advisor and this is not financial advice as these are purely my opinions and speculations. I may also own or trade any of the symbols and cryptocurrencies mentioned in this video so do not make your trading or investing decisions based on this video. I do not guarantee any results nor am I responsible for your actions. You should always do your own due diligence before trading or investing in this market as it is extremely risky. Affiliate links are also included in this same video description section here and if you decide to support me by using any of them, I may receive a referral bonus or commission.
*Follow me for the latest cryptocurrency analyses on my watchlist
*Thank you to those who donated, I very much appreciate it.
*Let me know in the comment section if you agree or disagree, would love to hear your ideas too.


How we know ETH is in a Bullmarket!Resistance and support labelled (1)
The support can be viewed as the transition to the bull market.
This will lead to a new ATH!
Check out some of my other work on ETH it will help.
I recently added some ETH to my portfolio. Happy black Friday!
ETHUSD Reaching Higher LOWS - Verge of BREAKOUTIn the last two days, ETHUSD has made significant higher lows to reach over 600$ which is a very refreshing time for ETH HODLers and Traders. While comparing to the BITBAY:BTCUSD reaching it's All time high, ETH still has a long way to go to break it's ATH from 2-3 yearsa ago.
We had a similar breakout on Nov 18th-19th after a good consolidation. Currently the charts indicate a converging candle stick chart as the range reduces into a squeeze.

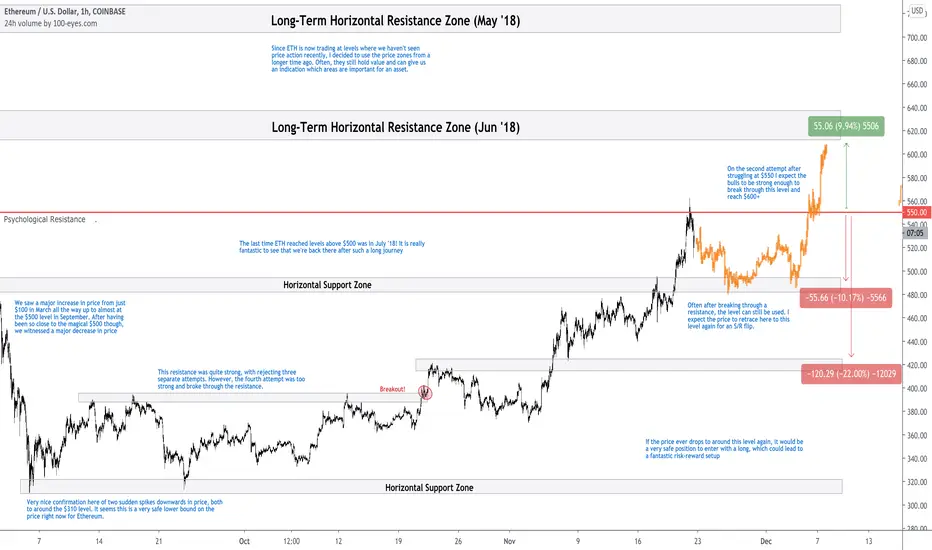
The Most Important ETHEREUM Levels After The Rejection At $550!All information can be found on the chart. I tried to make it as self-explanatory as possible. In case you still have any questions, free free to leave a comment or send me a personal message.

ETHUSD BUYWe tested and held the neckline nicely(purple), now we need to hold 460 level to move on to 600-800 range

Ethereum is clearly in up trend Ethereum might be 490Ethereum is clearly in up trend Ethereum might be 490


