Ethereum Chart Pattern AnalysisChart Pattern Analysis
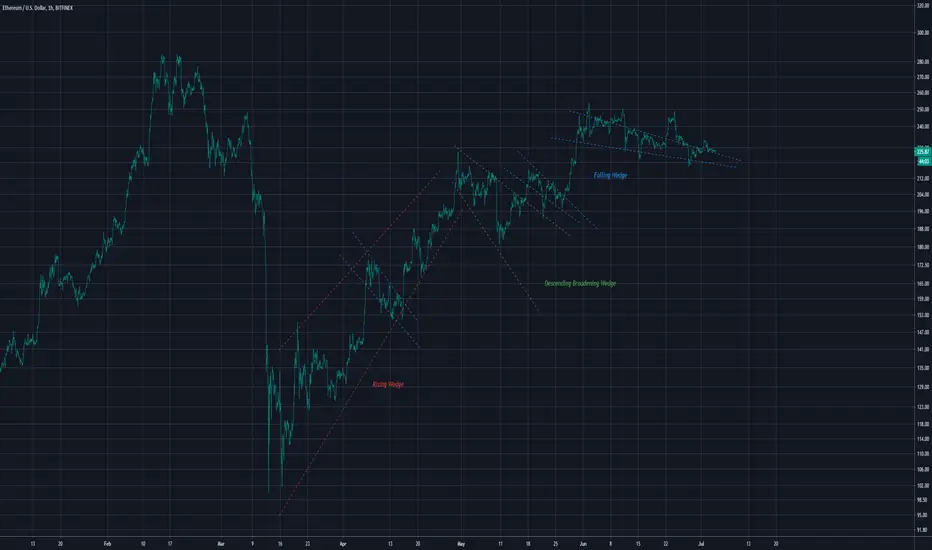
Falling Wedge - A bullish pattern that begins wide at the top and contracts. A bullish reversal pattern.
Descending Broadening Wedge - A bullish reversal pattern, Expanding cone, often mistaken for bearishness due to its downward sloping nature. But this pattern is definitely bullish. As seen on chart.
Rising Wedge - The opposite of a falling wedge, a bearish reversal pattern. Begins wide at the bottom and contracts.
A very speculative chart for Ethereum, i just like the look of it.
I believe The alt coin market and general cryptocurrency market is setting up for a bull run
Enjoy
Ethereumusd
ETH Short Set Up with Great Risk to Reward RatioThis chart screams short. Look for trendlines, bearish rsi divergence, support and resistance, Triangle pattern, seller exhaustion and distribution evidence all within this one multiyear chart.

ETHEREUM TO $450. THE JOURNEY HAS STARTED.Sometimes a simple chart is the best one. Strong cluster of resistance at $325-375, past that the fun starts. #DeFi is blowing up. We will chart ETH consistently along with the sector. Have fun, be smart. Weary of any leveraged positions at the moment. Once we establish $350-400 as support...then we break out the leveraged contracts and protect our downsides with hedges. More on that soon!!

🐻 Potential Major Rejection For Ethereum. (ETH)💰 LET'S GET INTO SOME LONGTERM ETHEREUM ANALYSIS!💰
1️⃣ First off SMASH that LIKE BUTTON & Give us a FOLLOW for DAILY ANALYSIS! ❤❤❤
(Overall Market Sentiment) 🐻 Bearish
- We have been trapped under a major key level of resistance at 253.40,This resistance level is the main level that will determine what happens next in the Ethereum market. I have labeled it as (King Of All Resistance) at the top of the chart.
- The dashed line that I have labeled as "Must Be Broke For Bull Continuation" is what you will want to play for a long as that is multi structural downward Resistance. Break that and 253.40 for a power move!
- The previous 2 weeks started with an engulfing bull candle but followed by a bear engulfing candle to reject from the key Resistance level. Now we have been forming a DOJI candle to show indecision but notice it is forming beneath the last 2 engulfing candles on the low. If we close here this could be a lower low.
- You can play short below the previous candle low and use a 1% stop loss or exit as soon as we push back above the previous low. Keep playing the previous low as we could anticipate the short to drop. Only play long on breakout of key Resistance dashed line.
- The EMA DOTS indicator on the bottom does have an alignment of all 3 dots firing the same color. We use this to help identify trend reversals in any market.
- Remember that all of this is still in motion and will not close till (June 22, 2020) You always want to make sure that the timeframe closes for a more solid trade opportunity.
So overall we are just waiting for a breach on key S&R Levels. We are leaning bearish for now. Don't forget to use your tight stoploss on the breakouts and to never marry a bad trade! Cut loss when needed. Stay patient and let the trade come to you! Enjoy your weekend and stay safe!
Thanks for checking out our analysis! ✌😁✌
🥇MLT | MAJOR LEAGUE TRADER

ETHUSD some bearish signals on long term chartHi friends hope you are well and welcome to the new update on Ethereum. This coin is going really very good even better than the Bitcoin but on the long-term there are some weak bearish signals are appeared, therefore I would like to share those signals with you guys.
The price action is re-resting the previous resistance as support:
Firs of all I would like to show you the different support and resistance levels of Ethereum on th daily chart. Here the price action has bounced from $122 support and broke out the next resistance level of $149. And after breaking out it used previous resistance as a support and then priceline first attempted to breakout the next resistance of $224 and after being rejected by this resistance the price action again moved up made another succeful attempt and broke out this resistance level. At this time the priceline of Ethereum is retesting this previous resistance as a support. If this support will be broken down the Ethereum can reach at previous support at $149.
Comparison of channels of Ethereum and Bitcoin:
If we see the comparison between the up channels that are formed by the Ethereum and the Bitcoin on the day charts. Then position of Ethereum is seems to be stronger and better than Bitcoin. At this time the price action of Ethereum is moving within the up channel but on the other side the BTC has broken down the support of channel. And now the priceline o BTC is moving below the support of the channel. If we watch the exponential moving averages with the time period of 10 and 21 then both are touching each other.
Comparison of Ethereum and Bitcoin’s simple moving averages:
If we watch the simple moving averages with the time period of 25, 50, 100 and 200 of both charts. Then Ethereum has just broken down the 25 simple moving average today and on the other side the Bitcoin broke down this simple moving average before the Ethereum at this time the price action of Bitcoin is at 50 simple moving average support but Ethereum can move all the way down the retest the 50 simple moving average support and this time this support is at $218.
However the moving averages on Ethereum’s chart has completed the setup for an open alligator mouth. That is a very strong bullish signal. As the 25 simple moving average is above all then we have the 50 simple moving average then 100 and the biggest time period simple moving average that is 200 is below all the other moving averages. But on the Bitcoin chart the 100 simple moving average needs to cross up the 200 simple moving average in order to complete this bullish setup. Therefore we can say that Ethereum is more bullish than BTC. And if the Bticoin will make any bullish move then Ethereum will make more bullish move than BTC.
A big descending triangle and my prediction of 180% bullish move:
Now if we watch the Ethereum price action on the long-term weekly chart. Then it has formed a big descending triangle. I am observing the movement of the price action within this triangle with the combination of stochastic and MACD indicators. And it can be easily seen whenever the price action reaches at the support and we receive bullish signals by the stochastic and the MACD indicators then the price action moves up to the resistance of the channel. By repeating this act the Ethereum price action first produced more than 355% bullish rally, then it produced more than 150% bullish move and recently it has produced more than 180% gains. Using the same method I predicted this last bullish rally in my previous article that I posted on 28th of March when the price action of Ethereum was moving at the support of this descending triangle as below:
Previous article:
Now at this time we can see that the price action has reached at the resistance of this descending triangle and the stochastic is still in bull cross but the MACD has turned weak bullish from strong bullish. This is the first indication that it is turning bearish now we should observe if the price action would be moving at the same level and the stochastic would be in bull cross and MACD indicator will be again turned strong bullish from weak bullish, then we can expect that the price action will break out the resistance of this triangle. Otherwise it can move down to the support. I have also play the volume profile on the complete price action. And that is showing that the price action is moving in the area where the trader’s interest is really very weak. That is another indication that the price action can move down to the previous support from here.
Conclusion:
On the daily chart the Ethereum is more bullish than Bitcoin. It means that whenever the BTC will move up then Ethereum will make big move than the Bitcoin. But on the long-term as it has reached at the resistance of the triangle therefore we need to observe all indicators and signals very closely for any upcoming bearish is move.


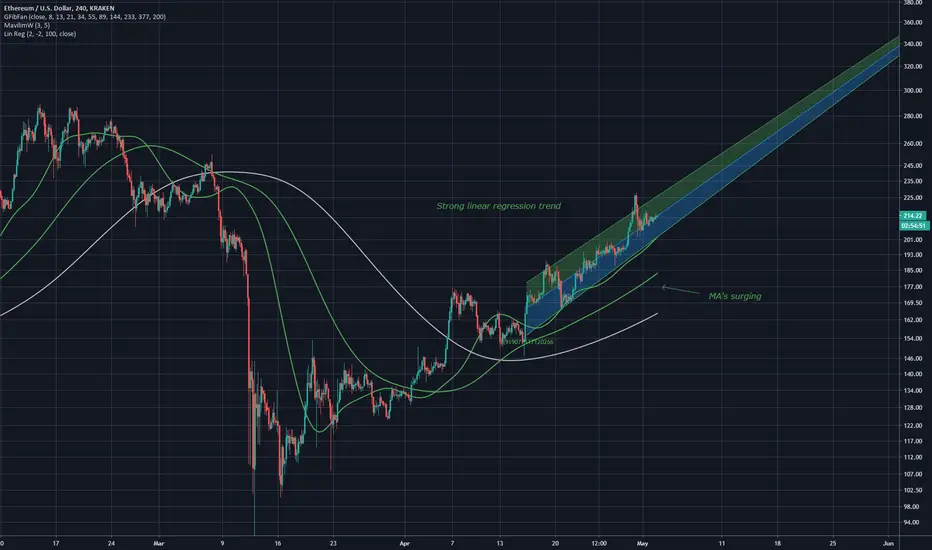
ETH big move - Linear chartBull flag right below long term trend line
Looks good
Using linear instead of log

ETH similaritiesSimilarities to previous take off point
Bored sketch
Labelled in (1)
The bars pattern is of course highly speculative.

ETH|USD Ethereum price drop.Hello, everyone. Thanks for reading.
You can sell, risk reward is good.
Thanks for reading
Dont foreget to leave a like if you liked my idea


Ethereum AnalysisBroke out from a falling wedge
looks good for a buy
Multiple rising wedges have appeared pretty interesting, and the wedges appear to be layering themselves ONIONS HAVE LAYERS

Ethereum a possible 15% drop coming !Ethereum is trading inside a bearish channel, now price is near the resistance of the channel | If price can't break through the Resistance and can't stay above the trend resistance then we can consider initiating a short a position. The trend is already bearish.
Risk Reward Ratio (RRR) = 1 : 4

Ethereum Rising Wedge Bullflag IdeaCurrently sitting above the descending broadening wedge that has formed
I believe this could be also a flag for the rising wedge which could be acting as the pole
strong difficulty at .382
Another broadening wedge on ETHBTC, except ascending

These 3 signals can turn Ethereum more bullish than BitcoinHi friends hope you are well today I want to share with you three major significant signals of ethereum that can help you understand when the ethereum is going to make a very big bullish move. This article will be also helpful to have an idea whether to invest in Bitcoin is will be more beneficial or to invest in Ethereum is more profitable.
After Bitcoin halving 1st bullish rally of Ethereum and 1st bullish signal the market cap:
After previous Bitcoin halving which was happened almost on 11th July 2016. The price action of Ethereum started bulish rally. And we have witnessed that the market cap of Ethereum was increased. If we see the coinmarketcap data of Ethereum on July 11th 2016 then at that time the closing price of the Ethereum was $10.46 and the market cap was 856.5 million dollars. Then first rally was started that was upto 12th June 2017 and at that time the market cap of Ethereum was increased by 37.1 billion dollars. Its mean that the market was increased more than 4200%. The Ethereum reached at $401. That’s mean it rallied more than 3900%. Then the world’s second largest cryptocurrency started a correction rally.
After Bitcoin halving 1st bullish rally of Bitcoin and the difference between the profitability:
On the other hand if we watch the Bitcoin chart. Then after halving the Bitcoin started a bullish rally and upto August 2017 the BTC gained more than 650% value. Now if we compare this profit ratio with the profitability that was produced by Ethereum then it is more than 83% less.
The second bullish rally after correction:
After the 1st bullish rally of Ethereum that was up to 12 June 2017. We have witnessed a correction rally and after this correction rally the Ethereum started the next long term bullish move. And this time upto January 2018 the market cap of Ethereum was increased by 135.4 billion dollars. Its mean that the market was increased more than 15000%. And the price action achieved $419 price level that was more than 13400% bullish rally. On the other hand if we watch the Bitcoin chart. Then after little bit price correction the Bitcoin started next bullish rally. And upto Dec 2017 the BTC gained more than 3000% value. Now if we compare this profit ratio with the profitability that was produced by Ethereum then it is more than 346% less.
In these bullish rallies the important point is that the Bitcoin achieved the highest price ever in its history in December 2017. And when the Bitcoin was dropping down in January 2018 the Ethereum achieved the highest price ever in the history of ethereum. It's mean that after recent halving when the long-term bullish move will be started again. Then we can expect that first Bitcoin will turn bullish and achieve the highest price. And when the Bitcoin will be going through a correction rally or moving down then Ethereum can achieve the highest price ever in its history. And Ethereum can again produce far more big profit than the BTC.
Bullish rally of Ethereum:
Bitcoin rally chart:
Second signal the simple moving averages:
If we place the simple moving averages with the time period of 25,50,100 and 200 on the weekly chart of ethereum. And first look back before the previous powerful bullish rally from 2016 to 2017. Then it can be observed that when the 25 simple moving average crossed up the 50 simple moving average after that the price action of Ethereum never turned back and started the bullish rally that that was continued to one and a half years. As per coinbase exchange we did not have the 100 200 SMAs available at that time. Therefore we are only watching the golden cross between 25 in 50 simple moving averages. Now if we move to the current situation then it can be easily seen that the price action has crossed up the 25 and 50 simple moving averages. And at this time the price action is trying to break out the 100 simple moving average resistance. Once all these simple moving averages will form the golden crosses with each other then we can expect the powerful bullish rally like we have witnessed back in 2016 to 2017. At this time the 25 simple moving average is in death cross with 50 simple moving average. So we should at least wait for the 25 SMA to cross up the 50 simple moving average then there will be chances that the price action of Ethereum will turn bullish. However I would suggest to wait for all the golden crosses between all these four simple moving averages. For example the 25 simple moving average should be above all then we should have the 50 simple moving average then 100 and at the end of all these moving averages the 200 SMA should be below all these simple moving averages. Then a complete a opened alligator mouth will be formed. And the support of all these four simple moving averages the priceline can start very firm long term up trend.
3rd signal the ichimoku cloud:
Now I would like to discuss about the third bullish signal that can lead the price action of Ethereum to achieve the next highest price ever in its history. And that is the ichimoku cloud on the weekly chart. In order to notice the power of this signal we need to again move back in 2016. When the priceline of Ethereum crossed up the cloud in August 2016. And the price action started bullish move that was continued to next 1.5 years. Then after July 2018 since the price action of Ethereum has crossed down this ichimoku cloud it has never been successful to breakout this cloud again. From July 2018 to April 2019 there were very low chances for the price to cross up the cloud because the priceline was moving far more down than the bearish cloud. And the lagging span of ichimoku cloud was also at very big distance from the price action. Now at this time we can observe that the ichimoku cloud has turned very weak in the price action is making 3rd attempt to cross up this cloud. The lagging span has already crossed up the price action and now we can wait for the conversion line to cross up the baseline. This can produce a powerful bullish rally that can lead the price line to cross up this cloud and we can expect that once the priceline will breakout the ichimoku cloud then it will never turn back for next 2 to 3 years like it did back in 2016 to 2017.
Conclusion:
The Bitcoin can start a long-term bullish move before Ethereum and achieve more higher price level. Then Ethereum can start the upward move subsequently. But the profitability of a Ethereum can be more better than the profit ratio of Bitcoin. It is also possible that after acheiving the higher price level the Bitcoin will be moving down and in the meanwhile the Ethereum can start moving up to achieve the higher price level. Therefore it can be possible that many traders would be thinking that if the Bitcoin is dropping down then it is also a sell signal for Ethereum as well. But after selling they can regret like it happened back in Jan 2018.

ETH UncursedEthereum and Vitalik broke the Downtrend! but where they go is still uncertain :D
We can see only a little parts of EMA200 (red one) but enough to forecast a bit.
So we can see on chart ETH passed clearly EMA50 and EMA100 and looks like consolidating.
The first target for now it's to break EMA200 around 240$, if ETH is rejected we will have to wait more.
if it breaks 240$ it will be a free push to 300$ and here we got a big resistance line!
for now i will not recommend to buy until it breaks clearly 240$+.
i will add a far view to show that ETH Broke clearly his downtrend.
Stay S4fe and Happy Tr4Ding!

BTC'S BULLISH TRACK MIGHT GET ETH TO $275 - CryptoManiac101ETH / USD TA
Here we are looking at possible tracks for Ethereum, depending on which pattern gets validation in next few days.
Looking for possible target of around $275 in event we see bull flag validation in coming days.
We will be looking for under $100 targets in an event we see Bitcoin rejection off current resistance level and in an event $10,000 is not maintained as these two assets are directly correlated.

$ETH, Trying to break above descending trendline.. $ETH / #USD
Following our set up from May 14.
Trying to break above descending trendline on its way toward ~220$ resistance level (LL into HH into HL into HH 👌)
UCTS Buy signals on 8H & lower TFs
#ETH

ETHUSD Technical and Fundamental AnalysisBefore I start, I would like to welcome y'all to support by liking and following my page if you like what you see here : )
So far I have really enjoyed the experience here with the wonderful trading community, it is great to see the unbounded sharing of ideas by our fellow traders, so I thought of giving back as well.
Here are my two cents on ETHUSD:
H1 Timeframe shows a pretty obvious descending wedge, a (1) bullish flag with (2) Twice the formation of a bearish double top within the wedge, multiple times where it has touched the descending resistance line
Both times the formation of the double top has lead to a sell off to touch a major support level @ 198, thereby VALIDATING 198 AS A STRONG SUPPORT.
Technical indicators (1) MACD shows a greenish potential crossover to the positive side (2) Stoachastics show a 62 point, near the 80 buy zone
Short Term Opportunities to watch for:
- BREAKING OUT OF 209 would mean a retest of the nearest resistance level @ 212 and beyond that, targets for a BUY opportunity at TP1 @ 219 AND TP2 @ 226
- A SHARP REJECTION from the 208 descending resistance line would mean a SHORT opportunity to strong support line @ 198, breaking below this would bring us to the next 2 support lines @ 193 and @ 189
Long Term Fundamental Analysis:
Honestly I doubt ETHUSD could drop below 193 support which has been consistently validated from 25-29 April 2020. The long term outlook is currently BULLISH, with ETH 2.0 due for release in JULY 2020, which transits the current Proof of Work ethereum to a Proof-of-Stake Mechanism. This is very important to note, as instead of competing against each other to solve puzzles, users who accrue the most wealth, or stake, will be in charge of validating transactions in 2.0.
This definitely leads to a supply shock as users accrue ETH, possibly leading to a lock up of 30% of circulating ETH --> BUYING PRESSURE
Next, given a recent uptick in the number of addresses holding 32 ETH — the precise amount required for validators to stake in ETH 2.0 — demand, it seems, is already mounting. According to market intelligence firm Glassnode, there are currently over 116,351 Ethereum addresses containing 32 ETH or more — a figure up over 14% from last year.
My prediction: Price spike of ETHUSD is already partially priced in, with quite a number accumulating ETH for the staking in 2.0 release. The current ETH price flunctuations are likely short term position holders looking for quick buy and sell opportunities, with the majority holding for long. Once reaching the BTC sell-off post halving, some of the BTC holders may partially close LONG positions on BTC, taking profits, then putting more weight into ETH as the attention shifts to Ethereum 2.0 update. (Personally, I would only account maybe 30% ETH 70% BTC of my positions as I don't see ETH outperforming BTC in the long term, at least not by end 2020.)
Thank you for reading my two cents, feel free to comment your thoughts and feedback below!
Regards,
GolDRoger, a humble beginner trader

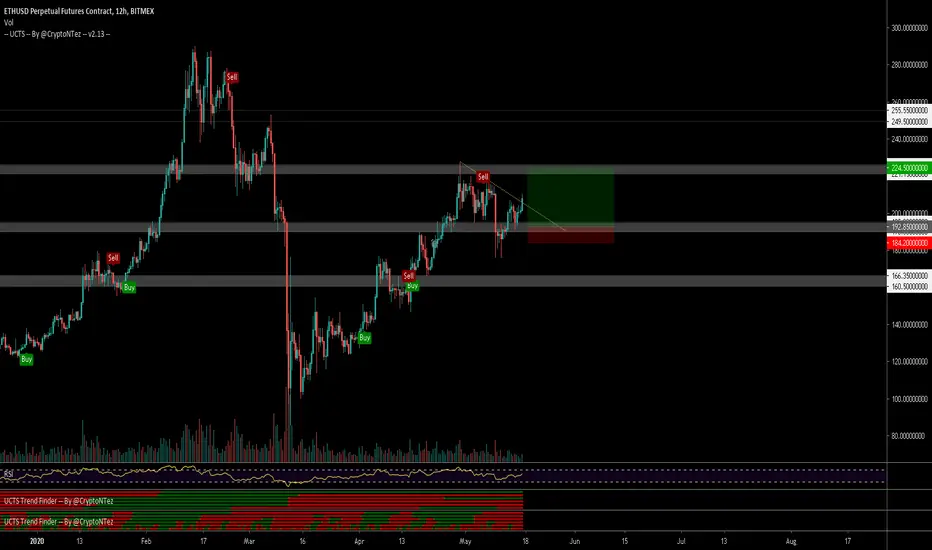
Don't miss the great buy opportunity in ETHUSDTrading suggestion:
. There is a possibility of temporary retracement to suggested support line (202.17). if so, traders can set orders based on Price Action and expect to reach short-term targets.
Technical analysis:
. ETHUSD is in a range bound and the beginning of uptrend is expected.
.The price is above the 21-Day WEMA which acts as a dynamic support.
. The RSI is at 50.
Take Profits:
TP1= @ 224.50
TP2= @ 245.00
TP3= @ 286.80
SL= Break below S2

Vitaliks Monster. (ETH)Bounce up testing the Resistance after bouncing off support.
Stay sharp.
Ethereum..