Ethereumusd
ETHUSD formed bullish Shark | Upto 25% potential movePriceline of Ethereum / US Dollar cryptocurrency is has formed a bullish Shark pattern and entered in potential reversal zone.
This PRZ area should be used as stop loss point in case of complete candle stick closes below this area.
I have used Fibonacci sequence to set the targets:
Buy between: 156.93 to 148.77
Sell between: 167.54 to 187.39
Regards,
Atif Akbar (moon333)

Ethereum (ETH)- ETHUSD-Buying Opportunity- 287% Profit Expected!Ethereum (ETH) - ETHUSD - Technical Analysis - 287% Profit Expected
Big Trade Coming With Huge ROI..
Based on AB=CD pattern , Time Ratio & Gann Analysis, It's a potential long position with great returns :)
In a lower time-frame (4hrs) this long position has also been confirmed.
Target Profit Range - 198 - 422
(55%-287% Profit Expected)
TP - 1 - 198
TP - 2 - 244
TP - 3 - 296
TP - 4 - 347
TP - 5 - 422
Buying Zone! Long Position
Early Entry Trigger Point - $121 -$135
Ideal Entry Trigger Point - $102 - $116
Adjust your Stop Loss according to your lot size,
account equity, strategy & money management.
***If you want to get in this trade from this point 174.8 you can still make 39.7% profit till TP2 is reached, however, there is a very high probability that price may continue to move down towards my ideal entry point., It is recommended to enter with a smaller lot size if you want to go long right away & manage your stop loss accordingly.
Good Luck.!
Disclaimer - This is not financial advice. This is my personal view and analysis of this chart.
If you follow this idea please plan your trade according to your lot size and account equity.
Don't forget to like, comment & follow , If you agree with my analysis :)

Ethereum has nice support on 78 and 13 USD, Good Luck HoldingPrice points downwards for the ETH/USD pair.
Only a surprise fundamental news, development on the ETH tech v3 might save them and the price of all ICO's coins.
Now all is stuck on ETH v2 and 2 year historical tech
Good Luck Holding

DBL bottom on ETHUSD signals retraceFollowing double bottom pattern formation the price is generally believed to rise at least to its target level, calculated as follows:
T = R + H,
Where:
T = TP (target level);
R – resistance level (recent local high);
H — higher high (fluctuates based on basic indicators)
S – stop-limit (distance between current price and prior resistance levels).
T = $187.70
S = $176.58
R = $184.86
H = Blue horizontal
Disclaimer
NOT financial advise. Just magic from your local sorcery. Trade responsibly!
-@a1mTarabichi

ETH longWhat a nice direction fibonacci based MAVW (navy color) draw =)
Red zone between roughly 189 and 191 is resistance, that has most chances of rejecting ETH price back. And it might do so at the first test. But in case of breakout targets are 195 - 200 - 205

Following up from previous analysis As we can see the $180 mark has held as a stable support level for my trade 2 days ago which I entered at $180 with 25x leverage, only a few dollars have risen so far, however this can rise to $190 or $195 with a small spike in volume. Any increase in BTC price can also reflect well here.

ETH/USD Price Action Analysis | Hopes & DespairsEthereum has got back in the Trading Range after a significant Bear Trap. Most of the bears are already got hunted and if not, will be hunted in the next up move along with the hopes of the bulls. That intersection of both, is where our entry initiates.
Entry: 187.9
SL: 208.1
TP-1: 152.1
TP-2: 132.1
R/R: 2.76
Please let me know if you have any suggestions or any ideas to add. I can also give you more detailed explanation for this specific trade setup.
The ideas published here are not financial advices.

ETH/BTC Ethereum - Still waitingIt'd be nice to buy the bottom, but who knows when this alt szn will end?
I'll be watching how price moves on the way down. If a new range is formed I can use that to re-enter.

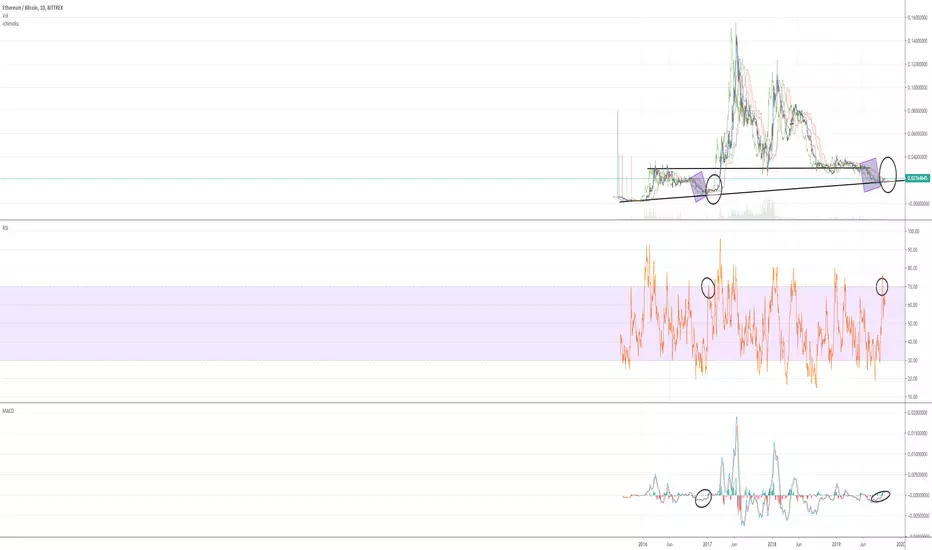
Ichimoku Analysis for EthereumGood day dear readers,
Bitcoin has broken down and is indicating to go even lower. Normally this is bad news for the altcoins but when bitcoin is consolidating, altcoins have an opportunity to move up a little.
With Ethereum leading the way.
Ethereum on the medium timeframe (4H) is looking quite bullish. Since the 6th of October we have ripped from 0.010 up to 0.022, a nice 37% increase.
On the 4 Hour chart, We can see that the Ichimoku cloud is in a nice bullish trend, and if we can break above 0.022 I am expecting to continue the uptrend.
My target for now is the upper edge of the cloud on the daily: 0.025 and I am willing to take a 5% risk for my stop-loss.
Kind regards, R2.

Ethereum/USD (ETHUSD) - Two SceneariosAlts look good, Bitcoin looks bad.
This is how I am playing this pair out:
1) If Bitcoin rallies from here, I will be looking to short both BTCUSD and ETHUSD.
2) if Bitcoin drops from here, I'll be looking to long a wick inside the box.

ETHUSD formed bullish BAT | A buying opportunityPriceline of Ethereum / US Dollar cryptocurrency is forming a bullish BAT pattern and entered in potential reversal zone.
This PRZ area should be used as stop loss point in case of complete candle stick closes below this area.
I have used Fibonacci sequence to set the targets:
Buy between: 172.84 to 166.91
Sell between: 174.42 to 182.35
Regards,
Atif Akbar (moon333)


ETH / USDTETH / USDT - we consider purchases near the Fibonacci level of 0.786 at a price of 140 to 145 $

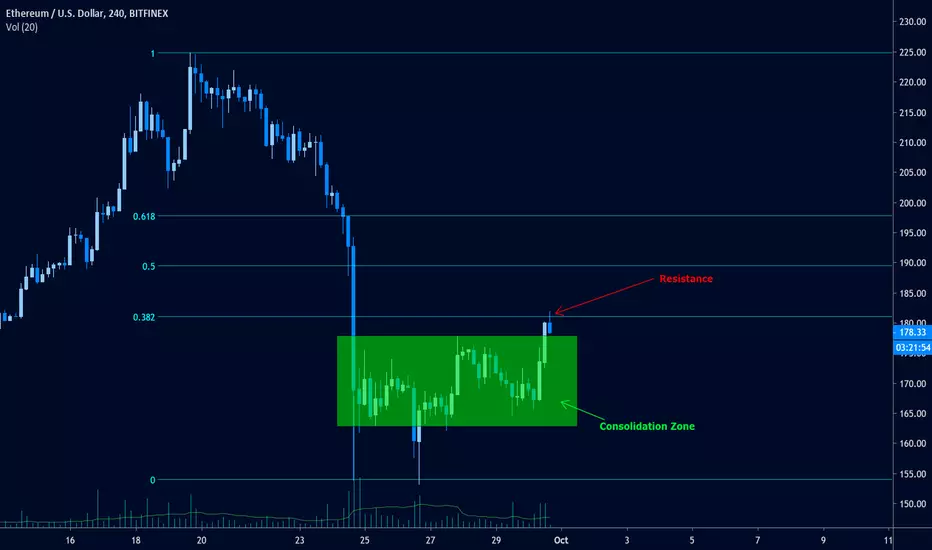
Ethereum Just Broke Out of its Consolidation...or did it?As we suggested earlier today, Ethereum broke out of its consolidation zone to the upside. It managed to close above on the 4-hourly which is significant. However, it was not able to close above the 0.382 retracement level. It did exceed the level briefly before reversing below in the candlestick which is yet to close. If the Fibonacci level is strong enough as resistance, it could be that this was a false breakout of the consolidation zone, and the market may soon return to it.
This isn't a particularly strong bearish sign yet. The market is still above the consolidation zone, and hasn't yet closed below the 0.382 level. It's likely that the 0.382 level will act as short term resistance, causing the market to hover around where it is briefly before continuing into a new bullish trend following the breakout.
For the short term, the most important events to consider are whether the market has fallen back into the consolidation zone, and whether it has broken above the 0.382 retracement level. These events will be the most telling of the market's sentiment.
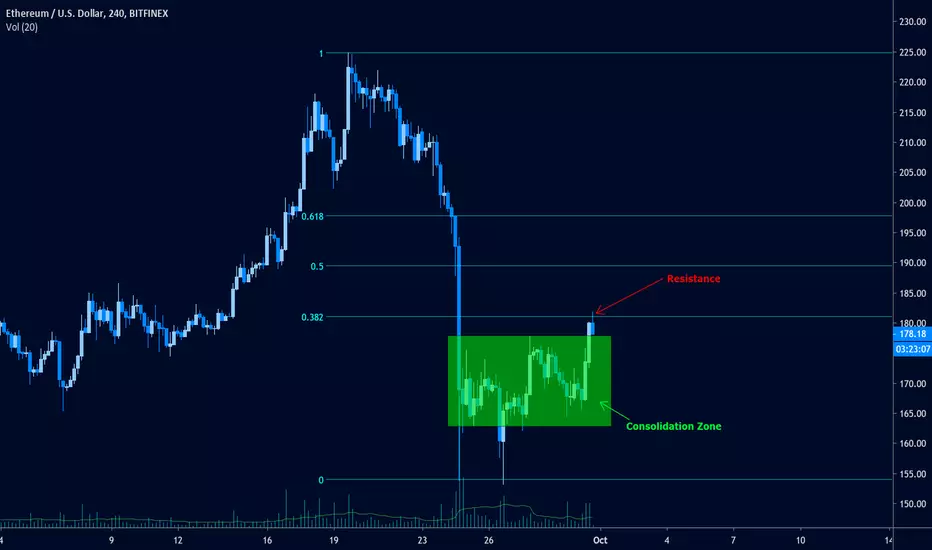
ETH to 130$ ??Bitcoin fall has created a panic in the traders which also let the ETH/USD to fall
If the fall continues a price drop to 130$-132$ is much likely to happen

ETHUSD BULLISH SIGNWe have a strong rejection of the blue zone on the daily chart.
The price will move towards the upper blue zone, which is the first target. From there we will see where ETH will go next.

ETHUSD formed bullish Crab | Upto 15% expectedThe priceline of Ethereum / US Dollar has formed a bullish Crab pattern and entered in potential reversal zone.
This PRZ area should be used as stop loss point in case of complete candle stick closes below this zone.
I have used Fibonacci sequence to set the targets:
Buy between: 196.10 to 188.24
Sell between: 202.20 to 216.97
Regards,
Atif Akbar (moon333)

ETHUSD today analysis, 190923. Rebound after fall to around $190Hello my friends. It's Crypto Ranger K.
First of all, fortunately, for the last few days, I think the price is flowing as I expected.
One thing that bothers me is that today's candle bottom is higher than yesterday's candle bottom.
I think there are three reasons for the weakening of the decline.
First of all, I think it's far from the 5day line due to a sharp drop in prices over the past few days.
The second reason is that the intersection of the 200-day line and the 10-day line acts as a support, and finally, the current position is the place where the trading volume is concentrated.
In fact, when I saw this part yesterday morning, I thought about the possibility that the price would rise from this point.
I still think there is some possibility.

ETH will fall if BTC doesOK, so we have BTC potentially falling, so Ethereum price should do the same. Where we may expect it to bounce? Nearest support zones are at 210-211, then 205, then 195-197. Support zones are targets for shorts and potential long entries.
Nearest resistance is at 216 and 218 - consider it as short entry zone
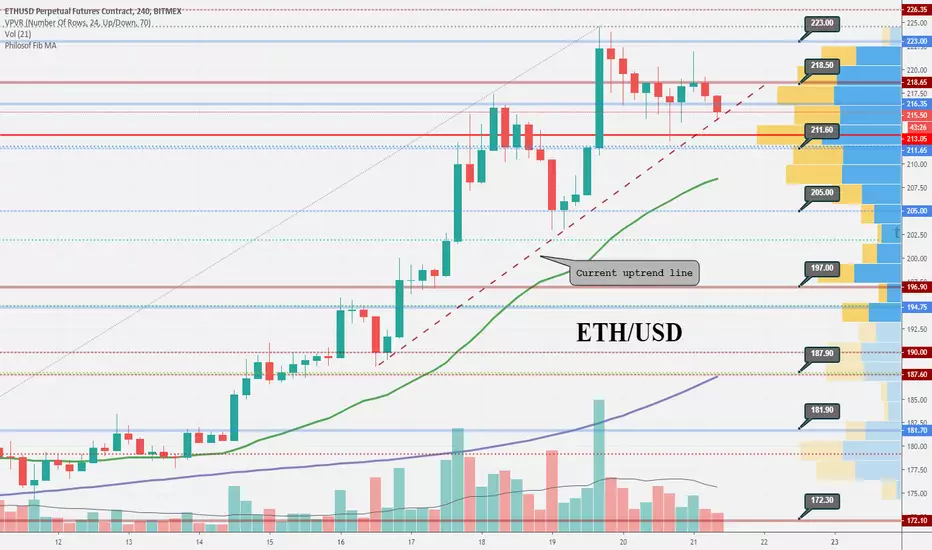
Short the hopium out of Ethereum?
Stop loss: $226
Target: $125
Please refer to my last idea as to how I can possibly be Bearish on Ether right now.
"but but but but bull ru..." "NO!"
