Ethereum Bitmex chartAt USD pair Ethereum doesn't look that good as with BTC, which means its price is decreasing, but with less speed than Bitcoin (at least now). Next long position at 210. Target 223 - 230.
Ethereumusd
Not the end of the ups! #ETHUSD#EthereumThe Ethereum range from 228 support to 288 resistance, because we are very close to support we recommend Buy, according to the Stochastic the Ethereum has reached the bottom and the rallies on the way
Take profit: 288


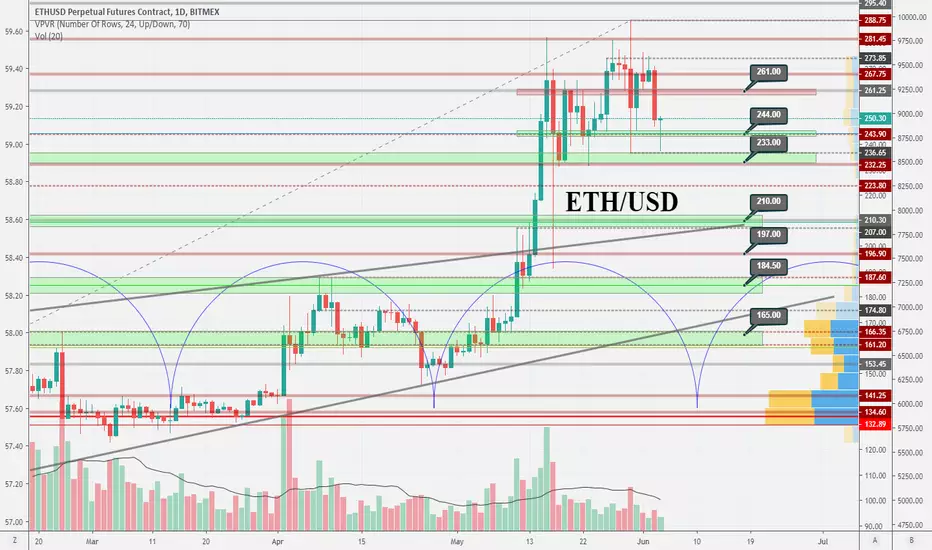
Ethereum Bullish Continuation?Welcome back!
Today we will be taking a look at Eth to decide where we can go from here.
There is a couple options I am watching both bullish and bearish.
Let's jump right into it!
From sub $200 Eth rallied and broke up to $280 before we had our eventual retrace.
Prices now are consolidating in what looks to be a symmetrical triangle.
Symetrical triangles are 50-50 bullish and bearish so this is showing indecision inside the market.
What we need to see is a positive bull break out of this resistance before we can except to see continuation.
Whether we breakout or not is Dependant on BTC.
Based off my analysis it looks like were will get one more drop to our trend line before we see either side impulse the market.
If we break lower, expect a retrace to around $200 or our 200MA.
From an Elliott Wave perspective it appears we are consolidating before our final wave 5x3x3.
Once this impulse is over that will complete wave 3x3 before we start the final 5x3 to complete wave 3 entirely.
Overall this looks more bullish than bearish but it depends on what BTC decides to do.
Overall count has us completed wave 1 with current prices finishing out wave 3x3.

ETH (ETHUSD) Almost Ready To Leave The Station..!!#ETHUSD #ETH (3D TF)
#ETH Is Following #BTC & Making Ascending Channel On 3D TF..
If Brokeout 216$ Area Then It Can Test 245-250$ Zone ..
So Keep our Eyes on It..
I'm Bullish On It #ethereum

[SHORT] ETHCheck on the lower Time Frame, you can see it there clearly.
Short play for me
Personal Interpretation
Trade on Your own Risk


A trading opportunity to buy in ETHUSDMidterm forecast:
While the price is above the support 162.650, beginning of uptrend is expected.
We make sure when the resistance at 264.800 breaks.
If the support at 162.650 is broken, the short-term forecast -beginning of uptrend- will be invalid.
Technical analysis:
While the RSI support #1 at 44 is not broken, the probability of price decrease would be too low.
A trough is formed in daily chart at 148.700 on 04/26/2019, so more gains maximum to Major Resistance (264.800) is expected.
Price is above WEMA21, if price drops more, this line can act as dynamic support against more losses.
Relative strength index (RSI) is 74.
Trading suggestion:
. There is a possibility of temporary retracement to suggested support zone (187.50 to 162.65). if so, traders can set orders based on Price Action and expect to reach short-term targets.
Beginning of entry zone (187.50)
Ending of entry zone (162.65)
Entry signal:
Signal to enter the market occurs when the price comes to "Buy zone" then forms one of the reversal patterns, whether "Bullish Engulfing" , "Hammer" or "Valley" in other words,
NO entry signal when the price comes to the zone BUT after any of the reversal patterns is formed in the zone.
To learn more about "Entry signal" and the special version of our "Price Action" strategy FOLLOW our lessons:
Take Profits:
TP1= @ 264.800
TP2= @ 309.100
TP3= @ 348.800
TP4= @ 393.550
TP5= @ 475.300
TP6= @ 534.700
TP7= @ 630.500
TP8= @ 822.550
TP9= @ 970.450
TP10= @ 1229.700
TP11= @ 1415.950
TP12= Free

get ready for big pop from ethereumthis is excellent, Ethereum is breaking out of its ascending triangle, any day we are going to see a major push towards 300.
the daily and weekly both showing a brake upwards out of this reversal ascending triangle.
buy signal just popped up on the weekly. shits about to get real

Ethereum/Tether (14 May) #ETH $ETH #USDT $USDTWe have succeeded with the last ETH signal. However, the market is becoming more active and making ETH grow beyond my expectation
Currently ETH has broken the Rising Wedge formation but it needs to get over 200$ zone otherwise the Wolfe wave will kill us
If ETH falls to 190$, it will continue to fall back to 170$
If ETH can sustain over 200$, target must be 240$

Ethereum Continues To Follow Amazon!Just a quick update. As I posted before when ETH was still in the $160 area, one should not necessarily expect a retest of lows, or a longer correction until the $400-500 area is reached. This is based on what happened to AMZN stock after it bottomed out in the wake of the dotcom boom. If ETH followed similar price action, this is what we should expect.
Here is the AMZN chart:
Keep in mind, fractals like this do NOT have to play out. This is just a potential scenario, and I'm keeping track of it. So far, so good. Let's see. A deviation from this fractal would have ETH heading back towards the $160 area and below. We have finally breached the psychologically important $200 zone though, so I wouldn't be surprised at more upside from here. However, this is still a resistance zone, so a pullback is possible as well.
Here is my last ETH analysis:
This is not financial advice. I'm not a professional.
-Victor Cobra

ethereum abot to break out of reversal ascending trianglein the past serious gains were made after ascending triangle breakouts, we are about to see another come to fruition
what do you think will happen? I think we are getting stronger with the bulls with rsi crossing 53. The 21 a 38 weekly soon to be crossing. I think it is a high possibility to see major gains with this this ascending triangle breakout
leave a like if you agree or you learned something from this information.
if you think this idea doesn't make any sense, and I'm stupid leave a rude comment and tell me how much I suck haha
thanks

Bearish AVALANCHE is well on the WAY The market retraced back to the tested resistance level - 178.22
Confirming the awaited
Bearish AVALANCHE

ETH Short Opportunity Coming Soon!Hello everyone!
Keeping this Ethereum analysis short and simple.
The price has been grinding higher on decreasing volume, and the daily RSI is showing bearish divergence.
The red line is the 200 EMA which we rejected hard off of twice, and since then have made multiple lower highs. I believe the dotted line in the center must hold for us to continue higher.
Given these conditions, I am currently short ETH with the targets of $147 and $135ish in the near term. I am short from $167.
A break with volume above $174 would make me bullish and I would consider entering a position if we have a bullish retest of the red line for continuation.
Until then, I see ETH (and BTC) retracing a decent amount. Overall, this is healthy price action and there is no need for alarm.
What are your thoughts and ideas?
Share them with me below!

ETH - OUTLOOK TOWARDS OUR UPCOMING TARGETS ETH is looking good to touch our first target of $164 followed by $171 and $185

Daily Bullish Signal $ETH #ETH #ETHUSDT #USDT $USDT (30 April)RED ARROW indicates the EXPECTED Time and Targets
Level Stoploss point up to maximize profit and reduce risk
I'm working all the time, even in Bearish Market
======================
My path doesn't seem like anyone. I'm like a MONK, always studying to find the direction that prices will follow. I will feel very comfortable if the price goes exactly in the direction I drew. I will always try and practice until PERFECTION is MY OWN
