Ethereum ETH and the US Debt CeilingNegotiators from Democratic and Republican parties finalized an agreement on Sunday night.
Instead of raising the limit to a specific level, they have opted to suspend it entirely until 2025. This strategic move ensures that their bills can be paid until that date, while also guaranteeing that the next battle to raise the ceiling will not coincide with the upcoming presidential election.
The resolution of the debt ceiling issue brings optimism and stability to the financial landscape, which has a positive ripple effect on the cryptocurrency market.
Bitcoin and the broader crypto market stand to benefit from increased investor confidence, reinforced safe-haven status, enhanced institutional adoption, regulatory clarity, and the overall positive impact on global markets.
ETH/USDT
Entry Range: $1800 - 1900
Take Profit 1: $1950
Take Profit 2: $2010
Take Profit 3: $2100
Stop Loss: $1730
Ethereumusd

ETHUSD - Gaussian Channel Favouring BullsThe Gaussian channel is turning green!
Price is moving up slowly but for now it has perched itself above the middle line which is a really good support.
ETH may continue to move up as the channel continues to turn.

ETHUSD - Precarious Monthly Gaussian ChannelETHUSD on this Monthly timeframe shows higher lows sitting just above the top of the channel.
If we are able to recover and hodl this Monthly upper line the bulls are still on for the long term.
Higher lows present.

Ethereum to extend it's loses?Ethereum - 24h expiry - We look to Sell a break of 1783 (stop at 1833)
Short term bias has turned negative.
Posted a Double Bottom formation.
A break of yesterdays low would confirm bearish momentum.
Short term momentum is bearish.
Short term RSI is moving lower.
Our profit targets will be 1663 and 1643
Resistance: 1840 / 1860 / 1880
Support: 1815 / 1785 / 1750
Please be advised that the information presented on TradingView is provided to Vantage (‘Vantage Global Limited’, ‘we’) by a third-party provider (‘Signal Centre’). Please be reminded that you are solely responsible for the trading decisions on your account. There is a very high degree of risk involved in trading. Any information and/or content is intended entirely for research, educational and informational purposes only and does not constitute investment or consultation advice or investment strategy. The information is not tailored to the investment needs of any specific person and therefore does not involve a consideration of any of the investment objectives, financial situation or needs of any viewer that may receive it. Kindly also note that past performance is not a reliable indicator of future results. Actual results may differ materially from those anticipated in forward-looking or past performance statements. We assume no liability as to the accuracy or completeness of any of the information and/or content provided herein and the Company cannot be held responsible for any omission, mistake nor for any loss or damage including without limitation to any loss of profit which may arise from reliance on any information supplied by Signal Centre.

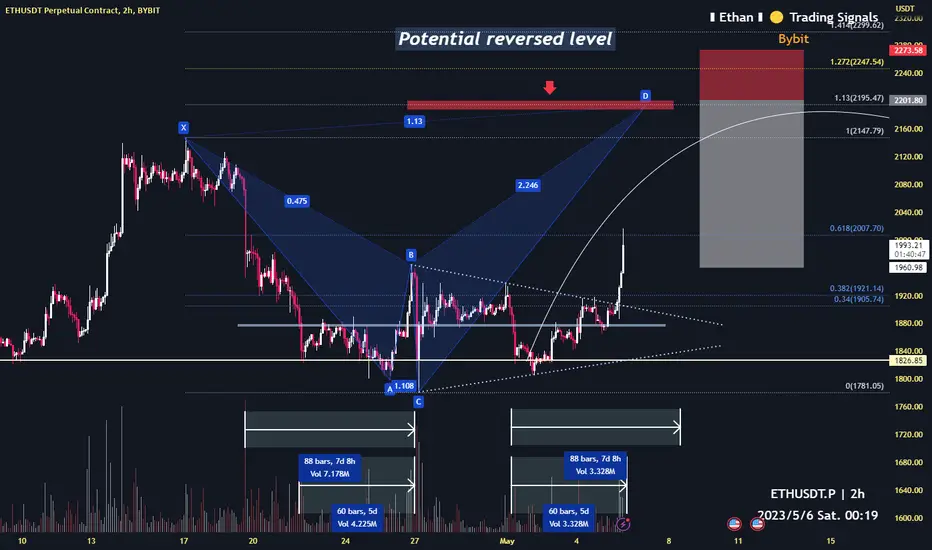
Ethereum as we predicted (pump this week)Potential reversed level as analysis on chart
Stay prepared
Ethereum -> Just A Classic ShakeoutHello Traders,
welcome to this free and educational multi-timeframe technical analysis .
On the weekly timeframe you can see that Ethereum already broke above a major previous weekly support/resistance area at the HKEX:1900 level.
You can also see that as we are speaking, Ethereum is retesting this previous resistance which is now turned support, market structure is still bullish and we already created the bottom of the bear market in my opinion, so I simply do expect more continuation towards the upside from the current levels.
On the daily timeframe you can see that Ethereum is also retesting previous daily support/resistance which could act as support so I am just waiting for some more bullish rejection inside of this area and then I do expect a next rally towards the upside.
Thank you for watching and I will see you tomorrow!
You can also check out my previous analysis of this asset:

ETHUSD - Inverted H&S An inverted H&S structure with the suggestion that the right shoulder is yet to form
I would expect a recovery for the shoulder somewhere in the lower half of this channel
(1) is the shoulders
(3) is the head
(2) are also a key part of the pattern, id call them the arms

Ethereum Long Term AnalysisSince we are coming to the end of February in 4 days, I felt the need to do this analysis. I think the critical level for Ethereum in the monthly timeframe is $1828. This is because the moving average is at that level. I think that Ethereum, which has always followed this moving average in history, will follow this moving average again this time. The monthly close of Ethereum above this level may also mean the beginning of the bull market. For this reason, it seems that for those who have not bought Ethereum yet or for investors who want to lower their risks as much as they can, following this level and buying when a monthly closing is made will minimize the risks.
A second scenario will occur if Ethereum is rejected at this level. If Ethereum is rejected from this level, the support levels of the Fibonacci retracement will be seen. The target for the bear scenario will be $771 if there is no return from $1177 first and then $771.
I don't think there will be more of a bear scenario for cryptos in this situation. I would also like to say that when the moving average is broken, I will personally add to the Ethereums in my pocket.

Ethereum 🔼$ETH has unlocked new highs not seen since Aug 2022, with recent 17 days range breakout and retest looks a good long to target $2000.
And this is ETHBTC, such move has the higher probability:
I will keep updating this in here, so make sure you follow me.

Ethereum -> This Is ItHello Traders,
welcome to this free and educational multi-timeframe technical analysis .
On the weekly timeframe you can see that Ethereum is actually breaking above a major previous weekly structure area exactly at the psychological HKEX:2000 area.
You can also see that weekly market structure is massively bullish, in my opinion the bottom of the bear market was already created so I am now just waiting for a retest of the previous HKEX:2000 resistance and then I simply do expect more continuation towards the upside.
On the daily timeframe you can see that Ethereum is up about 10% just the past two days, so I am also on the daily now just waiting for a retest of the previous HKEX:2000 resistance which is then turned support and then I also do expect more continuation towards the upside from a daily perspective.
Thank you for watching and I will see you tomorrow!
You can also check out my previous analysis of this asset:

Ethereum - Buy The Rumor, Sell The News? 😳What’s up traders. In today’s trading idea, we discuss our thoughts on Ethereum.
Taking a look at the Daily chart, we’ve mapped out a few key levels & zones.
The story for Ethereum will be similar to our previous post on Bitcoin, in terms of where we think the 2nd largest crypto is headed.
If you haven’t heard, the Ethereum network is about to undergo the highly anticipated Shanghai upgrade on April 12th.
Simply put, this upgrade will allow investors (validators of the network) to withdraw their ETH that has been staked since December of 2020 (massive unrealized gains sheesh).
Right now, staked ETH accounts for 1/7th of the entire supply, 16 million tokens valued at over HKEX:26 billion.
Will a massive price dump follow?
Without diving too deep into the technicalities of the Shanghai fork, a subsequent dump could likely be in the cards.
Scenario 1: Bull Case
We see a continued push from Bitcoin, driving Ethereum up. We’re currently in an ascending triangle / bull flag, so a breakout to previous highs wouldn’t be surprising. HKEX:2 ,000 ETH definitely in the cards (Round number pseudoscience).
If we can surpass the 2K barrier, consolidate above combined with a bullish Bitcoin. Taking longs right now don’t sound too shabby.
Scenario 2: Bear Case
The bearish scenario would entail a “Buy The Rumor, Sell The News” situation. Where this push we’ve witnessed in recent days/weeks is due to the hype surrounding the Shanghai Upgrade.
A dip back down the 1400-1500 levels might be a solid spot if you want to look at getting long. If we see a severe dip from Bitcoin, and end up retouching the 1000-1200 levels. We’d be looking to buy & hold as those prices would be quite appetizing.
As always, NONE of this is financial advice. Trade, and invest at your own risk. This is for educational and entertainment purposes only, and we are in no way shape or form financial advisors.
Eyes peeled out there team. See ya in the next one.

Painting Ethereum- Sometimes the lines we see are unclear and difficult to understand.
- Trading is some kind of art where u are trying to paint the future.
- No one is born a great trader, one learns by trading.
Happy Tr4Ding !

ETH / USD - KEEP SHORTING - CryptoManiac101ETH / USD TA
Here we are looking at a quick TA for Ethereum. We are currently following the widening wedge pattern which is highly bullish at these levels. Stay tuned!

Ethereum: Reaching Out… 🙌Ethereum is reaching out to complete wave 1 in green and still has got some room to rise. As soon as the respective high is established, though, the cryptocurrency should turn downwards and head for the green zone between $1607 and $1424, where wave 2 in green should end. With this low secured, Ethereum should then resume the ascent by developing wave 3 in green. However, a 30% chance remains for Ethereum to scoot below the support at $1370, which marks the last significant low of wave ii in orange. In that case, we would reckon with a new low in the form of wave alt.ii in orange in the orange zone between $1330 and $1150 before ETH can continue the upwards movement.

Ethereum -> The Pump Is Not Over YetHello Traders,
welcome to this free and educational multi-timeframe technical analysis .
On the weekly timeframe you can see that Ethereum is currently retesting a quite obvious previous weekly resistance area which is now turned support so I do expect at least some continuation towards the upside.
You can also see that we do have a next strong psychological structure area exactly at $2000, which I do expect Ethereum to retest before we then have the potential to create a minor rejection away from the $2000 resistance area.
On the daily timeframe you can see that we have been moving sideways for the past couple of days, following my weekly bullish outlook I am now just waiting for a break above the previous daily resistance and a retest to the capitalize on the continuation towards the upside.
Thank you for watching and I will see you tomorrow!
You can also check out my previous analysis of this asset:

Ethereum to break higher?Ethereum - 16h expiry - We look to Buy a break of 1857 (stop at 1807)
Our short term bias remains positive.
1843 has been pivotal.
A break of the recent high at 1843 should result in a further move higher.
Our outlook is bullish.
There is no clear indication that the upward move is coming to an end.
Our profit targets will be 1977 and 1997
Resistance: 1761 / 1800 / 1843
Support: 1733 / 1712 / 1700
Please be advised that the information presented on TradingView is provided to Vantage (‘Vantage Global Limited’, ‘we’) by a third-party provider (‘Signal Centre’). Please be reminded that you are solely responsible for the trading decisions on your account. There is a very high degree of risk involved in trading. Any information and/or content is intended entirely for research, educational and informational purposes only and does not constitute investment or consultation advice or investment strategy. The information is not tailored to the investment needs of any specific person and therefore does not involve a consideration of any of the investment objectives, financial situation or needs of any viewer that may receive it. Kindly also note that past performance is not a reliable indicator of future results. Actual results may differ materially from those anticipated in forward-looking or past performance statements. We assume no liability as to the accuracy or completeness of any of the information and/or content provided herein and the Company cannot be held responsible for any omission, mistake nor for any loss or damage including without limitation to any loss of profit which may arise from reliance on any information supplied by Signal Centre.

Ethereum -> Wait For The CloseHello Traders,
welcome to this free and educational multi-timeframe technical analysis .
On the weekly timeframe Ethereum just recently perfectly retested and also rejected a quite obvious previous weekly resistance area which was turned resistance once again.
You can also see that we are currently retesting weekly support and it seems like the market will close this week's candle with a quite bullish rejection wick, so from a weekly perspective we can still see more continuation towards the upside.
On the daily timeframe however you can see that market structure is bearish, so I am now just waiting for a break above the $1500 resistance area and if we then get a retest and bullish confirmation, the daily timeframe also looks quite promising for a next impulse towards the upside.
Thank you for watching and I will see you tomorrow!
You can also check out my previous analysis of this asset:

Ethereum ETH Price Targets after the FSB meetingThe Finance Stability Board said today that many stablecoins won`t meet the requirements stipulated in its recommendations for cryptocurrency asset regulation.
This could have have ripple effects in the entire crypto industry!
My price targets for Ethereum ETH are:
ETH/USDT short
Entry Range: $1650 - 1750
Take Profit 1: $1550
Take Profit 2: $1490
Take Profit 3: $1350
Stop Loss: $1890

Ethereum -> The Support Will HoldHello Traders,
welcome to this free and educational multi-timeframe technical analysis .
On the weekly timeframe Ethereum retested once again a very strong previous weekly resistance area and is currently again rejecting this zone towards the downside.
However also just recently we had a bullish ema crossover and are now starting to create weekly bullish market structure, so I am now just waiting for a retest of the previous weekly support zone and then the next impulse towards the upside.
On the daily timeframe market structure is currently bearish, so everything is pointing towards another retest of the $1500 area from which I then also do expect the next daily rally towards the upside.
Thank you for watching and I will see you tomorrow!
You can also check out my previous analysis of this asset:

#ETHUSD - Swing Down to Recent Lows Before Moving Up Again?Looks like #ETHEREUM is about to to clear some smiles from the bulls as it descends around 30% to meet recent support levels.
There'll be a few swings in this descent where shorter term traders could bag multiple profits up and down, but our forecast for the next month or two most definitely red!
_________
What Do You Think?
If you enjoyed or agree with this idea - drop us a comment, like & follow! 😀
Ideas by theCrypster meet the guidance notes and disclaimer as mentioned below and within our website. See Signature for more info! ✌️
🔥🔥🔥
Crypto Tipster v2
theCrypster
🔥🔥🔥

Ethereum -> Don't Trust The BearsHello Traders,
welcome to this free and educational multi-timeframe technical analysis .
On the weekly timeframe Ethereum just retested and rejected a quite obvious previous weekly resistance area and is now approaching a previous weekly support zone.
However we are also having a bullish weekly ema crossover and just recently created another higher high, so I am now just waiting for the market to retest the next support zone before then starting the next push towards the upside.
On the daily timeframe you can also see that we are about to retest a previous daily support area, so I am now just waiting for the retest and some bullish confirmation before I then do expect the next push towards the upside.
Thank you for watching and I will see you tomorrow!
You can also check out my previous analysis of this asset:

Ethereum -> More Upside PotentialHello Traders,
welcome to this free and educational multi-timeframe technical analysis .
On the weekly timeframe Ethereum just recently broke out of a very clear triangle formation and since then already had a pump of about 30% towards the upside.
We have the next clear resistance area coming in at $2000 so I do expect the market to have a bullish move into the zone before finding short term resistance there.
On the daily timeframe I am just waiting for the market to break above the previous resistance zone which we are currently testing once again, and after the break I definitely think the market will finally retest the $2000 area.
Thank you for watching and I will see you tomorrow!
You can also check out my previous analysis of this asset:

Ethereum Fib LVLS BINANCE:ETHUSDTPERP
Could this be the Local top ? could we see ETHEREUM head a bit back down to test some lower LVLS ? Or will ETH keep pushing on to the upside!?
Lets get this crypto!
BINANCE:ETHUSDTPERP
