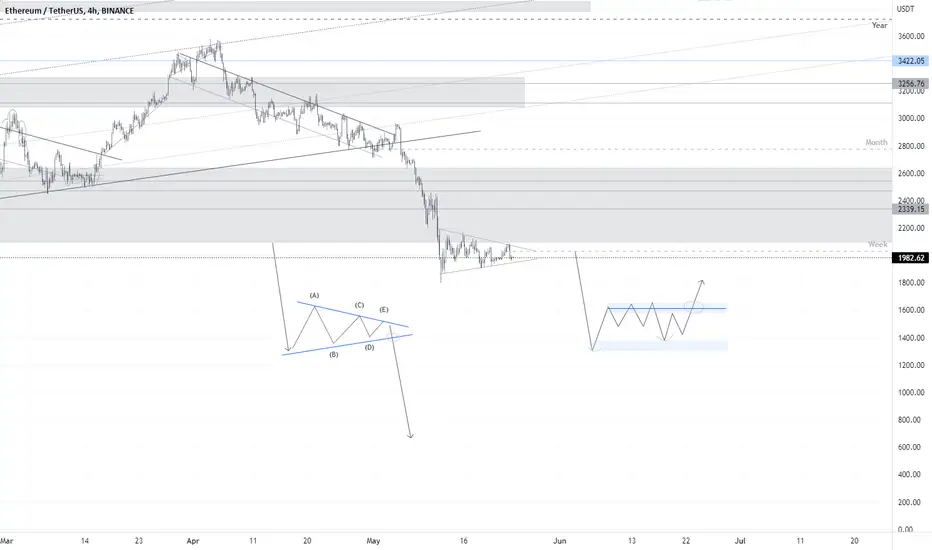
ETHUSD - Bull Faith UpdateEthereum has undergone some extreme downsides in the past weeks
I'm comparing in this analysis these downsides to a previous price structure on ETH, they are similar just on a little bit different scale
Both are broadening wedges, and have shown to form as the 200MA is curling down
Will we see another up wave like was seen in 2017? Will it be comparable in future?
Ethereumusd

Ethereum ETH short Entry Range, Take Profits and Stop Losspreviews targets reached
ETH/USDT short
Entry Range: $1200 - 1310
Take Profit 1: $1150
Take Profit 2: $974
Take Profit 3: $802
Stop Loss: $1450

Ethereum next dip ~$1600Hello Traders,
Ethereum is in a downtrend like Bitcoin, and it will touch the lower trendline of the channel (~$1600) until June 13.
Please note the estimated date is based on previous data on the chart.
Please hit the like button if you agree and share the chart.
Thanks.

Ethereum ForecastAfter we had this support and resistance play:
and
Due to the markets condition i expect ETH Ethereum to touch the $1275 support.
Looking forward to read your opinion about it.

ETHUSD Long Term Bull Pivot PointThe horizontal trend line shows clear points of support
Currently price is forming a support again around this area
The bull run will continue if this support is held

ETHUSD Middle Band TestPlotting an up channel using the middle trend as a top point for similar areas on ETHUSD chart
Similar points are in white rectangles
We are still going to the moon

ETH Sell a break of $1900.Ethereum - Intraday - We look to Sell a break of 1898 (stop at 1944)
1901 has been pivotal.
Bespoke support is located at 1900.
A break of bespoke support at 1900, and the move lower is already underway.
Daily signals are bearish.
Our profit targets will be 1782 and 1752
Resistance: 2000 / 2060 / 2100
Support: 1950 / 1900 / 1800

ETHUSD - Remarkable Similarities Two tops in red followed by a sloped top in yellow, leading to a small downward move
MOONSHOT (just under the 50MA)
This pattern seems to be repeating just with the 100MA

ETH Ultimate Update on S/R zonesHi guys,
Any price below 2000 is a buying opportunity, but, make sure you don't run out of cash to the bottom of these support areas.
attention:
Dark red: heavy resistance
light red: weak resistance
orange: possible temporary reversal
to see how you can use the analysis, check out the previous TA on ETH.
Comment your opinion about these ideas.

ETHUSDT (24/05/2022)Posible movements for ETH???
In a few months we are going to resume the technical analysis of ethereum as well as include a lot of new analysis of structures or classic graphic models and studied by different theories.
In the coming months and for the following year we will include the most outstanding and interesting altcoins in our studies page, as well as broaden the geopolitical and energy vision and consequence with raw materials, banks and large capitalization companies.
ETHUSD Daily Updated Thoughts 5/23/22Price has almost reached the 2.618 level of a major Fibonacci circle area
As price reaches this level within the apparent downtrend, a breakdown may ensue vertically along the blue circle
After this event a prompt recover will follow, and this is when I believe the bulls will return in force.
Trend line drawn horizontally against 2.618 shows a double bottom formation which further emphasizes a bull rejection
Other patterns on the chart include a Rising Wedge which shows a clear top point
Price (bars pattern) placed around the 2.618 area are just estimations, the main takeaway is a recovery at 2.618.
Daily chart
I am long Ethereum

Bloody summer for Alts Hello cryptofolks
What I expect for Ethereum and whole Alts market is a bloody summer (-50%) correction and accumulation phases
I marked some levels for DCA accumulation
September/December can have a rebounce and a mini rally (hope)
-Goodluck

ETH Buy at $2000.Ethereum - Intraday - We look to Buy at 1992 (stop at 1934)
Trading close to the psychological 2000 level.
We look to buy dips.
1977 has been pivotal.
Our profit targets will be 2138 and 2188
Resistance: 2100 / 2150 / 2200
Support: 2000 / 1950 / 1850

Ethereum Sell a Break Setup.Ethereum - Intraday - We look to Sell a break of 1974 (stop at 2023)
Daily signals are bearish.
There is no clear indication that the downward move is coming to an end.
Broken out of the channel formation to the downside.
1976 has been pivotal.
Our profit targets will be 1851 and 1801
Resistance: 2050 / 2100 / 2150
Support: 1980 / 1950 / 1850

Jamie Gun2Head Trade: Selling Ethereum Trade Idea: Selling Ethereum on a bearish flag pattern
Reasoning: bulls struggling to regain control, a break coming?
Entry Level: 2026
Take Profit Level: 1783
Stop Loss: 2166
Risk/Reward: 2.7R
Disclaimer – Signal Centre. Please be reminded – you alone are responsible for your trading – both gains and losses. There is a very high degree of risk involved in trading. The technical analysis , like all indicators, strategies, columns, articles and other features accessible on/though this site is for informational purposes only and should not be construed as investment advice by you. Your use of the technical analysis , as would also your use of all mentioned indicators, strategies, columns, articles and all other features, is entirely at your own risk and it is your sole responsibility to evaluate the accuracy, completeness and usefulness (including suitability) of the information. You should assess the risk of any trade with your financial adviser and make your own independent decision(s) regarding any tradable products which may be the subject matter of the technical analysis or any of the said indicators, strategies, columns, articles and all other features.

Ethereum buy the trendline support.Ethereum - Intraday - We look to Buy at 2031 (stop at 1966)
Short term bias is mildly bullish.
Trend line support is located at 2030.
We look to buy dips.
Our profit targets will be 2196 and 2236
Resistance: 2150 / 2200 / 2300
Support: 2050 / 2000 / 1950

ETH Cell Opportunity - Ethereum Short Call Hello everyone, if you like my idea about Ethereum, do not forget to support with a like and follow. Here is the analysis for ETH, feel free to request any pair/instrument or ask any questions in the comment section below.
Best of luck!

Ethereum: Can we start going higher?!!Ethereum
Intraday - We look to Buy at 1933 (stop at 1717)
The downtrend seems to be slowing down. Preferred trade is to buy on dips. With signals for sentiment at oversold extremes, the dip could not be extended.
Our profit targets will be 2449 and 2600
Resistance: 2200 / 2400 / 2600
Support: 1900/ 1700 / 1500
Please be advised that the information presented on TradingView is provided to Vantage (‘Vantage Global Limited’, ‘we’) by a third-party provider (‘Signal Centre’) . Please be reminded that you are solely responsible for the trading decisions on your account. There is a very high degree of risk involved in trading. Any information and/or content is intended entirely for research, educational and informational purposes only and does not constitute investment or consultation advice or investment strategy. The information is not tailored to the investment needs of any specific person and therefore does not involve a consideration of any of the investment objectives, financial situation or needs of any viewer that may receive it. Kindly also note that past performance is not a reliable indicator of future results. Actual results may differ materially from those anticipated in forward-looking or past performance statements. We assume no liability as to the accuracy or completeness of any of the information and/or content provided herein and the Company cannot be held responsible for any omission, mistake nor for any loss or damage including without limitation to any loss of profit which may arise from reliance on any information supplied by Signal Centre.

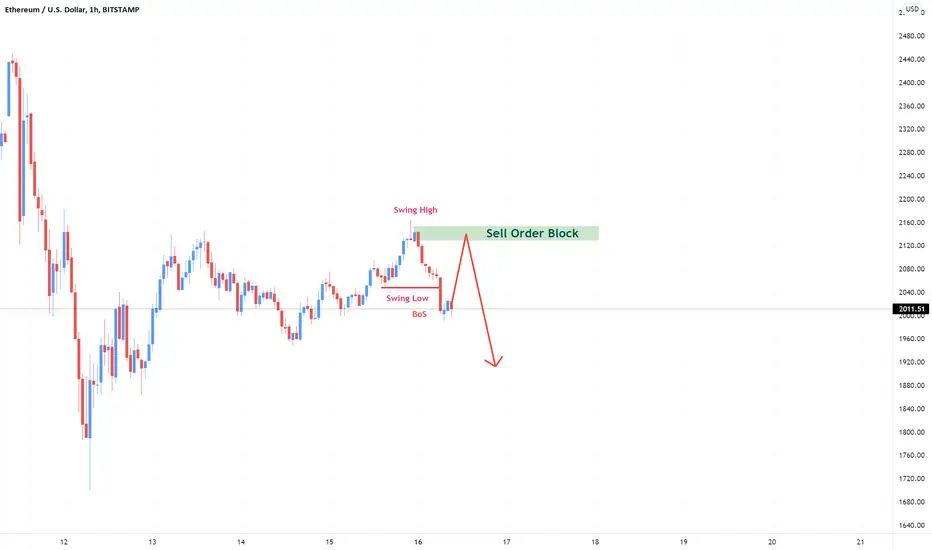
Ethereum Prediction H1Here is my view for ETHUSD on H1. The price could go down, you can put a pending order on the Order block or find an entry on LTF within OB Zone. Trade Safe!
ETH - will go below $1,000This weekly chart shows that the Weekly 20 EMA is about to cross below the 50 EMA, probably in the next few days this week.
So far we've hit all the targets on the weekly chart for ETH.
One more target left which takes us below $1,000 and I am expecting this to hit in the coming weeks.
At the time of writing this ETH is currently being rejected by the 1 Hour 20 EMA as well as being rejected by the 4 Hour 20 EMA.
The 1 Hour RSI is showing over bought and MACD is running out of gas and I am expecting ETH to continue the decline.

ETH Buy a break setup.Ethereum - Intraday - We look to Buy a break of 2141 (stop at 2059)
We are trading at oversold extremes.
Short term momentum is bullish.
A break of the recent high at 2140 should result in a further move higher.
20 4hour EMA is at 2141.
Our profit targets will be 2347 and 2397
Resistance: 2140 / 2250 / 2400
Support: 2050 / 1950 / 1900

ETHUSD - Testing New Indicators This indicator shows Fibonacci levels
Right now on ETHUSD we are bottomed at the same levels as late 2018 and 2020 COVID
See how it plays out

ETHUSD - Head and Shoulder Formations An idea exploring a repeating or comparable Head and Shoulders formation
The white rectangle is the comparable place in price
I don't think a moon shot as big as the 2016 will follow, simply because of the age of ETH compared to 2016
Growth will resume although.
