ETH.X in downward trendETH.X in downward trend: 10-day moving average broke below 50-day moving average on January 28, 2024
The 10-day moving average for ETH.X crossed bearishly below the 50-day moving average on January 28, 2024. This indicates that the trend has shifted lower and could be considered a sell signal. In 11 of 22 past instances when the 10-day crossed below the 50-day, the stock continued to move higher over the following month. The odds of a continued downward trend are 50%.
Technical Analysis (Indicators)
Bearish Trend Analysis
The 10-day RSI Indicator for ETH.X moved out of overbought territory on January 12, 2024. This could be a bearish sign for the stock. Traders may want to consider selling the stock or buying put options. Tickeron's A.I.dvisor looked at 66 similar instances where the indicator moved out of overbought territory. In 32 of the 66 cases, the stock moved lower in the following days. This puts the odds of a move lower at 48%.
The Moving Average Convergence Divergence Histogram (MACD) for ETH.X turned negative on January 20, 2024. This could be a sign that the stock is set to turn lower in the coming weeks. Traders may want to sell the stock or buy put options. Tickeron's A.I.dvisor looked at 64 similar instances when the indicator turned negative. In 26 of the 64 cases the stock turned lower in the days that followed. This puts the odds of success at 41%.
ETH.X moved below its 50-day moving average on January 31, 2024 date and that indicates a change from an upward trend to a downward trend.
Following a 3-day decline, the stock is projected to fall further. Considering past instances where ETH.X declined for three days, the price rose further in 50 of 62 cases within the following month. The odds of a continued downward trend are 39%.
BINANCE:ETHUSD
New Robot factory from Tickeron Trading Results for last 12 months
ETH.X
AI Robots (Signals Only)
AI Robot's Name P/L
Day Trader: Crypto Pattern Trading in High-Volatility Markets (TA) 8.81%
Day Trader with Trailing Stops, Cryptos 7 (TA) 6.37%
Swing Trader: Crypto Pattern Trading in High-Volatility Markets (TA) 5.31%
Market Cap
The average market capitalization across the group is 275.16B. The market cap for tickers in the group ranges from 275.16B to 275.16B. ETH.X holds the highest valuation in this group at 275.16B. The lowest valued company is ETH.X at 275.16B.
High and low price notable news
The average weekly price growth across all stocks in the group was 1%. For the same group, the average monthly price growth was 1%, and the average quarterly price growth was 23%. ETH.X experienced the highest price growth at 1%, while ETH.X experienced the biggest fall at 1%.
Volume
The average weekly volume growth across all stocks in the group was -25%. For the same stocks of the group, the average monthly volume growth was -50% and the average quarterly volume growth was -6%
Etherium

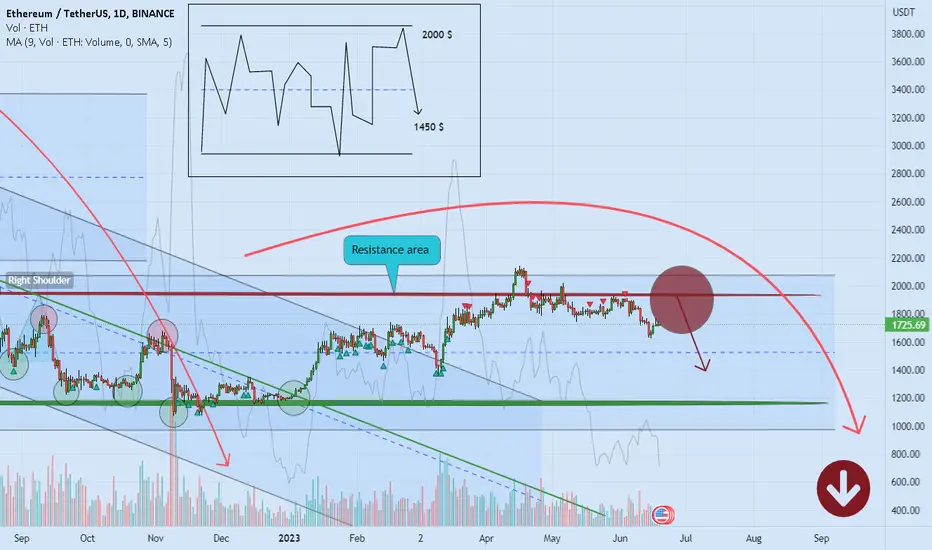
ETHUSD_1DEthereum analysis
According to the breaking of the upward trend line, the market can be a sign of the end of the upward trend, and currently the market is in the range of suffering to decide whether to withdraw the trend line or enter a strong fall.
The main resistance number is 2300
Target and support 2000

ethIt has an important support in this area, which I hope will not be broken and will start an upward movement

ETC BULL MARKET GETTING STARTEDETC is breaking the previous downtrend line and it has reversed from the golden pocket of previous bull market.

ETH will correct to 2000?Absolutely cryptocurrencies market sentiment is positive, But no momentum in this time to goes higher. So, I think crypto market needs correction move to get momentum to fly again.
Trade safe.
Good luck.

BTC 2024 RoadmapTop is in at 44-46k
Take profits and sit on the sidelines for the next few months
Diverge into ETH and Large Caps for the next rally
See you at 24K

Etherium is targeting 2750 in few weeksDaily chart, Etherium/USD should form several chart patterns, supporting each other.
After crossing 2038, the target will be 2750
Stop loss 2020 - to be considered
Longer term, (on the weekly chart) there are higher targets to 3220 after crossing 2141

ETHEREUM Pair : ETHUSD ( Ethereum / U.S Dollar )
Description :
Completed Impulsive Waves " 123 " at the Daily Resistance Level creating Corrective Pattern " Triple Top " in Short Time Frame. We have Rising Wedge as an Corrective Pattern in Short Time Frame with " ABCD " Corrective Waves
Entry Precautions :
Wait until it Rejects / Breaks from Resistance Level

ETH Etherium Path to 14000etherium is repeating bitcoin's performance during rally of 2015-2017 with same target, its a chance to hit 19000.

#ETHERIUM Trading Strategy!🚀 #ETHEREUM : A Closer Look 📊
Examining two exciting scenarios:
1️⃣ A retest of the Blue MA, potentially shaking out weak hands and paving the way for a push to $2000-$2130.
2️⃣ A successful breakout and retest of the Blue Flag.
In both cases, bullish sentiment prevails. The Blue MA has a strong track record in previous rallies.
Trading Actions:
For spot holders, HODL strong.
Futures traders, consider entering at $1710 for a long position with a target of $2000+ and a stop-loss below $1635.
#Altcoins may offer better risk-reward ratios thanks to ETH.
Remember to DYOR. This isn't financial advice.
Share your thoughts on ETH! 💬
#Crypto

ETH - ETHERIUM confirmed 👌 it's dump The analysis ⏰ made based supply and demand zone 📌 #DYOR
Based on 1W time frame chart 📉📈 lower position price shift to high 📌 good 👍
/ but /
It's confirmed 👍 the pattern was HH >> LH ( shifted 🙄 )
But recent times slowly movement got shifted 🙄 BINANCE:ETHUSDT
Lower low to lower high 📌 this turned/shift movement to bearish 📍 ( last price action recent)
Is any chance to get price move postive upside 🚀
2 possible ways ::
1->
lower low to lower High should complete in between previous High and high to high lower
This helps to price push 🙂 upside 🚀
2->
We need to have oder block strong upside 🚀 should break high and high of previous
This helps to price push even harder 🙂 upside 🚀
If these things are happened 😂 my analysis is completely ⚡ invalid 📌
Expecting small rise towards >> $1720 - $1820
Then return dump 📍 lower low's >> $1130 - $1295
The strong correction area around 30-40% drop 🩸
I explained clear drop analysis with Invalid point ☝️ chart is clear 📍 i am here
Drop ur question ⁉️ in comments box ☑️
Check profile and follow article if u are interested to get updates 😉
Give boosting 🚀 to article and share to ur frnds
Have a nice day 🙂

Looks like ETH would get some bounceEth recently dropped below its trend line and support too, is now trading at a lower support which is also a good demand zone in my vision i expect some upward movement in this zone as per my analysis , any way DO YOUR OWN RESEARCH

#ETH - thoughts out loud#8Good evening from Ukraine!
Dear colleagues, I am glad to welcome you!
Work plan.
Thank you all for your attention, I wish you success.
Sometimes you win/sometimes you learn.
- thoughts out loud
- thoughts out loud
- thoughts out loud
P.S.
...Think positive)

ETH looks like little more DUMP...?Wait for the retest i think i would go upto yesterdays/todays ALH - All time low, DO YOUR OWN RESEARCH

Battle-tested through the ups and downs of Etherium historyA trading strategy that's been battle-tested through the ups and downs of Eth's history. This strategy doesn't blink in the face of market chaos or get swayed by emotions. It's a calculated game plan that knows when to step in and when to step back.
Compare that to emotional investing, where fear and greed call the shots. Imagine making decisions when you're on an emotional rollercoaster—buying high in excitement and selling low in panic. That's a recipe for disaster.
A backtested risk-managed strategy, though, is like a cool-headed coach that sticks to the game plan no matter what. It's about discipline, rules, and consistency. So, do you want to ride the emotional wave or play the long game with a strategy that has been consistently profitable year on year since 2016 (start of Eth - substantiated by backtest data).
Average annual net profit (substantiated by the backtest)
196% (No Leverage) & 661% (3x leverage)
This year (Jan 2023 to Sep/15th/2023) has already generated
45.21% (no leverage) 144.93% (3x leverage) in net profit.
This strategy does Not re-paint, No-look ahead bias. and 100% forward tested. Tradingview has a default caution for strategies that use the multitimeframes data. This does not apply to this strategy as all calculations are based on closed bars.
So how does it work?
Postions are entered based on RSI Divergence on Higher Timeframes and confirmed by the ATR.
Stop Loss and Trailing ATR-based Take Profit:The strategy incorporates a risk management mechanism with a built-in stop loss set at 8%. Additionally, it employs a trailing take profit mechanism based on ATR. This means that as the trade moves in the desired direction, the take profit level adjusts itself based on the current volatility, allowing for gains to be secured as the trend progresses.
SMI-based Re-entry after Stop-out:
Stochastic Momentum Index (SMI) is used as a re-entry signal if the trade is stopped out (i.e., the stop loss is triggered). This re-entry is contingent on higher timeframes and ATR still supporting the original trend, indicating that the initial stop-out may have been a false signal.
Portfolio Reinvestment for Compound Growth:
The strategy allocates 95% of the portfolio's capital to each trade.
This approach maximizes the potential for compound growth, as a significant portion of the available capital is reinvested in each trade, provided that risk management rules are satisfied. This approach is appropriate for this strategy as strict risk management is applied and the winrate is almost 50%
Accounting for Exchange Fees:
Exchange fees, set at 0.1%, are factored into the strategy's calculations.
This ensures that trading decisions take into account the cost of executing trades on the exchange.
Avoiding Lookahead Bias and Repainting:
The strategy is designed to prevent lookahead bias by making calculations based only on closed bars of price data. Lookahead bias occurs when future data is used to make past trading decisions, potentially leading to unrealistic expectations.

Ethereum is in a tight price zoneWhat is clearly visible in this picture is that Ethereum has built a resistance in the $1936 area and I expect a drop from this area to the short-term upward trend line. If there is no support in this trend line, it can fall to the next support, which is the $1700 area.
If the $1936 resistance is broken, the next resistance is the $2000 area

ETHUSD Breakout TradeETHUSD Breakout Trade - Parrellel channel about to break its support, place sell stop with given tp.

ETHEREUM more correction expected for the price ❌🧨Hello 🐋
the price has started the new trend to the downside before any other huge pump and this trend should be completed ❌🧨
if
the price doesn't break the resistance zone to the upside and just complete the retest, we will see more correction ❌🧨
if
breakout of the lower support zone be completed, we can see more correction to the downside ❌🧨
brief amount of green candlesticks to the upside before any other movement is logical 📖💡
👌 Notice: pay attention to the price on shortcut chart (located above the main chart with black colour) 📖💡
Please, feel free to share your point of view, write it in the comments below, thanks 🐋
Etherium bullEtherium is bull
Reasons are
Impelsive wave in daily hit 161 percent
Retest to 100 percent
There is a QM pattern in daily which is tested,
Choch is done in H4 right now,
Minor rest is possible to the domain breakout area in H1,
Major reason is there is weekly impelsive wave and all this moment is the restet to the golden zone.
This is just idea for educational purpose only .

ETHUSDT 1DETH on the daily continues to move in a range between 2020.29 and 1741.43 and has not reached the lower boundary which would be 1690.32, where in addition to being a smart money support region it is also where the MM100 is.
It may not arrive, even because its stochastic RSI is indicating deep exhaustion of selling forces, which could break the upward accumulation triangle. .
After the recent Shapella update, daily stake deposits increased by 500%. Despite the withdrawal requests being mostly from centralized exchanges, the data suggests that the withdrawn ETH is mostly used for internal operations rather than sales.
.Main support levels : 1741 / 1690
Key Resistance Levels :1860 / 2020
MM100: 1690

Ether: supported by meme-frenzyThere have been some interesting developments with ETH`s price during the previous week. Namely, nobody has expected that meme-frenzy will hit the market for one more time. It has been supported by the release of a new SpongeBob token on Thursday, whose price surged by an incredible 600% during the first few days of trading. At the same time, Pepecoin surged by more than 120%. This meme-mania supported the price of ETH, however, it impacts less coins in circulation, since more ETH`s is burned in order to support memes. At one moment, the price of ETH reached level of $2.020, however, the coin is finishing the week around $1.9K, with prevailing selling orders.
RSI continues to move around the 50 for the last two weeks. It seems that there is no strength for a move toward the overbought side, due, most probable road in the coming period would be toward the oversold side. Moving average of 50 days continues to diverge from MA200 counterpart, still supporting the Golden cross, which is positive for the coin.
As per current charts, ETH will start the week ahead by testing the $1.850 support line. Whether there will be strength to break this line, will depend solely on a volume of selling orders. On the opposite side, there is a lower probability for the price to reach $2K, still levels above $1.9K might be shortly tested.

ETH Upward Break... Waiting For RetestETH Broke out of its upper trend and is going down for a retest. Trade Safe and don't take on too much risk! This is a very bullish sign and is a classic setup!

ETH NEXT MONTHETH started correction
we may test 0.3 level ang go deeper then might bounce of zone 27 and get back to test zone 0.6 after which go deeper to -0.618
abra cadabra ! BUM!
