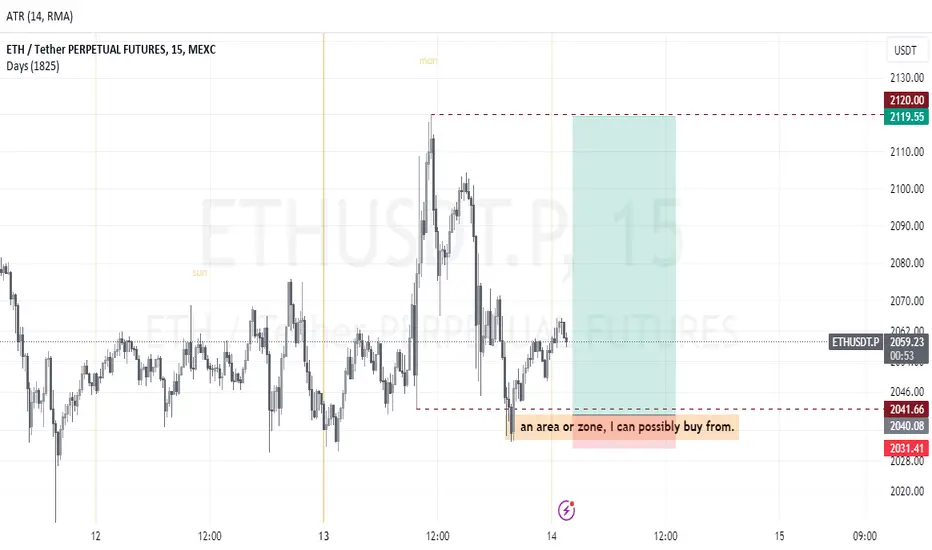
ETH Trade setup for 14th Nov 2023Eth has been bullish compared to BTC, so for me to trade this pair because it refused to make lower low but it also still took out some lows as an inducement to go short however, that's not the actually direction. It's direction is bullish to offset short traders. My possible scenario is for the market to trade into my zone at about 9:30am NY time today, then I can see what price is doing. If there be reasons to go long or short.
ETHEUR
ETH Breaks Through $2000 with Blackrock's New ETH ETF!
I'm thrilled to share that Ethereum (ETH) has just shattered the $2000 mark, and the excitement doesn't end there. Blackrock, the renowned investment management firm, has recently announced the launch of their brand-new Ethereum Exchange-Traded Fund (ETF). This development is a game-changer for the crypto market and presents an incredible opportunity for all of us.
ETH's breakthrough beyond $2000 is a testament to its growing popularity and widespread adoption. With the backing of Blackrock, a giant in the financial industry, this milestone further solidifies Ethereum's position as a leading digital asset. The launch of their ETH ETF is a clear indication of the increasing institutional interest in cryptocurrencies and the immense potential they hold.
Now, you might be wondering, what does this mean for you as a trader? Well, it's time to seize the moment and consider going long on ETH! The combination of ETH's remarkable price surge and the introduction of Blackrock's ETH ETF opens up a world of possibilities. It's an ideal time to capitalize on this bullish trend and potentially reap substantial profits.
So, why should you consider long positions on ETH? Here are a few compelling reasons:
1. Institutional Confidence: With Blackrock's entry into the Ethereum market, it's evident that major financial players are recognizing the long-term value and potential of ETH. This institutional confidence can act as a catalyst for further price appreciation.
2. Market Momentum: ETH's recent breakthrough is a testament to its growing demand and market momentum. As more investors flock to Ethereum, the upward trend is likely to continue, potentially leading to even greater gains.
3. Diversification: Adding ETH to your portfolio provides diversification, reducing risk and offering exposure to a rapidly expanding asset class. With Blackrock's ETH ETF, you can now access Ethereum's potential without directly holding the underlying asset.
Now is the time to take action and make the most of this exciting opportunity. Consider long positions on ETH, keeping in mind your risk tolerance and investment strategy. As always, it's essential to conduct thorough research and consult with your financial advisor before making any investment decisions.
Remember, the crypto market is known for its volatility, so it's crucial to stay informed and adapt your strategy accordingly. Keep a close eye on market trends, news updates, and any regulatory developments that may impact the crypto space.
Wishing you a prosperous journey as you navigate the exciting world of cryptocurrencies!
Happy trading!

BTC Bottom? Through the RSI we can see that bitcoin is extremely oversold. Whenever this has happened in the past, it has followed a rise in price. I believe that the bottom can be between 20k and 10k (not lower) and this is an excellent time to accumulate.

Here's How ETH goes to $3K: Elliot WaveHi Traders, Investors and Speculators of Charts📈📉
Ethereum has recently started a new bullish cycle along with the rest of the markets, predominantly led by BTC as always.
When we take a look at ETH from an Elliot Wave Theory analysis, we see the start of a new 12345 Wave cycle. ETHUSDT is currently trading in Wave 2-3, generally know as the longest/biggest wave of all the waves during the upward price action phase.
There are a couple of theoretical points to consider when using the Elliot Wave theory and we take a deep dive into the theory and conclude the possible end point of Wave 2-3 at $3k.
From a Technical Indicator analysis, we see a BUY signal flash on the weekly timeframe with CryptoCheck START V3.5:
The weekly TF together with this indicator is usually a great way to confirm the bias f bullish price action.
_______________________
📢Follow us here on TradingView for daily updates and trade ideas on crypto , stocks and commodities 💎Hit like & Follow 👍
We thank you for your support !
CryptoCheck

ETHUSD Next MovePair : ETHUSD ( Ethereum / U.S Dollar )
Description :
Bearish Channel as an Corrective Pattern in Long Time Frame
Divergence - RSI
Break of Structure
Completed " ABC " Corrective Wave
Rising Wedge as an Corrective Pattern in Short Time Frame with the Breakout of the Lower Trend Line

ETHEthereum technical analysis:
Considering the bearish cross of the four-hour time frame and the fact that the price is in the bamm trigger area, we expect Qinet to reach the specified bearish targets.

ETH to drop hard?Please 1st of all click the boost 🚀 button if you want me to post more ideas and follow me to support my work! It's absolutely for free.
Ethereum broke down this triangle📐 and I think there is chance for run to 973 and even lower. Setting SELL LIMIT order to previous range low @ 1233 to catch🎣 the pullback. The low @ 1172 is going to be critical, bulls do need to defend this level if they want to spoil the bears' party.
ENTRY : 1233
STOPLOSS (SL) : 1292
TARGET (TP) : height of the triangle projected from midpoint of the previous range (pink line in the middle) @ 973
REWARD RISK RATIO (RRR) : 4.4
INVALIDATION : when STOPLOSS level hit
Check my other stuff in related ideas.
Please boost🚀, comment🗣️, follow me✒️, enjoy📺!
⚠️Disclaimer: I'm not financial advisor. This is not a financial advice. Do your own due dilingence.

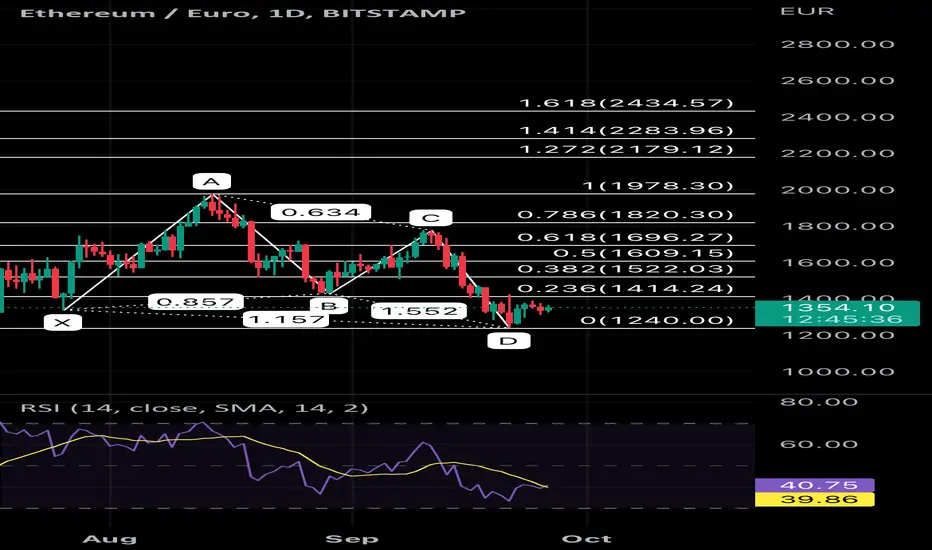
Daily ETHEUR analysisButterfly pattern is available on daily chart, Check the fibo levels for clear vision.
Ethereum - Low monthly volume susggests no trend reversalLike Bitcoin, Ethereum has been mostly choppy for the past two weeks. It has been oscillating predominantly between 1 250 USD and 1 400 USD in a reflection of the indecisiveness of market participants. Despite that, we are committed to our bearish thesis and expect ETHUSD to hit our price target of 1 000 USD by the end of Q4 2022.
Our views are based on a combination of fundamental and technical factors. In our opinion, driving market forces like interest rates and economic tightening will continue to weigh on the market, dragging it deeper into the bear market territory. Additionally, technical factors tell that same story, which points to the bear market rally at the moment rather than trend reversal and double bottom formation. Moreover, low monthly volumes hint at the fact that Ethereum is not gaining much interest among new investors, making the primary trend reversal very improbable.
Furthermore, we expect market volatility to pick up from here, leading to high anxiety and more risk aversion. Because of that, we have no reason to change our bias and stick to our price targets of 1 000 USD and 900 USD.
Illustration 1.01
Illustration 1.01 shows the monthly chart of ETHUSD. The yellow arrow points to the low monthly volumes.
Technical analysis - daily time frame
RSI is turning neutral. Stochastic is bullish. MACD points to the upside but stays in the bearish area. DM+ and DM- are bearish. Overall, the daily time frame is bearish
Illustration 1.02
Illustration 1.02 displays the daily chart of ETHUSD and simple support and resistance levels.
Technical analysis - weekly time frame
RSI is neutral. Stochastic is bearish. MACD points to the upside but stays in the bearish territory. DM+ and DM- stay bearish. Overall, the weekly time frame is bearish.
Please feel free to express your ideas and thoughts in the comment section.
DISCLAIMER: This analysis is not intended to encourage any buying or selling of any particular securities. Furthermore, it should not be a basis for taking any trade action by an individual investor. Therefore, your own due diligence is highly advised before entering a trade.

Ethereum - More pain ahead after the bounce Ethereum, similarly to Bitcoin, enjoys a temporary relief. However, we remain bearish as fundamental and technical factors do not force us to reassess our views. For the short-term, however, we would not be surprised to see a bit more upside as we expect many market participants to forecast the bottom and hunt for a bargain. Despite that, we think the bounce in price will be short-lived like on previous occasions. Accordingly, we stick to our 1 000 USD and 900 USD price targets.
Illustration 1.01
Illustration 1.01 shows the short-term setup for ETHUSD.
Technical analysis - daily time frame
RSI is bullish. MACD is slightly bullish but stays in bearish territory. DM+ and DM- are bullish. Overall, the daily time frame is slightly bullish; however, the trend is weak.
Technical analysis - weekly time frame
RSI, MACD, Stochastic, DM+, and DM- are all bearish. Overall, the weekly time frame is bearish.
Please feel free to express your ideas and thoughts in the comment section.
DISCLAIMER: This analysis is not intended to encourage any buying or selling of any particular securities. Furthermore, it should not be a basis for taking any trade action by an individual investor. Therefore, your own due diligence is highly advised before entering a trade.

Ethereum - Due to drift lower In August 2022, we stated a bullish narrative regarding Ethereum's “merge” is absolute nonsense that will be proved wrong as time progresses. Then over the coming weeks, we also expressed our worries about the FED meeting in September 2022. Indeed, just hours before the FOMC, we speculated that Ethereum could have experienced a short-lived bounce, followed by a sharp drop. Our assessment proved to be correct, and Ethereum bounced up after the FED decision and then fell with the rest of the market. Because of that, combined with fundamental and technical factors, we continue to be bearish on Ethereum. Accordingly, we stick to our price targets of 1000 USD and 900 USD.
Illustration 1.01
Illustration 1.01 shows simple support/resistance levels for ETHUSD.
Technical analysis - daily time frame
RSI, MACD, Stochastic, DM+, and DM- are all bearish. Overall, the daily time frame is bearish.
Technical analysis - weekly time frame
RSI, MACD, Stochastic, DM+, and DM- are all bearish. Overall, the weekly time frame is bearish.
Please feel free to express your ideas and thoughts in the comment section.
DISCLAIMER: This analysis is not intended to encourage any buying or selling of any particular securities. Furthermore, it should not be a basis for taking any trade action by an individual investor. Therefore, your own due diligence is highly advised before entering a trade.

ETHEUR Idea H4Here is my view for ETHEUR on H4. The price could go down, you can put a pending order on the Order block or find an entry on LTF within OB Zone. Trade Safe!

Ethereum - Pump and dump on a horizonSeptember 2022 brings many exciting events for the stock and cryptocurrency markets alike. However, we will pay close attention mainly to two events in particular. The first event we will pay attention to is the “merge” with the soft deadline on the 19th of September 2022; the merge will see the current execution layer being combined with a new consensus layer. As a result, Ethereum will transit from proof-of-work to proof-of-stake. That, in turn, will eliminate the need for energy-intensive mining and give Ethereum a competitive edge against other cryptocurrencies.
While the transition is significant from an environmental and technological point of view, it is less significant from a trading perspective. It does not change the fact that the FED will continue to increase interest rates to battle inflation (which will subsequently weigh on the economy and lead to risk aversion). Additionally, the distribution of ETHW tokens (Ethereum on the old proof-of-work protocol) raises our concerns. Because of these “out of the thin air” tokens, we think there might be an initial increase in the price of Ethereum (especially before the merge). However, we expect a potential bounce to be temporary and newly created tokens to be dumped on the market together with Ethereum (after the merge).
Our bearish view is also supported by technical factors, which show very low liquidity in the market. Simultaneously, several technical indicators point to the downside for ETHUSD. Because of that, we stick to our price target at 1 000 USD and 900 USD
Illustration 1.01
Illustration 1.01 shows the daily chart of ETHUSD. The green arrow indicates a price increase. The red arrow indicates a volume decrease. These developments, occurring simultaneously, often foreshadow a trend reversal (in this case, a trend of a lesser degree).
Technical analysis - daily time frame
RSI and Stochastic are bullish. MACD is neutral; however, if it breaks above 0 points, it will bolster the bullish case in the short term. DM+ and DM- perform whipsaws, while ADX contains a relatively low value. Overall, the daily time frame is mixed.
Illustration 1.02
The image above displays the daily chart of ETHUSD and simple support/resistance levels. Ideally, we would like to see a breakout below the short-term support; that will bolster the bearish case for Ethereum.
Technical analysis - weekly time frame
RSI and Stochastic are slightly bullish. MACD is neutral. DM+ and DM- stay bearish. Overall, the weekly time frame is less bearish than a week ago.
Illustration 1.03
Illustration 1.03 shows the weekly chart of ETHUSD and two moving averages. The yellow arrow indicates the natural retracement toward the 20-week SMA. Ideally, we would like to see the price stay below this average.
Please feel free to express your ideas and thoughts in the comment section.
DISCLAIMER: This analysis is not intended to encourage any buying or selling of any particular securities. Furthermore, it should not be a basis for taking any trade action by an individual investor. Therefore, your own due diligence is highly advised before entering a trade.

ETHEUR Idea H1Here is my view for ETHEUR on H1. The price could go up, you can put a pending order on the Order block or find an entry on LTF within OB Zone. Trade Safe!

ETH moving Hi guys, here is yet another idea. If we hold on, on our trend line and we do not fall under, there is a big chance of jumping up to 0.786. Otherwise, we will probably fall to 1564. Eventually 1543 can get tested as well. What do you think?
If you find this helpful please hit that boost button!

Ethereum about to jump to 2100+Hello guys, I just wanted to share this idea with you. As we can see on the graph the 2nd top was reached 4 months ago. 1st top was reached 8 months ago. So as you can see, a difference between those two tops is 4 months. I think our new top might be forming and it could be reached in the following 2 weeks.
If you find this idea helpful please leave a boost!

Ethereum - Panic creeps back into the marketThroughout July and August, we warned that the bounce in the cryptocurrency market, which many rushed to call a trend reversal, was a bear market rally doomed to fail. Then, on 16th August 2022, we gave an ultimate warning to investors as we speculated the top was in for the rally, and a 50% decline was looming.
Since then, the price of Ethereum has fallen an astounding 25%, and we have seen more confirmations of our bearish thesis. Because of that, we continue to be bearish in the short, medium, and long term. Indeed, we think the selloff will accelerate in the foreseeable future, leading to panic selling and subsequently to new lows over time.
Our views are based upon technical indicators that flash strong warning signs across the board and low liquidity in the market. However, fundamental factors also significantly contribute to our bearish opinion. Repeatedly, higher interest rates, quantitative tightening, and a slowing economy pose a great threat to the stock market and the cryptocurrency market.
Accordingly, we stick to our price target of 1 000 USD per Ethereum. However, we would like to set also a second price target for ETHUSD at 900 USD.
Illustration 1.01
The picture shows the daily chart of Ethereum and two moving averages, 20-day SMA and 50-day SMA. On 24th July 2022, these averages underwent mean reversion, signifying a powerful downtrend correction. We would like these averages to reverse into a bearish constellation to give us further bearish confirmation.
Technical analysis - daily time frame
RSI, MACD, Stochastic, DM+, and DM- are all bearish. Overall, the daily time frame is bearish.
Illustration 1.02
The illustration shows two bearish breakouts that confirmed our thesis in the past two weeks. Interestingly, these developments are identical to those on the chart of BTCUSD.
Technical analysis - weekly time frame
RSI, MACD, Stochastic, DM+, and DM- are all bearish. Overall, the weekly time frame is bearish.
Illustration 1.03
Illustration 1.03 shows simple support and resistance levels derived from peaks and troughs.
Please feel free to express your ideas and thoughts in the comment section.
DISCLAIMER: This analysis is not intended to encourage any buying or selling of any particular securities. Furthermore, it should not be a basis for taking any trade action by an individual investor. Therefore, your own due diligence is highly advised before entering a trade.

ETHEUR Idea H1Here is my view for ETHEUR on H1. The price could go up, you can put a pending order on the Order block or find an entry on LTF within OB Zone. Trade Safe!

ETH 3 DAYS FORECAST Hi guys. I just wanted to share this idea with you. In my opinion ETH will stay around 1850-1900 until 17 or 18th of August. Then I think we can expect another bigger move. I only wonder where it will decide to go. What do you think guys?

Ethereum - "FOMO" backfiringOn 15th August 2022, we proposed the idea of Ethereum being at the top of a bear market rally. Following our announcement, Ethereum erased more than 20% of its value within the following week. This move came as a blow to many market participants expecting the rally to continue toward the new ATH.
However, we have stressed for some time now that this would not be possible during 2022. Rather than that, we have said many times that the bear market would persist throughout the current year and likely during the next one.
Our assessment is based on fundamental and technical factors we explain below and in our previous ideas. Our price target for ETHUSD is 1 000 USD.
Illustration 1.01
Illustration 1.01 shows bearish breakouts that helped us to confirm our bearish thesis.
Technical analysis - daily time frame
RSI, MACD, Stochastic, DM+, and DM- are all bearish. Overall, the daily time frame is bearish.
Technical analysis - weekly time frame
RSI, MACD, Stochastic, DM+, and DM- are all bearish. Overall, the weekly time frame is bearish.
Please feel free to express your ideas and thoughts in the comment section.
DISCLAIMER: This analysis is not intended to encourage any buying or selling of any particular securities. Furthermore, it should not be a basis for taking any trade action by an individual investor. Therefore, your own due diligence is highly advised before entering a trade.

Ethereum - 50% decline loomingSimilarly, like in the case of Bitcoin, we also remain bearish on Ethereum. Indeed, we still maintain our price target of 1000 USD per coin. Our views are based on technical and fundamental factors detailed below and in the previous articles.
Illustration 1.01
Illustration 1.01 shows the updated setup for ETHUSD with the bearish trigger below the immediate support.
Technical analysis - daily time frame
RSI left the overbought territory, which is bearish. MACD is flattening. Stochastic is bearish. DM+ and DM- are bullish. Overall, the daily time frame is neutral/slightly bearish.
Illustration 1.02
Volume continues to decline, which is bearish.
Technical analysis - weekly time frame
RSI is neutral. MACD and Stochastic are bullish. DM+ and DM- are bearish. Overall, the weekly time frame is slightly bullish.
Please feel free to express your ideas and thoughts in the comment section.
DISCLAIMER: This analysis is not intended to encourage any buying or selling of any particular securities. Furthermore, it should not be a basis for taking any trade action by an individual investor. Therefore, your own due diligence is highly advised before entering a trade.

Ethereum - Raging bull market?! Is it, really?!In our previous idea, we argued Ethereum reached a potential top of the bear market rally. However, we remain cautious until we see more signs to confirm our assessment.
Our view is based upon bearish fundamental factors that will persist throughout 2022 and 2023, dragging the global economy into recession and causing risk-off sentiment. In our opinion, the drying up liquidity in the cryptocurrency market suggests trouble ahead, with volumes being low compared to where they were during previous bull markets. Additionally, several technical indicators flash overbought conditions for ETHUSD.
As if it was not enough, the market sentiment reflects raging “bull market euphoria” among retail investors, with many forgetting how deceitful bear market rallies tend to be. Mounting calls for the trend reversal, and new ATH point to the classic irrationality of market participants during such periods.
These developments worry us and, indeed, they lead us to speculate that the looming selloff will have extreme nature. Therefore, we maintain a bearish outlook on Ethereum. Accordingly, we stick to our price target of 1 000 USD.
Illustration 1.01
The picture above shows the daily chart of ETHUSD. The red arrow indicates a gradual decline in volume over the past three days. To confirm our previous assessment about the potential top, we would like to see a build-up in volume accompanying a price decline. So far, we have not seen that. Another development we would like to see is a breakout below the sloping support and the immediate support. That would bolster a bearish case for Ethereum.
Technical analysis - daily time frame
RSI crossed below 70 points, which is bearish; however, it is turning neutral. MACD is due to perform a bearish crossover. Stochastic is bearish. DM+ and DM- are bearish. Overall, the daily time frame is neutral/slightly bearish.
Illustration 1.02
Illustration 1.02 shows the magnitude of bear market rallies during the bear market of 2018.
Technical analysis - weekly time frame
Stochastic is bullish. RSI is flattening. MACD is bullish. DM+ and DM- are bearish. Overall, the weekly time frame is neutral.
Illustration 1.03
The setup we introduced in the previous idea remains valid.
Please feel free to express your ideas and thoughts in the comment section.
DISCLAIMER: This analysis is not intended to encourage any buying or selling of any particular securities. Furthermore, it should not be a basis for taking any trade action by an individual investor. Therefore, your own due diligence is highly advised before entering a trade.

ETH BOTTOM IS IN - Target $10k-$15k MartyBoots here. I have been trading for 16 years and I am here to share my ideas with you to help the Crypto space.
IF THIS PLAYS OUT THE LOWS IN ALTS ARE ALMOST IN
The ETH BOTTOM looks to be in and we in CryptoCheck intend to be prepared for it $$$$$$
LIFE CHANGING OPPORTUNITY
DO NOT BE LEFT BEHIND
------------------------------------------------------------------------------------------------------------------------------------------------------------
If you want help trading Bitcoin or any other ALT coins hit me up , We will improve your trading . Have a look at the link below
------------------------------------------------------------------------------------------------------------------------------------------------------------
