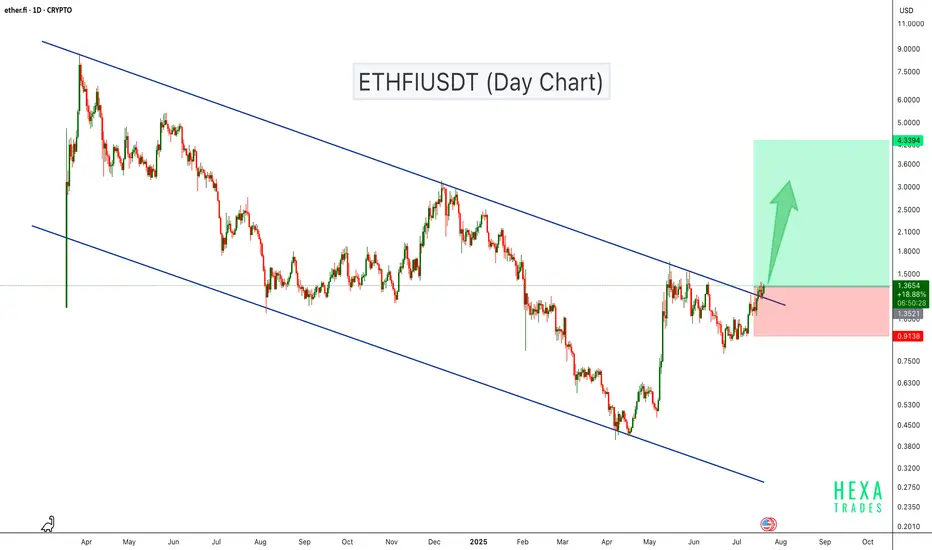
ETHFI Breaks Out of Descending Channel – Bullish Rally Ahead?ETHFI has been trading inside a descending channel for over a year, consistently respecting both resistance and support levels. Recently, the price broke above the channel resistance with strong bullish candles, suggesting a potential trend reversal.
This breakout indicates growing bullish momentum, and if the price sustains above the breakout level, we could see a move towards the $4.00–$4.70 range in the coming weeks.
Cheers
Hexa
Ethfi
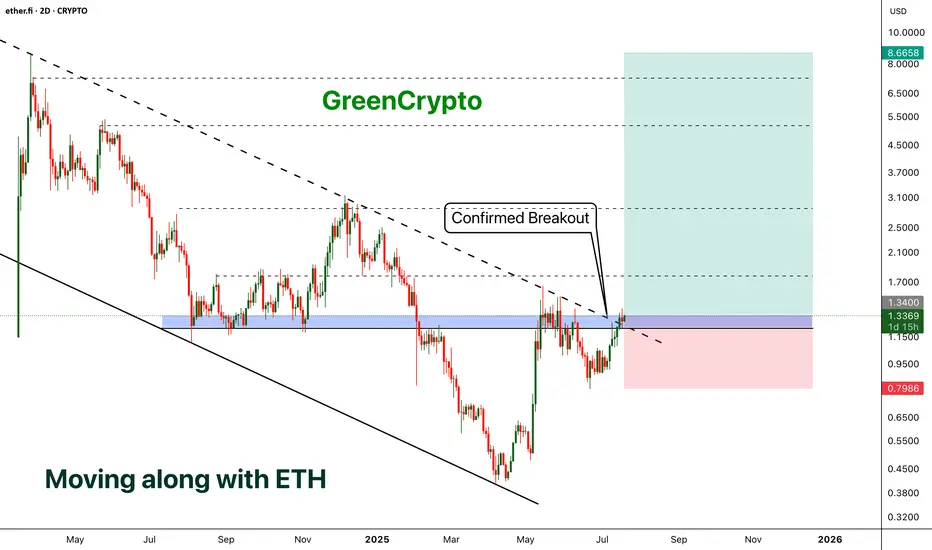
ETHFI - Moving along with the ETH- ETHFI has finally broken out from the descending channel pattern and now price is above the trending resistance line.
- We can expect a minor reversal (chances are less ) and parabolic move from here.
- I'm expecting at-least 500+% profit from this opportunity
Entry Price: 1.3384
Stop Loss: 0.7965
TP1: 1.7657
TP2: 2.5436
TP3: 4.5055
TP4: 5.6136
TP5: 8.5626
Max Leverage 5x.
Don't forget to keep stoploss.
Support us by Liking and following.
Thanks and Cheers!
GreenCrypto
ETHFI Coil Tightens Above Key SupportThis is ETHFI on the daily.
It’s currently consolidating above four major support levels:
• The black line at $1.097
• The 200-day MA
• The 50-day MA
• Bollinger Band center
A golden cross is approaching, and if price pushes higher, it could confirm soon. RSI is holding strong above both the 50 level and the signal line, suggesting bullish momentum is intact.
There’s also a bullish triangle forming between the series of lower highs and the $1.097 black line. Volume is decreasing, just as expected before a breakout. While breakouts can technically go either way, my bias remains bullish here.
From a fundamental standpoint, ETHFI benefits from the rising trend of restaking staked ETH, now regulated and attracting serious institutional interest.
Holding this support and completing the golden cross could be a volatile process, especially with ETHFI’s small $424M market cap and big macro events this week (like CPI and potential tariff news) on the radar.
Always take profits and manage risk.
Interaction is welcome.

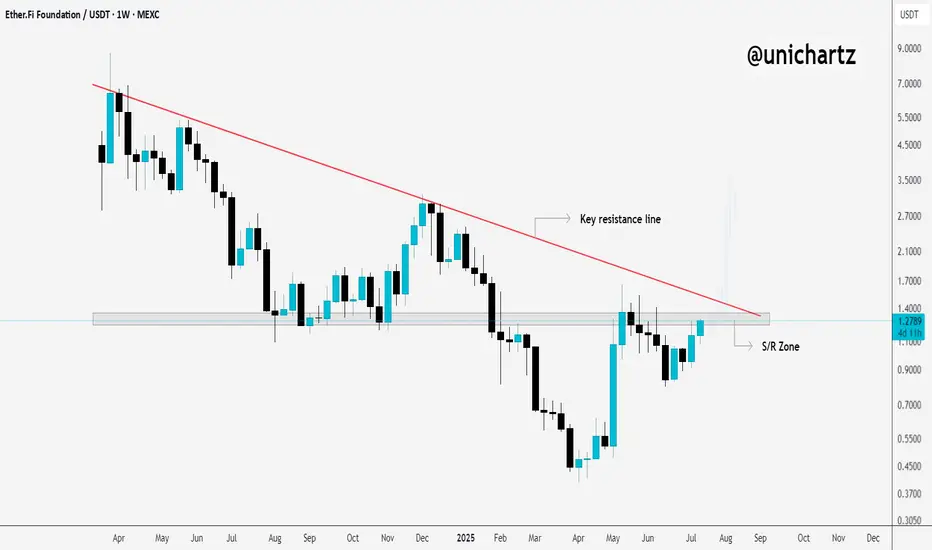
ETHFI Bulls Need to Flip This Level for Upside ContinuationCRYPTOCAP:ETHFI is still hovering around the key S/R zone and trading just below the major trendline resistance on the weekly timeframe.
This area has been a strong rejection point in the past, so it’s a crucial level to watch.
If we get a clean breakout and weekly close above this zone, it could trigger a breakout from the long-term downtrend, potentially kicking off a fresh bullish move.
Keep a close eye. A decisive move is coming.
DYOR, NFA
ETHFI/USDT – BREAKOUT ALERT! Descending Trendline Under Pressure
After over a year of relentless bearish pressure, ETHFI is now approaching a critical technical juncture that could mark the beginning of a major trend reversal. The chart displays a long-term descending trendline, and bulls are now challenging it with growing strength. This setup could lead to a powerful breakout and a potential trend shift.
🧩 Technical Pattern Overview:
🔸 Descending Trendline Resistance – Established since April 2024, acting as a dominant resistance across multiple retests.
🔸 Base Accumulation – Price has formed a strong base between $0.80–$1.00, indicating declining selling pressure and potential accumulation.
🔸 Volatility Squeeze – Price action is tightening near the apex of the descending triangle, suggesting that a breakout (up or down) is imminent.
🔸 Breakout Watch – A confirmed breakout above $1.25 would be a major bullish signal.
🐂 Bullish Scenario (Confirmed Breakout):
If the price breaks and closes above $1.25 with strong volume:
🎯 Potential Upside Targets:
Target 1: $1.784 – Previous local resistance
Target 2: $2.390 – Former consolidation zone
Target 3: $2.959 – Key psychological resistance
Extended Targets: $5.024 and $7.001 if a sustained rally unfolds
Ultimate ATH: $8.660 – If the broader crypto market enters full bullish mode
💡 Catalysts to Watch: Altseason, project news, favorable macro sentiment, or exchange listings.
🐻 Bearish Scenario (Rejection at Resistance):
If ETHFI fails to break out and gets rejected at the descending trendline:
🔻 Potential Downside Levels:
$1.088 – Immediate support
$0.88 – Minor support
$0.70 – Historical support zone
$0.50 to $0.35 – Deeper bearish targets if selling resumes
⚠️ Fakeouts are common during volatile phases — always wait for confirmation with volume.
📌 Conclusion & Strategy:
ETHFI is at a make-or-break level. A confirmed breakout could trigger a strong upward rally with high risk/reward potential. However, failure to break resistance could lead to continued consolidation or even downside.
🔍 Traders should watch for a clean breakout above $1.25, preferably with high volume. Risk management is key — define your invalidation levels and stick to your plan.
🧠 Trading Recommendations:
🟢 Breakout traders: Wait for confirmation > $1.25
🟡 Accumulate: Between $0.90–$1.00
🔴 Stop-loss: Below $0.85 for conservative risk
📈 Risk/Reward after breakout: Attractive (1:3 or better)
#ETHFI #ETHFIUSDT #CryptoBreakout #DescendingTrendline #AltcoinAnalysis #TechnicalAnalysis #BreakoutTrading #CryptoSignals #BullishReversal

ETHFIUSDT Breakout Loading!CRYPTOCAP:ETHFI is consolidating within a symmetrical triangle on the 4H chart, with price tightening between descending resistance and rising support. A breakout or breakdown is likely soon. Watch for volume confirmation. Key levels to watch: $1.35 (resistance) and $1.00 (support). Breakout could lead to $1.50+, while breakdown risks a drop toward $0.95.

ETHFIUSDT breakdown alertETHFIUSDT breakdown alert
ETHFIUSDT has broken down from a triangle pattern and appears to have completed a retest of the breakdown zone. If the price fails to reclaim this level and continues to reject it, we could see further downside pressure in the coming sessions.
Key levels to monitor:
– Breakdown zone now acting as resistance
– Immediate support below
– Volume confirmation to validate the move
Watch ETHFI closely — if the retest holds, it may lead to continued bearish momentum.

ETHFIUSDT 2D AnalysisETHFI ~ 2D Analysis
#ETHFI Buy after successfully breaking this resistance line with a short term target of at least 15%+ and a long term target of $8.7

ETHFIUSDT | Bearish Bias Below the Red BoxETHFIUSDT isn’t showing strength here. Price is stuck below a clear red box resistance, and as long as that holds, my bias stays short.
There’s no sign of buyer aggression. CDV remains flat, and any volume upticks have been absorbed. Unless that red box is broken and retested, I see no reason to flip bullish.
Short ideas stay valid until proven otherwise.
Let the market earn your trust — not the other way around.
📌I keep my charts clean and simple because I believe clarity leads to better decisions.
📌My approach is built on years of experience and a solid track record. I don’t claim to know it all but I’m confident in my ability to spot high-probability setups.
📌If you would like to learn how to use the heatmap, cumulative volume delta and volume footprint techniques that I use below to determine very accurate demand regions, you can send me a private message. I help anyone who wants it completely free of charge.
🔑I have a long list of my proven technique below:
🎯 ZENUSDT.P: Patience & Profitability | %230 Reaction from the Sniper Entry
🐶 DOGEUSDT.P: Next Move
🎨 RENDERUSDT.P: Opportunity of the Month
💎 ETHUSDT.P: Where to Retrace
🟢 BNBUSDT.P: Potential Surge
📊 BTC Dominance: Reaction Zone
🌊 WAVESUSDT.P: Demand Zone Potential
🟣 UNIUSDT.P: Long-Term Trade
🔵 XRPUSDT.P: Entry Zones
🔗 LINKUSDT.P: Follow The River
📈 BTCUSDT.P: Two Key Demand Zones
🟩 POLUSDT: Bullish Momentum
🌟 PENDLEUSDT.P: Where Opportunity Meets Precision
🔥 BTCUSDT.P: Liquidation of Highly Leveraged Longs
🌊 SOLUSDT.P: SOL's Dip - Your Opportunity
🐸 1000PEPEUSDT.P: Prime Bounce Zone Unlocked
🚀 ETHUSDT.P: Set to Explode - Don't Miss This Game Changer
🤖 IQUSDT: Smart Plan
⚡️ PONDUSDT: A Trade Not Taken Is Better Than a Losing One
💼 STMXUSDT: 2 Buying Areas
🐢 TURBOUSDT: Buy Zones and Buyer Presence
🌍 ICPUSDT.P: Massive Upside Potential | Check the Trade Update For Seeing Results
🟠 IDEXUSDT: Spot Buy Area | %26 Profit if You Trade with MSB
📌 USUALUSDT: Buyers Are Active + %70 Profit in Total
🌟 FORTHUSDT: Sniper Entry +%26 Reaction
🐳 QKCUSDT: Sniper Entry +%57 Reaction
📊 BTC.D: Retest of Key Area Highly Likely
📊 XNOUSDT %80 Reaction with a Simple Blue Box!
📊 BELUSDT Amazing %120 Reaction!
📊 Simple Red Box, Extraordinary Results
I stopped adding to the list because it's kinda tiring to add 5-10 charts in every move but you can check my profile and see that it goes on..

EtherFi Governance Token & The 2025 Bull Market (PP: 1,111%)EtherFi is hot right now just as Ethereum is very hot. The project looks really good with great offerings, great products... Let's consider the chart. If you have a good product with a great chart, that's a combination for a massive 2025 bull market. You are bound to get numbers beyond this chart.
The long-term support and accumulation zone was lost in late February/early March. It was recovered again in May. The bottom was only available for two months. You are one of the lucky few if you decided to buy at bottom prices. Prices that will never become available again.
ETHFI is back above its August 2024 low, thus bullish; now trading with a bullish bias within its long-term accumulation zone. A price zone where we can buy, big, focusing on the long-term. A great chart, huge potential for growth, can't say it often enough.
There is really high volume here, the highest since launch date.
This high volume indicates and confirms that the bottom is in. If prices were to move back lower, trading volume the past two weeks would be much lower. Since prices are set to grow, volume is really high, the whales are loading up.
Not all is lost. It is still early because the last drop was a stop-loss hunt event. Notice the blue space on the chart, this is the standard buy zone. Here, in this range, ETHFIUSDT traded for more than 3 months in 2024.
A bull market can be expected now, a bullish trend.
Nice and easy, buy and hold; the market will take care of the rest.
This post is meant to alert you of a great entry timing and prices.
This is for spot traders. An easy buy. —Focused on the long-term.
Thank you for reading.
Namaste.

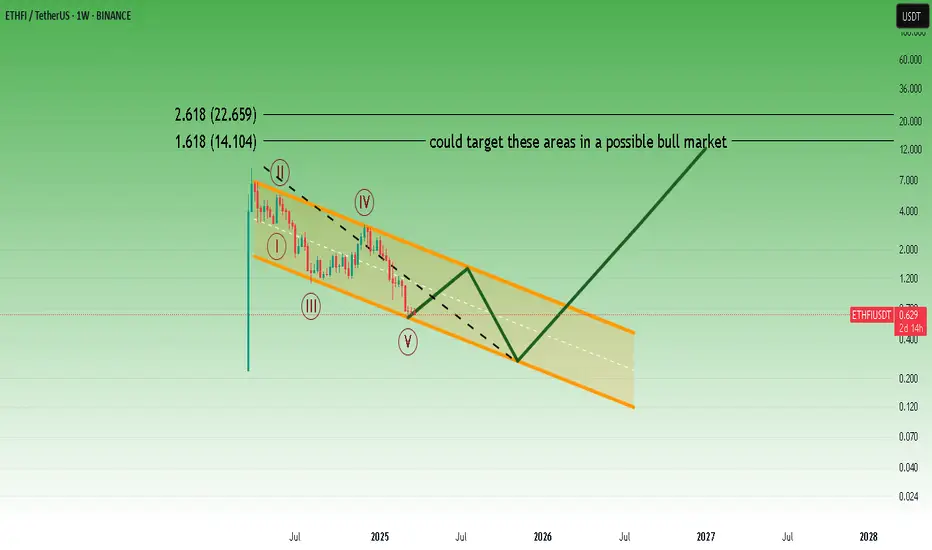
ETHFI Will Outperform Ethereum In This CycleHello, Skyrexians!
Yesterday we pointed out the great potential performance of Ethereum, but we have assets which depends on it but can perform much much better because of small cap. I personally have already bough BINANCE:ETHFIUSDT in February and March with average price $0.7, so now I have 2x, but this growth is not finished.
After listing pump this crypto retraced that much in the global wave 2 ABC shaped. Bullish/Bearish Reversal Bar Indicator has printed the first green dot only on the very bottom, as a result asset entered into bull market. The next target is 1.61 Fibonacci at $14. This is going to be wave 3 and that's all!
Best regards,
Ivan Skyrexio
___________________________________________________________
Please, boost this article and subscribe our page if you like analysis!

EtherFi ETH.fi price analysis⁉️ Increased trading volumes, shrinking growth candlesticks, and a trend line "overhang" - for us, these factors indicate the likelihood that a correction is near.... And for you?
The #ETHfi price shot up nicely thanks to promising updates to the #Ethereum ecosystem, about which we write a few posts early.
🟢 And of course, there are further prospects for the growth of the #Etherfi project, because now the capitalization is only $375 million.
🔴 But still, in our opinion, the price of OKX:ETHFIUSDT would still be suitable to slightly correct to $0.84-0.74-0.64, whoever likes which figure)
🔝 And from there, with new strength, break through the trend to new heights.
_____________________
Did you like our analysis? Leave a comment, like, and follow to get more

ETHFI Looks Super Bullish (1D)It seems that wave C of our higher-degree correction has completed. Wave C appears to be a diametric pattern.
As long as the green zone holds, the price could advance toward the red Flip zone, where wave D may form.
A daily candle closing below the invalidation level would invalidate this view.
For risk management, please don't forget stop loss and capital management
When we reach the first target, save some profit and then change the stop to entry
Comment if you have any questions
Thank You

ETHFIUSDT 1DETHFI ~ 1D Analysis
#ETHFI The seller's pressure seems to have begun to decline. Buy after successfully penetrating this resistant line with a short -term target of at least 10%+.

Think simple.In such falling channels, the 3rd bottom point is the ideal buy point for me for bullmarket portfolio
* What i share here is not an investment advice. Please do your own research before investing in any asset.
* Never take my personal opinions as investment advice, you may lose all your money.
ETHFIUSDT 12HETHFI ~ 12H Analysis
#ETHFI Buy gradually after successfully penetrating this resistant line with a short -term target of at least 10%+.

ETHFIUSDT 2DETHFI ~ 2D Analysis
#ETHFI In 2D Time Frame this is the accumulation support block. If you still have Conviction on this coin, buy it from here with a minimum target of 15%++

ETHFI rebuy setup (1D)It seems that ETHFI is completing a symmetrical pattern. There are two important support zones on the chart. If the price reaches these zones, we can rebuy using this setup.
The low-risk areas for rebuying in spot trading are the two entries highlighted on the chart.
The targets are marked on the chart.
The closure of a daily candle below the invalidation level will invalidate this analysis.
For risk management, please don't forget stop loss and capital management
Comment if you have any questions
Thank You

ETHERFI : The Next Chapter...?ETHERFI is currently experiencing significant resistance at the $2.50 threshold. This price point has proven to be a formidable barrier to upward movement. Meanwhile, the overall Ethereum ecosystem is witnessing an increase in trading volume, indicating heightened interest and activity among investors. Should ETHERFI manage to break through the $2.50 level and maintain a sustainable price above it, we could potentially see the onset of a bullish rally. Such a move would likely signal increased confidence in the asset and could attract further buying pressure, paving the way for more substantial gains shortly.

ETHFI is bullish (1D)The correction of ETHFI has started from the place where we have placed the red arrow on the chart.
The correction seems diametrical now that the G wave is over.
We have specified two entry points, which can be entered into BUY/LONG position in case of reversal.
The targets are clear on the chart.
Closing a daily candle below the invalidation level will violate this analysis.
For risk management, please don't forget stop loss and capital management
When we reach the first target, save some profit and then change the stop to entry
Comment if you have any questions
Thank You

#ETHFI (SPOT) Entry ( 1.220- 1.620) T. (4.730) SL(.1.187)BINANCE:ETHFIUSDT
entry range ( 1.220- 1.620)
Target1 (2.405) - Target2 (3.151)- Target3 (3.830)- Target4 (4.730)
SL .1D close below (1.187)
______________________________________________________________
Golden Advices.
********************
* collect the coin slowly in the entry range.
* Please calculate your losses before the entry.
* Do not enter any trade you find it not suitable for you.
* No FOMO - No Rush , it is a long journey.
Useful Tags.
****************
My total posts
www.tradingview.com
1Million Journey
www.tradingview.com
www.tradingview.com
********************************************************************************************************************** #Manta ,#OMNI, #DYM, #AI, #IO, #XAI , #ACE #NFP #RAD #WLD #ORDI #BLUR #SUI #Voxel #AEVO #VITE #APE #RDNT #FLUX #NMR #VANRY #TRB #HBAR #DGB #XEC #ERN #ALT #IO #ACA #HIVE #ASTR #ARDR #PIXEL #LTO #AERGO #SCRT #ATA #HOOK #FLOW #KSM #HFT #MINA #DATA #SC #JOE #RDNT #IQ #CFX #BICO #CTSI #KMD #FXS #DEGO #FORTH # AST #PORTAL #CYBER #RIF #ENJ #ZIL #APT #GALA #STEEM #ONE #LINK #NTRN #COTI #RENDER #ICX #IMX #ALICE #PYR #PORTAL #GRT #GMT # IDEX #NEAR #ICP #ETH #QTUM #VET #QNT #API3 #BURGER #MOVR #SKL #BAND #ETHFI.

ETHFI/USDT CHART UPDATE !!ETHFI/USDT Trade Setup Update:-
ETHFI has broken out from a descending triangle pattern and confirmed support with a successful retest. The Ichimoku Cloud provides a strong foundation below, reinforcing the bullish setup. Combined with strong support, this structure suggests that ETHFI is primed for a potential upward move. Keep an eye on volume and key resistance levels as this breakout unfolds.
Disclaimer: This analysis is for informational purposes and is not financial advice. Always stay updated with market movements and adjust your trading strategies as needed.
You can DM us for information on any other coin.
@Peter_CSAdmin

ETHFIUSDTETHFI ~ 2D
#ETHFI Losing this Support Block will bring the price even lower.
The best way to trade this coin. wait until this resistance line is successfully broken and open a buy position or open a short when this support block is successfully broken.
