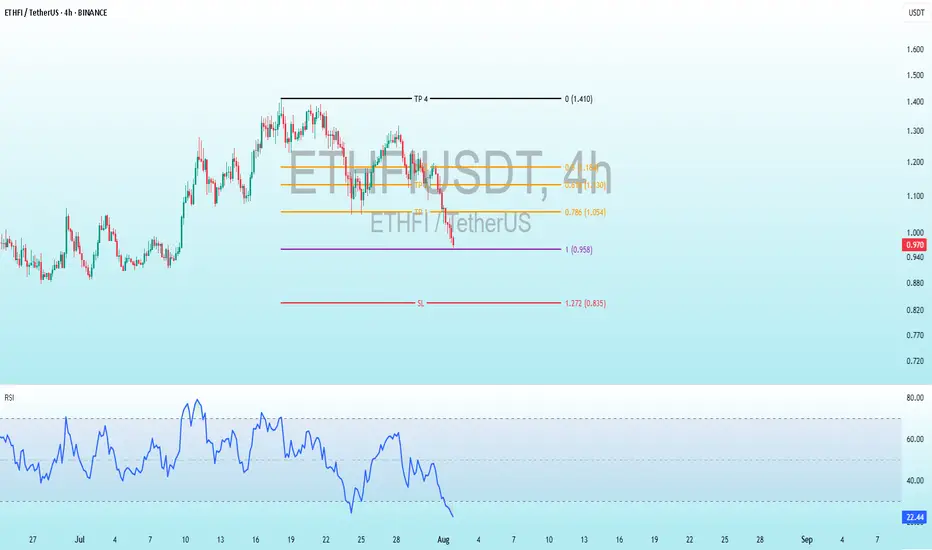
ETHFI Bullish DivergenceBINANCE:ETHFIUSDT
Trade Setup:
Target 1: 1.054 (0.786 Fibonnaci Golden Zone).
Target 2: 1.130 (0.618 Fibonnaci Golden Zone).
Target 3: 1.184 (0.786 Fibonnaci Golden Zone).
Target 4: 1.410 (0 Fibonnaci).
Stop Loss: 0.835 (1.272 Fibonnaci).
RSI Analysis: The RSI is showing a bullish divergence, suggesting potential bullish momentum. The current RSI is around 22.36, approaching oversold territory, so caution is advised.
Ethfianalysis
ETHFI Swing Buy / Long SetupWait for the entry, Must use SL, liquidation pending both sides, So wait for the one side to clear first. I'm not bearish on alts, until btc.d doesn't closes above 63%.

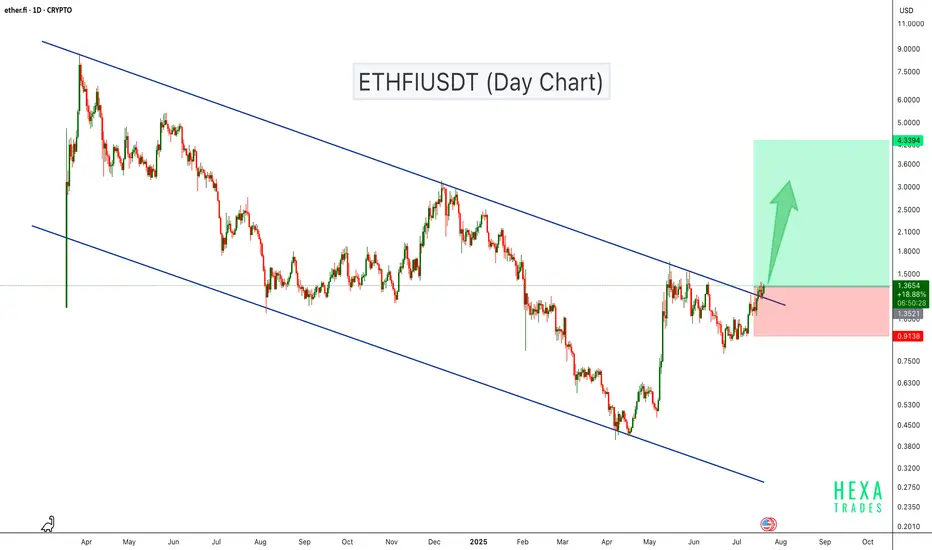
ETHFI Breaks Out of Descending Channel – Bullish Rally Ahead?ETHFI has been trading inside a descending channel for over a year, consistently respecting both resistance and support levels. Recently, the price broke above the channel resistance with strong bullish candles, suggesting a potential trend reversal.
This breakout indicates growing bullish momentum, and if the price sustains above the breakout level, we could see a move towards the $4.00–$4.70 range in the coming weeks.
Cheers
Hexa
ETHFI/USDT – BREAKOUT ALERT! Descending Trendline Under Pressure
After over a year of relentless bearish pressure, ETHFI is now approaching a critical technical juncture that could mark the beginning of a major trend reversal. The chart displays a long-term descending trendline, and bulls are now challenging it with growing strength. This setup could lead to a powerful breakout and a potential trend shift.
🧩 Technical Pattern Overview:
🔸 Descending Trendline Resistance – Established since April 2024, acting as a dominant resistance across multiple retests.
🔸 Base Accumulation – Price has formed a strong base between $0.80–$1.00, indicating declining selling pressure and potential accumulation.
🔸 Volatility Squeeze – Price action is tightening near the apex of the descending triangle, suggesting that a breakout (up or down) is imminent.
🔸 Breakout Watch – A confirmed breakout above $1.25 would be a major bullish signal.
🐂 Bullish Scenario (Confirmed Breakout):
If the price breaks and closes above $1.25 with strong volume:
🎯 Potential Upside Targets:
Target 1: $1.784 – Previous local resistance
Target 2: $2.390 – Former consolidation zone
Target 3: $2.959 – Key psychological resistance
Extended Targets: $5.024 and $7.001 if a sustained rally unfolds
Ultimate ATH: $8.660 – If the broader crypto market enters full bullish mode
💡 Catalysts to Watch: Altseason, project news, favorable macro sentiment, or exchange listings.
🐻 Bearish Scenario (Rejection at Resistance):
If ETHFI fails to break out and gets rejected at the descending trendline:
🔻 Potential Downside Levels:
$1.088 – Immediate support
$0.88 – Minor support
$0.70 – Historical support zone
$0.50 to $0.35 – Deeper bearish targets if selling resumes
⚠️ Fakeouts are common during volatile phases — always wait for confirmation with volume.
📌 Conclusion & Strategy:
ETHFI is at a make-or-break level. A confirmed breakout could trigger a strong upward rally with high risk/reward potential. However, failure to break resistance could lead to continued consolidation or even downside.
🔍 Traders should watch for a clean breakout above $1.25, preferably with high volume. Risk management is key — define your invalidation levels and stick to your plan.
🧠 Trading Recommendations:
🟢 Breakout traders: Wait for confirmation > $1.25
🟡 Accumulate: Between $0.90–$1.00
🔴 Stop-loss: Below $0.85 for conservative risk
📈 Risk/Reward after breakout: Attractive (1:3 or better)
#ETHFI #ETHFIUSDT #CryptoBreakout #DescendingTrendline #AltcoinAnalysis #TechnicalAnalysis #BreakoutTrading #CryptoSignals #BullishReversal

ETHFIUSDT Breakout Loading!CRYPTOCAP:ETHFI is consolidating within a symmetrical triangle on the 4H chart, with price tightening between descending resistance and rising support. A breakout or breakdown is likely soon. Watch for volume confirmation. Key levels to watch: $1.35 (resistance) and $1.00 (support). Breakout could lead to $1.50+, while breakdown risks a drop toward $0.95.

ETHFIUSDT 2D AnalysisETHFI ~ 2D Analysis
#ETHFI Buy after successfully breaking this resistance line with a short term target of at least 15%+ and a long term target of $8.7

ETHFIUSDT | Bearish Bias Below the Red BoxETHFIUSDT isn’t showing strength here. Price is stuck below a clear red box resistance, and as long as that holds, my bias stays short.
There’s no sign of buyer aggression. CDV remains flat, and any volume upticks have been absorbed. Unless that red box is broken and retested, I see no reason to flip bullish.
Short ideas stay valid until proven otherwise.
Let the market earn your trust — not the other way around.
📌I keep my charts clean and simple because I believe clarity leads to better decisions.
📌My approach is built on years of experience and a solid track record. I don’t claim to know it all but I’m confident in my ability to spot high-probability setups.
📌If you would like to learn how to use the heatmap, cumulative volume delta and volume footprint techniques that I use below to determine very accurate demand regions, you can send me a private message. I help anyone who wants it completely free of charge.
🔑I have a long list of my proven technique below:
🎯 ZENUSDT.P: Patience & Profitability | %230 Reaction from the Sniper Entry
🐶 DOGEUSDT.P: Next Move
🎨 RENDERUSDT.P: Opportunity of the Month
💎 ETHUSDT.P: Where to Retrace
🟢 BNBUSDT.P: Potential Surge
📊 BTC Dominance: Reaction Zone
🌊 WAVESUSDT.P: Demand Zone Potential
🟣 UNIUSDT.P: Long-Term Trade
🔵 XRPUSDT.P: Entry Zones
🔗 LINKUSDT.P: Follow The River
📈 BTCUSDT.P: Two Key Demand Zones
🟩 POLUSDT: Bullish Momentum
🌟 PENDLEUSDT.P: Where Opportunity Meets Precision
🔥 BTCUSDT.P: Liquidation of Highly Leveraged Longs
🌊 SOLUSDT.P: SOL's Dip - Your Opportunity
🐸 1000PEPEUSDT.P: Prime Bounce Zone Unlocked
🚀 ETHUSDT.P: Set to Explode - Don't Miss This Game Changer
🤖 IQUSDT: Smart Plan
⚡️ PONDUSDT: A Trade Not Taken Is Better Than a Losing One
💼 STMXUSDT: 2 Buying Areas
🐢 TURBOUSDT: Buy Zones and Buyer Presence
🌍 ICPUSDT.P: Massive Upside Potential | Check the Trade Update For Seeing Results
🟠 IDEXUSDT: Spot Buy Area | %26 Profit if You Trade with MSB
📌 USUALUSDT: Buyers Are Active + %70 Profit in Total
🌟 FORTHUSDT: Sniper Entry +%26 Reaction
🐳 QKCUSDT: Sniper Entry +%57 Reaction
📊 BTC.D: Retest of Key Area Highly Likely
📊 XNOUSDT %80 Reaction with a Simple Blue Box!
📊 BELUSDT Amazing %120 Reaction!
📊 Simple Red Box, Extraordinary Results
I stopped adding to the list because it's kinda tiring to add 5-10 charts in every move but you can check my profile and see that it goes on..

ETHFI Will Outperform Ethereum In This CycleHello, Skyrexians!
Yesterday we pointed out the great potential performance of Ethereum, but we have assets which depends on it but can perform much much better because of small cap. I personally have already bough BINANCE:ETHFIUSDT in February and March with average price $0.7, so now I have 2x, but this growth is not finished.
After listing pump this crypto retraced that much in the global wave 2 ABC shaped. Bullish/Bearish Reversal Bar Indicator has printed the first green dot only on the very bottom, as a result asset entered into bull market. The next target is 1.61 Fibonacci at $14. This is going to be wave 3 and that's all!
Best regards,
Ivan Skyrexio
___________________________________________________________
Please, boost this article and subscribe our page if you like analysis!

ETHFIUSDT 1DETHFI ~ 1D Analysis
#ETHFI The seller's pressure seems to have begun to decline. Buy after successfully penetrating this resistant line with a short -term target of at least 10%+.

ETHFIUSDT 12HETHFI ~ 12H Analysis
#ETHFI Buy gradually after successfully penetrating this resistant line with a short -term target of at least 10%+.

ETHFIUSDT 2DETHFI ~ 2D Analysis
#ETHFI In 2D Time Frame this is the accumulation support block. If you still have Conviction on this coin, buy it from here with a minimum target of 15%++

ETHFI bearish SituationBINANCE:ETHFIUSDT
ETHFI is in a bearish channel right now which means the price shall continue to decrease!
no sign of Bullish movement can be seen!😒
⚠️ Disclaimer:
This is not financial advice. Always manage your risks and trade responsibly.
👉 Follow me for daily updates,
💬 Comment and like to share your thoughts,
📌 And check the link in my bio for even more resources!
Let’s navigate the markets together—join the journey today! 💹✨

ETHERFI : The Next Chapter...?ETHERFI is currently experiencing significant resistance at the $2.50 threshold. This price point has proven to be a formidable barrier to upward movement. Meanwhile, the overall Ethereum ecosystem is witnessing an increase in trading volume, indicating heightened interest and activity among investors. Should ETHERFI manage to break through the $2.50 level and maintain a sustainable price above it, we could potentially see the onset of a bullish rally. Such a move would likely signal increased confidence in the asset and could attract further buying pressure, paving the way for more substantial gains shortly.

#ETHFI (SPOT) Entry ( 1.220- 1.620) T. (4.730) SL(.1.187)BINANCE:ETHFIUSDT
entry range ( 1.220- 1.620)
Target1 (2.405) - Target2 (3.151)- Target3 (3.830)- Target4 (4.730)
SL .1D close below (1.187)
______________________________________________________________
Golden Advices.
********************
* collect the coin slowly in the entry range.
* Please calculate your losses before the entry.
* Do not enter any trade you find it not suitable for you.
* No FOMO - No Rush , it is a long journey.
Useful Tags.
****************
My total posts
www.tradingview.com
1Million Journey
www.tradingview.com
www.tradingview.com
********************************************************************************************************************** #Manta ,#OMNI, #DYM, #AI, #IO, #XAI , #ACE #NFP #RAD #WLD #ORDI #BLUR #SUI #Voxel #AEVO #VITE #APE #RDNT #FLUX #NMR #VANRY #TRB #HBAR #DGB #XEC #ERN #ALT #IO #ACA #HIVE #ASTR #ARDR #PIXEL #LTO #AERGO #SCRT #ATA #HOOK #FLOW #KSM #HFT #MINA #DATA #SC #JOE #RDNT #IQ #CFX #BICO #CTSI #KMD #FXS #DEGO #FORTH # AST #PORTAL #CYBER #RIF #ENJ #ZIL #APT #GALA #STEEM #ONE #LINK #NTRN #COTI #RENDER #ICX #IMX #ALICE #PYR #PORTAL #GRT #GMT # IDEX #NEAR #ICP #ETH #QTUM #VET #QNT #API3 #BURGER #MOVR #SKL #BAND #ETHFI.

ETHFIUSDTETHFI ~ 2D
#ETHFI Losing this Support Block will bring the price even lower.
The best way to trade this coin. wait until this resistance line is successfully broken and open a buy position or open a short when this support block is successfully broken.

ETHFIUSDTETHFI ~ 1D ✅
#ETHFI So far this support block continues to keep prices from falling further.
✅ If you are an aggressive trader, maybe this is a good time to buy. Or if you want to play it safe. Wait until this resistance line is successfully broken, and start making purchases.

ETHFIUSDT Bullish TriangleETHFIUSDT technical analysis update
ETHFI price has formed a triangle pattern on the 4-hour chart and is moving towards a breakout at the triangle's resistance. Once the breakout is confirmed, we can expect a strong bullish move in ETHFI.
Buy zone : Below $1.51
Stop loss : $1.40
Regards
Hexa

Could #Ethfi have seen the bottom now?CRYPTOCAP:ETHFI 1D chart;
Continues to be under pressure from the falling channel and seems to have failed on its 3rd attempt (for now)
For now, because it has created a mismatch by making a rising bottom on the RSI side.
We may see positive movement after a possible recovery on the Bitcoin side.
Otherwise, $ 0.97 will be the next support level.
