ETH/USD Still 14% Before We Reach ATH!In this technical analysis I share my current views on ETH/USD. I tried to make the chart as self-explanatory as possible, but feel free to reach out or drop a comment if you have any questions.
Ethforecast

ETH will explode $550K in June 2022Based on my cyclic harmonic calculations, ETH can explode $550 K in June 2022...
This is not only because June is the month of my birth and I'm bullish on ETH, also, because ETH has this potential to gain this value...
Beside this Technical Analysis, Fundamental analysis confirms this potential...
At that time, also, ETH 2.0 will have a major progress...
Who knows? Let's wait and see the result of this idea at that time... ;)
I'll be happy and thank you if you share your thoughts and comment it below...

ETH-4h. Buyers are preparing to update the historic high!ETH investors received a nice gift over the weekend. Raising the price by almost 60% , buyers easily broke the critical range, which we wrote about in the previous idea - $800-840 .
Having set a new local high of $1162 , buyers felt resistance in the range of $1123-1156. In the 15-minute timeframe, you can clearly see how the volumes started to increase in this range and the sellers easily turned the price.
Thus, the ETH price went beyond the growth channel and is preparing for the main sale - the $1260-1350 range test . Breaking this range, ETH will update its historic high.
The critical point for this growth scenario is the $840 mark . After breaking it, sellers will quickly lower the price to $750.
our ETHBTC idea:
________________________________
We create both short-term ideas (for a local understanding of the market situation) and medium-term forecasts of price movements.
Subscribe to us and get daily concise analytics!

UPDATE 03-01-2021: - ETH Ethereum forecast (Elliott Wave)UPDATE 03-01-2021: - ETH Ethereum forecast (Elliott Wave)

ETH-6h. Buyers are ready to test $ 800-840.BTC's local weakness, after setting a new historical high, gave ETH buyers a chance to come out of the shadows.
On December 27, during the two hours of active sales of BTC at highs showed that many people want to keep the price of BTC. During the stoppage of growth in the BTC market, ETH buyers raised the price by 10% in 3 hours. The initiative of buyers continues to remain with buyers. This is how our global idea ends .
Buyers managed to go beyond the wedge. The local critical point for continued growth to the $800-840 range is the $700 mark . Below it, sellers will return ETH to the consolidation wedge and try to test the $620-630 range .
Therefore, we expect the result of the fight for the $700 mark to enter the risk-free entry into the position.
________________________________
We create both short-term ideas (for a local understanding of the market situation) and medium-term forecasts of price movements.
Subscribe to us and get daily concise analytics!

ETH is feeling a little left in the dust. This will change.Eth is pretty pissed. It wants BTC growth- and sheesh it is about to get it. Dont sleep on this one kids.
Sincerely,
SKYLOBSTER
***Not Financial advice in any way, shape, confefe, or form***
Congrats to those who caught the last BTC Signal. 4k in less than 48 hours. Simple Stacks FOR LIFE.

ETH-4h. Sellers are preparing for test $520.The struggle for the $600-615 range continues. Taking control of this range on December 17, buyers could not keep it.
Yesterday's break of the trend line , which supported buyers for more than a month, gave sellers the right to form a falling wave.
The sellers set the new local low at $550 . Now their main task is to keep the range of $600-615 . It is very difficult for buyers to restrain the price from falling. Given that all capital from altcoins goes to BTC, we do not see growth prospects in the medium term.
If you look at the ETHBTC chart , you can see that the sellers broke the annual trend line down. We offer you to find vacations that will help growth in the ETH market. We can't find them yet.
______________________
We create both short-term ideas (for a local understanding of the market situation) and medium-term forecasts of price movements.
Subscribe to us and get daily concise analytics!

ETHUSDT 1D-TIMEFRAME ANALYSIS✨ETHUSDT 1D-TIMEFRAME ANALYSIS✨
Hello ladies and gentlemen
This is my new idea for the Ethereum
My idea is that the pair will go lower
broke down the daily support sells offs start
I hope my idea is clear
Support me by like and share
Stay Safe💯
Good luck💰

UPDATE: 10/12/2020 #Ethereum (ETH) forecast on the dailyUPDATE: 10/12/2020 #Ethereum (ETH) forecast on the daily "Correction"

Skyfall ? ETH/USDT $ETH #eth #ethereum #cryptoHere we see our ETH tether chart from Binance . It appears there is a large Rising wedge pattern on this chart ( in those red lines ) from the dumpout in March . This pattern forming in an uptrend should eventually trigger a correction and break downward out of this pattern . First target downward could be the top of our Ichimoku cloud around 380 to 420 or thereabouts but this correction could continue downward - it's hard to say what is bottom right now. But correction DOES eventually come to all patterns though I know some Perma Bull don't believe it ! Also see my last idea linked below about ETH reaching it's All time high again - which I still believe is coming . But perhaps we see correction first before we get there. Let's see.
Also please search for info on Rising Wedge pattern today - there are many trading sites with free info on this pattern and its' possibilities .
Thank you !

ETH 2.0 is close. Where the price should move to $450 or $340?This idea is an updated version of our previous idea , which we will take as a basis for the near future. It's nice that she got the mark: "Tradingview Editor's Choice"
Yesterday 10/04/2020, the Ethereum 2.0 deposit contact was launched.
The release of Ethereum2.0 zero block is expected on 1 December, 2020 - it was confirmed by Vitalik Buterin.
In the last review, we wrote that the important zone is $417-425, sellers were able to keep it. Then the price lowered to the level $370.
Now, such an important zone for ETH has lowered slightly and is located in the range $410-417.
If the price cannot grow above $410-417 in the coming days, then the way to the level $340-343 will open .
If the positive news background begins to work out, then the ETH price will fix above $417 , and from there will be opened the path to $450.
_____________________
Since 2016 , we have been analyzing and trading the cryptocurrency market.
We transform our knowledge, trading moods and experience into ideas. Each " like under the idea" boosts the level of our happiness by 0.05% . If we help you to be calmer and richer - help us to be happier :)

ETH. If buyers don't keep $363, they will see $274.Consolidation in ETH has extended a lot, which increases investors' tension.
In previous ideas, we wrote about the mark $363, which served as the critical point for this coin. Buyers managed to break this point and update the local high. However, according to the volume of ETH price growth from 8 October, it seems that buyers are leaving the forces.
When BTC showed, most likely manipulative, upward impulse, then ETH in response was satisfied with weak growth on low volumes.
Such input information makes us think that the maximum that ETH is waiting for is the continuation of consolidation trend with an exit down to $274 and $251.
Cancellation of this scenario in case the price fixes above $390. But first, buyers need to show that they ready to keep $363.
____________________________
Each " like under the idea" boosts the level of our happiness by 0.05% . If we help you to be calmer and richer - help us to be happier :)

ETH. 4h. The first target is $315 with the prospect up to $295.Reasons of the fall. If you follow our ideas, you already know that globally we are waiting for ETH at $250. This scenario could only be canceled if the price fixed above the level $363. According to t he previous idea , two unsuccessful attempts of buyers to fix above this mark are clearly visible. The weakness of buyers only increased the probability of our scenario being worked out.
The cheeriness of the fall was certainly added by the news background, which we analyzed in BTC idea.
Local targets. Today attention will be focused on the level $315. In case of the level break down, the next stop is $295.
If buyers do not resist and decide to wait out and not keep the price, we will see the mark $250 much faster.
But by then we will update the idea. Therefore, like and subscribe to us to keep abreast of events and fresh ideas.

ETH 12h Critical point 425 is again under sellers' control More than a month has passed since the publication of one of our most well-aimed ETH ideas .
During this time, Ethereum was almost able to test the key level $425.
Obviously, such ETH confidence is added by DeFi projects , which are mainly based on it.
Also, according to the promises of the developers, Ethereum 2.0 can be implemented even in 2020.
What do we expect from the ETH movement?
In the coming days, it is important to follow the price behavior in the zone $418-425.
If we manage to fix above this zone, then the price is likely to go higher in the range $444-450. It's too early to talk about the targets above.
If buyers do not show their strength in the zone $418-425, sellers will be able to sharply attack down. First, to the levels $363 and $325-335.
Globally, we expect a fall to the zone $286-293.
____________________
Each " like under the idea" boosts the level of our happiness by 0.05% . If we help you to be calmer and richer - help us to be happier :)

UPDATE 25-10-2020 : - ETH Ethereum forecast (Elliott Wave)UPDATE 25-10-2020 : - ETH Ethereum forecast (Elliott Wave)

ETHUSD 1W-TIMEFRAME ANALYSIS 💡ETHUSD 1W-TIMEFRAME ANALYSIS 💡
Hello ladies and gentlemen
This is my new idea for Ethereum
My idea is that ETH will continue to downtrend
Support is between 250 and 230 It would be good to test it, and test of downtrend
The bulls defend these areas strongly
From there we will start the bull market 💪💪💪
I hope my idea is clear
Support me by like and share
Good luck💰💯

UPDATE 23-09-2020 : - ETH Ethereum forecast (Elliott Wave)UPDATE 23-09-2020 : - ETH Ethereum forecast (Elliott Wave)

ETHUSD 4H-TIMEFRAME ANALYSISETHUSD 4H-TIMEFRAME ANALYSIS
ETH broke the support at 355 with high liquidity
Now it is back to test the area that is now resistance
It needs high liquidity to overcome the resistance
My analysis is that ETH will fail
He will have to return to test the temporary resistance at 310
I will update and share other ideas with the upcoming CRYPTO MARKETS movements
Good luck

There are two scenarios a price boost up to USD 800 is expected1st Scenario :
The downtrend has ended in the range of 82.07 and the first uptrend wave ended in the range of 366.80 and the corrective movement of this uptrend ended in the range of USD 86 and the uptrend initiated in the third wave.
The main highlight is at the bottom of the chart (USD 489 range)
The structure of the price increase from USD 368 to USD 489 level was in the form of 3 waves, followed by a 5-wave decline, which indicates the Expanded Flat pattern.
Wave iv from point of 3 can be completed in the range of USD 304, we should wait for the uptrend in the 5th wave, which the target in a worst-case will be USD 600 and can be extended up to USD 800 level.
2nd Scenario:
If we consider, the 2-year corrective earnings of the range of USD 86, as a completed movement. By counting the increasing price trend of USD 368 to USD 489 in a 5 waves format.
In this case, the first uptrend is over, and the price is in a corrective uptrend movement, which due to the first 5 wave fall (wave A), we are expecting further price reductions in the range of 238 to 170 dollars. This range is a very important area, in addition to the Fibonacci ratios, it is overlapping to the downward trend line which has been broken.
Conclusion
The basis of my movement strategy is as follows:
According to the both analyzes; the advent of the uptrend is not doubtful. But there is a scenario of further decline.
It is highly recommended to enter long positions, by managing the % 50 of risk and reward logics, in the range of USD 350. In case of further decline up to the range of USD 238, the rest of the positions can be set.
Ethereum targets are very high, traders must go long in the fall of the price action.
In my opinion, the area of 120 to 130 dollars is a very important price range, and if the price exceeds this range, probably ..............! I hope this never happen...

ETH - Interesting imminent movement ahead.In the next few hours we could see some more action in the price than what we have had throughout this beginning of August where the price has been oscillating between lows of $ 350 and reaching over $ 400 on a couple of occasions.
If the triangle formation is fulfilled, we could see another impulse in ETH that would oscillate around $ 500, giving us a continuation to the new bullish rally that apparently is in play and that where now in view of 1h we can almost see that the moving averages 100 and 200 are almost very close. This point is a Fibonacci pivot between the $ 625 mark to watch for future long entries.
In the event that the price corrects (in daily view it is still oversold) the first levels to consider would be $ 350 and around $ 325, which would allow us a lower price action to increase the purchase while waiting for a better signal. Also in a 4h view we can see that the RSI is descending although this does not mean anything yet about the direction it will take.
What is your opinion?
Thanks for supporting this idea.

Bull Market till $1000 - ETH Ethereum forecast (Elliott Wave)Bull Market till $1000 - ETH Ethereum forecast (Elliott Wave)

ETHUSD - Bullish, 377 next levelIf there are no sudden drops for bitcoin price, ETHUSD will continue its way first to $377, and then to $400+ levels.
Some sort of pullback is possible, I'd watch $322 in this case. But given the strength of the movement not sure if this will happen.
Hit the "LIKE" button and follow to support, thank you!
Information is just for educational purposes, never financial advice. Always do your own research.

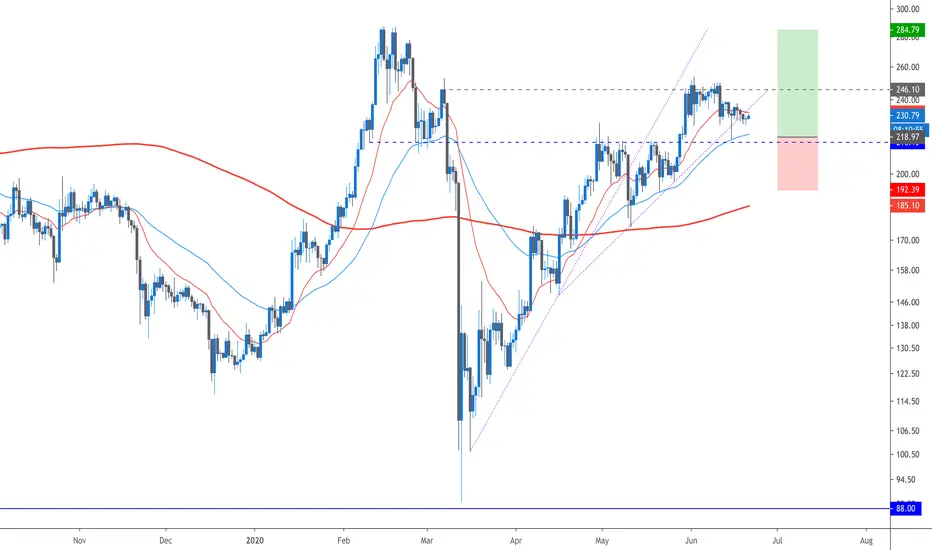
ETHUSD D1 LONG PRICE ACTION FORECAST So far, Ethereum is one of the leading cryptos that its price action is trading above the 50 EMA and 200MA, fro a definition of an uptrend bias from the book.
However, price is under some seller pressure where the correction can take the price to test back the 50EMA in confluence with the support level as a secure zone for demand where bulls are lining up, and this retest could bring the ETH to above de 280$ handle.
The order:
Type: buy-limit
S/L: 265 pips - R:R | 1:2.5 -
T/P: aiming towards the resistance from previous high