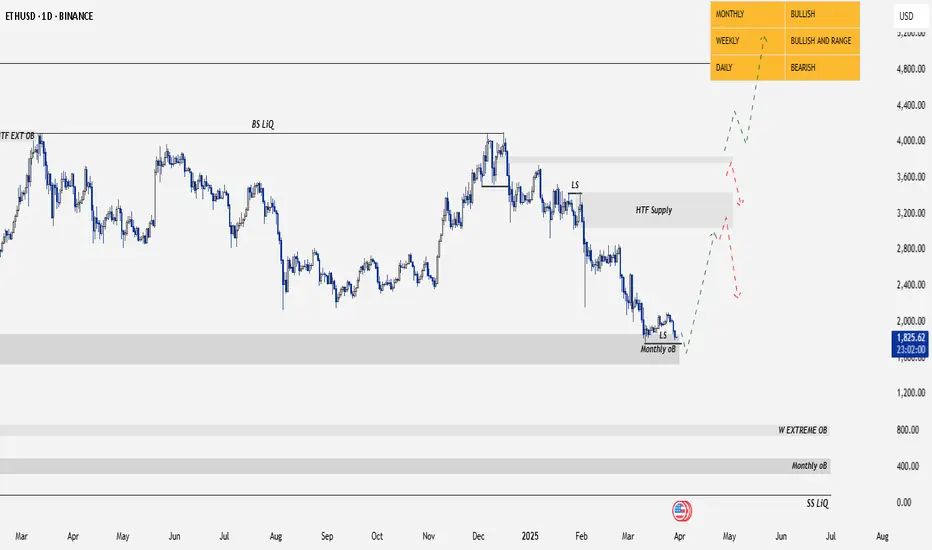
ETH/USDT | Potential Trend Reversal from Monthly Demand Zone📉 Market Overview:
ETH/USDT is currently holding within a strong monthly demand zone, showing signs of possible accumulation. Price has tested this level and indicating a potential reaction.
🔍 Key Trading Conditions:
✅ Liquidity Sweep: If price sweeps the daily previous low, this could be a liquidity grab to trap sellers.
✅ Market Structure Shift (MSS): If price breaks a key lower high to the upside, it would confirm a short term bullish structure shift, signaling a potential trend reversal.
📊 Trade Plan:
🎯 Bullish Confirmation: Wait for a clear MSS to the upside on lower timeframes (4H/1H).
🔹 Entry: After a successful daily low sweep & bullish confirmation.
🔹 SL: Below the liquidity sweep low.
🔹 TP1: Mid-range supply zone.
🔹 TP2: Previous structural highs.
🚨 Risk Management:
Always wait for confirmation before entering.
Monitor price action around key levels.
Manage risk with proper stop-loss placement.
📌 Conclusion:
If ETH sweeps liquidity and shifts structure bullishly, we can expect a potential reversal. Stay patient and let price confirm the move!
📈 Like & Follow for More Market Updates! 🚀
Ethforecast
Possible buy on ethereumPrice retesting the liquidity void formed by the gap expecting price to continue with uptrend with final targets at 3262
ETH/USDT BUYHello friends
Given the price support, we can buy at two levels that we have specified for you.
The price targets have also been specified...
Please observe capital management.
*Trade safely with us*

Ethereum at the Crossroads: Breakdown or Breakout?Ethereum has seen a steep 60% drop from its highs, but recent activity suggests it might be entering a key transition phase. I’ve entered a long position here with a wide target in place, waiting for clear signs of bullish momentum before adding more size.
Technically, ETH is holding above a strong low on the daily and attempting to reclaim territory beneath a descending trendline. The market has been compressing tightly, and we could soon see expansion either direction. If this is indeed a base forming, it offers a great R:R.
The invalidation lies below the $1,500 daily close—anything below that negates the idea of a shift and brings the $1,000 psychological level into focus. Until then, I treat this as a potential bottom formation trade.
Technicals
• Downtrend structure: ETH has been in a macro downtrend but is showing early signs of compression and possible trend reversal.
• Descending trendline resistance in play. A daily close above it would be significant.
• 2000–2100 remains a psychological resistance zone.
• RSI & Stoch below neutral, indicating room to move up if pressure builds.
• Invalidation below $1,500 (daily close).
Fundamentals
• Massive accumulation: Over 2.11M ETH added to accumulation addresses in March alone.
• Supply squeeze: ETH on exchanges dropped to a 10-year low, down 16.4% from 7 weeks ago.
• Open interest rising: Futures market open interest climbed from 9.40M to 10.10M ETH in just three days—showing derivative trader confidence.
• Ethereum Pectra upgrade scheduled, promising long-term improvements in staking, fees, and transaction management.
• If bullish catalysts align, this accumulation phase could spark a breakout move back toward $2,800–3,000 in Q2.
Note: Please remember to adjust this trade idea according to your individual trading conditions, including position size, broker-specific price variations, and any relevant external factors. Every trader’s situation is unique, so it’s crucial to tailor your approach to your own risk tolerance and market environment.

ETHUSDT 📉 ETHUSDT Trade Signal 📈
🔥 Long Entry: $1,990
🎯 Targets:
✅ 1️⃣ $2,277
✅ 2️⃣ $2,507
✅ 3️⃣ $2,818
🛑 Stop Loss: $1,774
⚡ Breakout Watch: Wait for confirmation above $1,990 before entering! 🚀

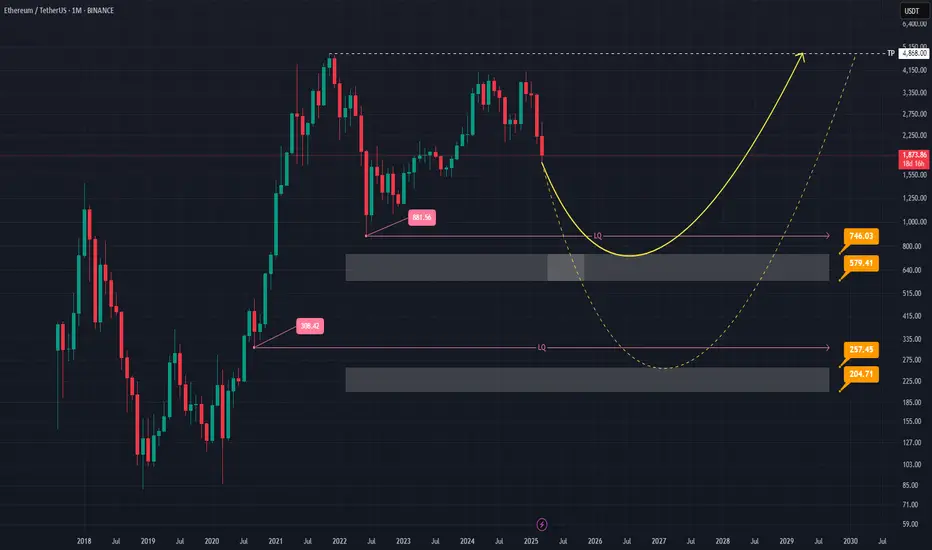
Ethereum: Rebound from here or Drop to $881?Hey everyone! Let’s explore what’s happening on Ethereum’s monthly chart. Right now, there seem to be two main possibilities to keep in mind. The first and more likely scenario involves a dip toward the lower price zones—around 881.56—and then testing important supports near 579.41 and 756.03. Observations suggest that if the price heads down to these areas, there could be a bounce, though a deeper move is possible (even if it seems less likely). On the flip side, if the price climbs from its current level toward its previous peak, we’d want to revisit this analysis for updates.
Key price zones are highlighted on the chart, showing where a lot of buying or selling could happen. A change in trend would typically be confirmed by a clear candlestick pattern and solid trading volume, so those are worth watching. As with any market, unexpected moves can always occur, so it’s good to stay prepared and flexible.
Remember, these are just observations based on the monthly chart, and personal research is always important. Stay curious, stay safe, and never hesitate to dig deeper into your own analysis before making any decisions. Good luck out there! 💼📈
Ethereum at Critical Levels – Breakout or Breakdown for ETH?Ethereum (ETH) is looking heavily overextended right now 📊, with price action pressing into key support zones on the daily and weekly charts ⏳. The market is at a critical juncture, and a sharp pullback 📉 could be on the cards.
This could present a short-term counter-trend buying opportunity on the lower timeframes 💰, but if ETH pushes higher, it may offer a prime short setup 🎯.
⚠️ Not financial advice – trade smart and manage risk accordingly! 🚀

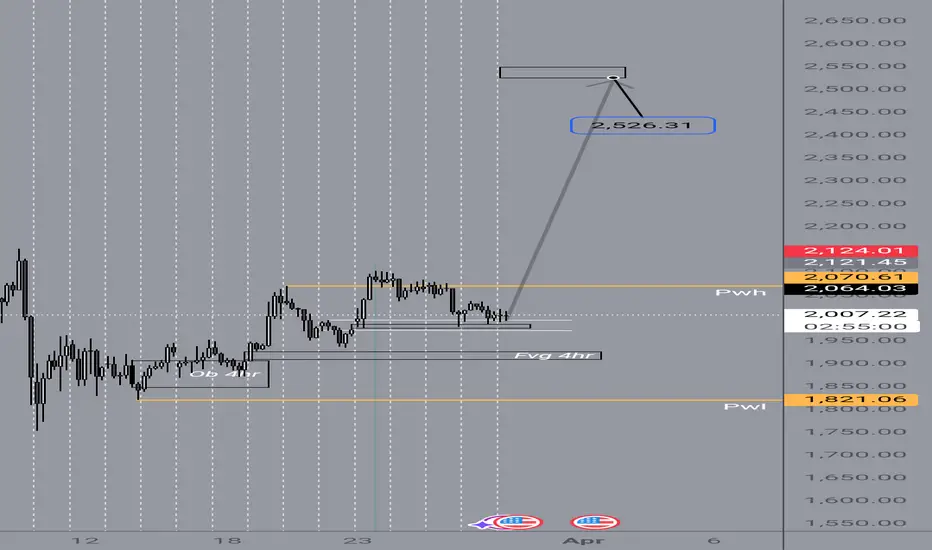
Ethereum at Key Support Zone: Is a Counter-Trend Setting Up?Ethereum (ETH) is currently in a strong bearish trend 📉, but it has traded into a key support zone 🛑 and seems overextended, in my opinion. Looking at the price action and market structure on the daily and four-hour timeframes, we’re now seeing Ethereum form higher highs and higher lows on the four-hour chart 📊. While it’s still early, if we see a break above the current range high on the four-hour timeframe, there could be an opportunity for a counter-trend trade 🔄, targeting equilibrium ⚖️ and a previous imbalance highlighted in the video. As always, this is for educational purposes only and should not be taken as financial advice 💡.

Whales ACCUMULATING ETH 🚨MartyBoots here , I have been trading for 17 years and sharing my thoughts on ETH here.🚨
.
🚨 COINBASE:ETHUSD is looking beautiful , very interesting chart for more upside
and is now into support🚨
Here is a link to Trading View news section showing whales accumulating COINBASE:ETHUSD
Do not miss out on COINBASE:ETHUSD as this is a great opportunity
Watch video for more details

Where is Ethereum going from here?Where Is Ethereum Headed Next?
Ethereum’s price action has been holding firm within a key support zone, demonstrating resilience despite broader market uncertainties.
However, a break below this critical support level—which aligns with the top ascending trendline—could signal further downside potential.
Technical Outlook:
If macroeconomic and fundamental pressures continue to weigh on the crypto market, Ethereum may lose its current support, potentially leading to a decline toward $2,500 and possibly even $2,200.
From an investment perspective, I plan to accumulate ETH gradually using a dollar-cost averaging (DCA) strategy around the $2,200 zone. A further drop to $1,500 would present a significant long-term buying opportunity at a discounted level.
What are your thoughts on ETH’s next move?
Let’s discuss—feel free to share your insights, like, and follow for more updates!

Ethereum Market OverviewThis analysis builds upon the previous technical outlook, identifying three key patterns on Ethereum’s daily timeframe:
1. Ascending Channel
Ethereum has been trading within a well-established ascending channel since 2018. Each time a new all-time high (ATH) is reached, price consistently tests the channel’s resistance, while the major support level was formed on March 23, 2020, creating a strong demand zone that remains intact.
Currently, ETH has reached the lower boundary of this channel at $2,128, a key support level. If a bullish reversal occurs, the next upside target aligns with the ascending channel resistance at $8,463.
2. Symmetrical Triangle
A symmetrical triangle pattern has been forming since March 23, 2020, with its support level coinciding with the lower boundary of the ascending channel. A confirmed breakout above $3,600 would validate this pattern, triggering a bullish AB=CD extension, with a price projection towards $8,463.
3. Fibonacci Retracement
Currently, ETH is testing the 0.618 Fibonacci retracement level, a critical zone for potential trend reversals. If this level holds against bearish pressure, the next bullish projection aligns with the 1.618 Fibonacci extension at $5,319.
Breakdown Risk & Buyback Strategy
If the current support level fails, ETH could see a maximum downside correction of -26%, targeting $1,600. This level presents a high-probability buyback opportunity, offering a potential +437% upside, should Ethereum rally towards its extended price projection at $8,463.
This analysis underscores the importance of risk management and technical confirmation signals before executing any trades.

ETH Is Always "Dead" On Support MartyBoots here , I have been trading for 17 years and sharing my thoughts on ETH here.
ETH is looking beautiful , very strong chart for more upside if this support can hold
Do not miss out on ETH as this is a great opportunity
Watch video for more details

Ethereum (ETH): Bullish momentumEthereum (ETH): Gaining Strength as BTC Flows Shift
Ethereum is entering a key momentum shift, signaling the beginning of a bullish cycle as it starts absorbing liquidity from Bitcoin. Over the past seven days, BTC has seen a -1% decline, while ETH has gained +3.8%, indicating a potential rotation of capital into ETH.
This shift marks the start of Ethereum's next breakout phase, as it prepares to challenge the critical $4,400 resistance from May 2021. Successfully breaking this level could pave the way for a new all-time high, with a long-term target of $6,600 by the end of 2025.
Key Levels to Watch
Short-Term Target: $4,400 – Breaking this level confirms Ethereum’s strength.
Mid-Term Resistance: $5,200–$5,500 – A breakout above this range would accelerate the bullish scenario.
Long-Term Target: $6,600 by late 2025, fueled by capital inflows and increasing ETH dominance.
Conclusion: ETH Entering a Bullish Phase
Ethereum is showing early signs of strength, with capital rotation from BTC supporting a potential major breakout. The next critical step is breaking $4,400, which could open the path toward a new all-time high and a long-term bull run toward $6,600. The market is now shifting, and ETH is positioning itself as a dominant player in the next phase of the bull market.

Ethereum’s Accumulation Phase Ends – What’s Next?Ethereum has successfully broken above the accumulation zone, indicating a potential bullish continuation. The price is now approaching a critical descending trendline resistance (blue line), where a breakout could trigger further upside momentum.
Key Observations:
Breakout from Accumulation: The price has cleared a consolidation phase, suggesting renewed buying interest.
Next Resistance (Green Box): The immediate hurdle is the descending trendline resistance within the green box. A breakout and successful retest of this level could push the price toward the next major resistance.

ETH 6500 new ATH and back to 3600I am waiting to finishing range for ETH and see new ATH 6500 and drop about 3500 3600 lets see what happen

ETH will breakout trend line ETC/BTC LONG if you watch my ideas 2 years ago you will buy Eth for HODL.

Ethereum to $10,000-$15,000?My CRYPTOCAP:ETH Analysis:
1. ETH has not been the spotlight this cycle, SOL has.
2. Memecoins outperform on SOL due to low fees.
3. Therefore, I don't think ETH will run massively.
4. However, $10k is likely with $15k being another potential top.
5. ETH needs to break the range at EUROTLX:4K to pump.
Note: I am not predicting the times it will pump & exact top, it is just my analysis.

LONG ON ETHUSD (ETHEREUM)Price for Ethereum on the weekly broke structure to the downside creating a new low.
Since then price has been slowly but surely creating uptrend structure to go back up to the area it broke and potentially higher.
I will be buying eth and hold it until next Sunday.

ETHUSDT Buy 📢 ETHUSDT Buy Signal 📢
🟢 Buy: After a pullback to the trendline ✅
🔹 Entry Level: 2,663.53 USDT
🔹 Target 1: 2,973.46 USDT 🎯
🔹 Target 2: 3,368.06 USDT 🚀
🔻 Stop Loss: 2,434.30 USDT ⛔
⚠ Risk management is essential! 📊
💡 Analysis is based on the breakout of the downtrend line and a potential bullish move.

Scenario on ETHUSD 12.2.2025With Eth, I have a scenario such that if I should take a long position, then the first at the first sfp on the chart, which is placed in the price session around 2445, if the market breaks through this level, then the next level at which one could consider going long is somewhere around 1980, if I should consider a short, then the first acceptable price level for entry is 3500, if the market breaks through, then somewhere around 3900-4000

ETH Long Setup: Catching the Rebound After a 51% DropEthereum has pulled back significantly, experiencing a sharp 51% decline from its recent high. This steep correction presents a solid opportunity to go long. Currently, ETH is sitting at a critical support level, making it an ideal entry point for a potential recovery.
Trade Setup:
• Entry: Market price after the 51% drop
• Target: $4,400
• Stop Loss: $2,200
• Risk-to-Reward: Favorable for swing traders looking to capitalize on a medium-term rebound.
Fundamental Catalysts:
• Regulatory Optimism: The US is adopting a constructive approach to crypto regulations, reducing uncertainty in the market.
• Global Adoption: Big moves like El Salvador adopting Bitcoin as legal tender signal broader crypto acceptance.
• Institutional Inflow: With the potential approval of a Bitcoin ETF and traditional finance embracing blockchain, institutional demand is set to rise.
• Macroeconomic Boost: Fewer rate hikes from the Fed, coupled with inflation hedging narratives, create a bullish backdrop for digital assets.
ETH’s technical setup aligns perfectly with the current bullish fundamentals. This is more than just a technical bounce—it’s a chance to ride the next wave of crypto growth. Risk is managed with a tight SL, and the upside potential is compelling.
Note: Please remember to adjust this trade idea according to your individual trading conditions, including position size, broker-specific price variations, and any relevant external factors. Every trader’s situation is unique, so it’s crucial to tailor your approach to your own risk tolerance and market environment.

Ethereum’s Falling Wedge A Massive Breakout on the Horizon ?Ethereum (ETH/USDT) 4H Chart Analysis Falling Wedge Breakout Potential
Technical Breakdown
The 4-hour timeframe for ETH/USDT indicates a falling wedge pattern, a typically bullish structure that suggests a potential upside breakout.
Price recently hit $3,200, currently consolidating within the wedge formation.
The wedge pattern consists of lower highs and lower lows, compressing price action into a tightening range, which increases the probability of a breakout.
A breakout above the upper trendline could trigger a strong bullish move, confirming buyers stepping in.
Key Levels to Watch
Breakout Confirmation
A 4H candle close above the wedge trendline is crucial to confirm a bullish breakout.
Immediate Resistance
$3,500 This level might act as the first resistance after a breakout.
Support Zone
$2,750 - $2,700 – If price faces rejection, this zone could serve as strong support before another attempt to break higher.
Trading Strategy
Long Entry
Wait for a 4H candle close above the wedge trendline to confirm the breakout.
Stop Loss
Below $2,900 (recent swing low) to manage risk in case of a false breakout.
Targets
First Target $3,500 (psychological and technical resistance)
Second Target $3,900 (major resistance from previous price action)
Third Target $4,300+ (bullish continuation if momentum sustains)
ETH is at a critical inflection point, and a breakout above the wedge could lead to a significant bullish move. Keep an eye on price action, volume, and confirmation signals before entering any trades.

ETH - D1 Chartif analyzing based solely on time and location, then if ethereum is able to sustain and hold its valuation above approx $2K, then there is potential for a measured move to play out with a conservative target at approx 15K. If there is a tail whip blow off top, then the measurement can exceed higher based on fib expansion towards approx 28-33K. if hypothetically the set up plays out but the calculated measurement is not fulfillable, then i would look for invalidations at 50% extension ratios at approx 6-7K. if able to complete entire measurements i would anticipate the target should be hit aggressively in Q2 2025 around the month of March/April and conservatively in Q4 2025 around the month of October/November.
(observations: currently there is a lot of negative sentiment surrounding the recent event of the ethereum etf launch, as well as capitulation, if not already evident from the chart, from market participants who no longer believe it has exponential potential regardless of institutional inflows.)
