#ETH/USDT 2HOUR UPDATE !!Hello dear traders, we here new so we ask you to support our ideas with your LIKE and COMMENT, also be free to ask any question in the comments, and we will try to answer for all, thank you, guys.
ETH UPDATE:)
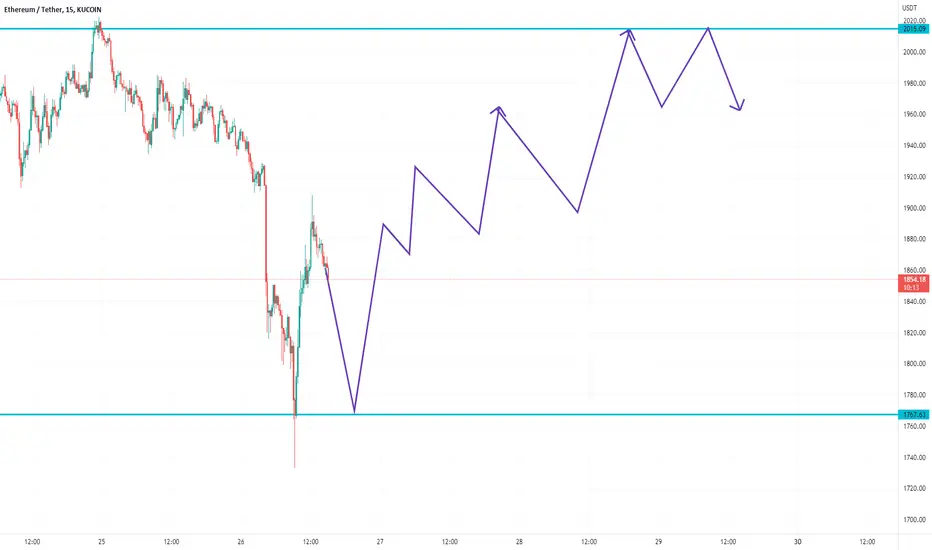
ETH completed inverse head and shoulders and broke upside its inverse H&S on the upper side Right now ETH has been 2 hours update retest 50MA and pump ETH almost 30% to 40% from here
Remember:-This is not a piece of financial advice. All investment made by me is at my own risk and I am held responsible for my own profit and losses. So, do your own research before investing in this trade.
Thanks for your time, we hope our work is good for you, and you are satisfied, we wish you a good day and big profits.
THANK YOU.
Ethforecast

$7000 or $15000 per ETH this year! What does it take?We continue to do reviews of the trading pairs you voted for in our BTCUSD price forecast
As it turned out, we haven't made an idea about ETHUSDT for more than half a year, but why? Because the previous idea ETHUSD working out exactly, until recently, having passed 3/4 of the planned way up, see for yourself:
Today's Ethereum price forecast turned out to be very optimistic, with a spoonful of tar at the end.
Since this is a global view of the ETHUSDT price chart, today we will highlight the main and critical levels to start a strong up or down trend.
In order to start a strong up trend, ETH buyers need to firmly anchor the price above $3200 in the coming days or weeks. At the same time, it is desirable not to release the price below $2550.
If these conditions are met, it may open the way for the so far exorbitant targets of $6900 and $14800 for ETH.
Optimism and belief in the bright future will completely disappear from ETHUSD market participants if the ETH price goes under $1750, which is the last critical level for buyers.
And below that there is nothing and the possibility of ETH price going down to $600-800
Maybe, our chart is not easy to read, but if you look carefully, you will find some tips that can help you in a critical moment.
And we are always open to reasoned discussion, so Go to comments!)
_______________________________
Since 2016 , we have been analyzing and trading the cryptocurrency market.
We transform our knowledge, trading moods and experience into ideas. Each "like under the idea" boosts the level of our happiness by 0.05%. If we help you to be calmer and richer — help us to be happier :)

#ETH/USDT 2HOUR UPDATE !!Hello dear traders, we here new so we ask you to support our ideas with your LIKE and COMMENT, also be free to ask any question in the comments, and we will try to answer for all, thank you, guys.
#ETH UPDATE:)
#ETH/USDT is forming an Inverted Head & Shoulder Pattern in the 2H timeframe..!!
right Shoulder is Not Completed Yet..🤞
Remember:-This is not a piece of financial advice. All investment made by me is at my own risk and I am held responsible for my own profit and losses. So, do your own research before investing in this trade.
Thanks for your time, we hope our work is good for you, and you are satisfied, we wish you a good day and big profits.
THANK YOU.


#ETH/USDT 1HOUR UPDATE !!Hello dear traders, we here new so we ask you to support our ideas with your LIKE and COMMENT, also be free to ask any question in the comments, and we will try to answer for all, thank you, guys.
#ETH UPDATE:)
ETH/USDT inverse head and shoulders create an upper side break and eth 35%pump and eth downside break and chart is invalid
Remember:-This is not a piece of financial advice. All investment made by me is at my own risk and I am held responsible for my own profit and losses. So, do your own research before investing in this trade.
Thanks for your time, we hope our work is good for you, and you are satisfied, we wish you a good day and big profits.
THANK YOU.

ETHERIUM BIG DUMP EXPECTEDTechnical Analysis Summary
ETH/USDT
TREND ANALYSIS
We have 2 Downtrend in red color (Internal and Long Term).
Be careful trends need to be modified when broken to the new peaks(Downtrend) and lows (Uptrend).
FUTURE PREDICTIONS
We have many resistance and support levels that I have mentioned above.
I use thickness as an indicator of strength of levels (ONLY FOR VISUALS).
White levels Levels are levels from my past ideas published or levels that were respected from the past.
IF THE LAST 1H SUPPORT BROKEN EXPECT BIG DUMP
Good luck everyone, stay safe!
If you need help don't hesitate to send me a message or comment
If you find this content beneficial please don't forget to LIKE and FOLLOW
Trading Involves High Risk
Not Financial Advice
Exercise Proper Risk Management

#ETH/USDT 1HOUR UPDATE !!Hello dear traders, we here new so we ask you to support our ideas with your LIKE and COMMENT, also be free to ask any question in the comments, and we will try to answer for all, thank you, guys.
As we can see in the above-mentioned chart that ETH is currently trading inside the parallel channel and also following the lower mid-trend line as support.
Currently, ETH is moving upside and trading just below the upper trend line.
Now, if ETH breaks above, it can trade above and move upside towards the price level of $1300.
Rejection from this level will lead ETH again towards its lowest price, which can be $900.
MACD also printed a bullish cross-over.
Let’s see how ETH performs in the upcoming hours.
Remember:-This is not a piece of financial advice. All investment made by me is at my own risk and I am held responsible for my own profit and losses. So, do your own research before investing in this trade.
Thanks for your time, we hope our work is good for you, and you are satisfied, we wish you a good day and big profits.
THANK YOU.

ETHERIUM 4HOURLY NEAR FUTURE ANALYSISTechnical Analysis Summary
ETH/USDT
TREND ANALYSIS
We have 2 Downtrend in red color (Internal and Long Term).
We have 1 Uptrend in green color (Internal Trend)
Be careful trends need to be modified when broken to the new peaks(Downtrend) and lows (Uptrend).
FUTURE PREDICTIONS
We have many resistance and support levels that I have mentioned above.
I use thickness as an indicator of strength of levels (ONLY FOR VISUALS).
White levels Levels are levels from my past ideas published or levels that were respected from the past.
Good luck everyone, stay safe!
If you need help don't hesitate to send me a message or comment
If you find this content beneficial please don't forget to LIKE and FOLLOW
Trading Involves High Risk
Not Financial Advice
Exercise Proper Risk Management

#ETH/USDT 4Hr UPDATE !Hello, dear traders welcome you to this ETH/USDT 4Hr chart analysis.
Hello dear traders, we here new so we ask you to support our ideas with your LIKE and COMMENT, also be free to ask any question in the comments, and we will try to answer for all, thank you, guys.
Ethereum trades in a triangle pattern to create and buy the green zone and small stop loss.
Remember:-This is not a piece of financial advice. All investment made by me is at my own risk and I am held responsible for my own profit and losses. So, do your own research before investing in this trade.
Thanks for your time, we hope our work is good for you, and you are satisfied, we wish you a good day and big profits.
THANK YOU.

#ETH/USDT 4Hr UPDATE !Hello, dear traders welcome you to this ETH/USDT 4Hr chart analysis.
Hello dear traders, we here new so we ask you to support our ideas with your LIKE and COMMENT, also be free to ask any question in the comments, and we will try to answer for all, thank you, guys.
Ethereum is trading below the liquidity level in the support area.
The price is testing the light green zone and the 4hr time frame.
The decline occurred on a rise in volume and a correction when volume fell.
I expect the price to test the upper limit of the channel.
Remember:-This is not a piece of financial advice. All investment made by me is at my own risk and I am held responsible for my own profit and losses. So, do your own research before investing in this trade.
Thanks for your time, we hope our work is good for you, and you are satisfied, we wish you a good day and big profits.
THANK YOU.

#ETH/USDT 6Hr UPDATE BY CRYPTOSANDERS!!Hello, dear traders welcome to this ETH/USDT chart analysis.
Hello dear traders, we are new here so we ask you to support your ideas with your LIKE and COMMENT, feel free to ask any questions in the comments, and we will try to answer for all, thanks, Friends.
#ETH/USDT analysis:- As we can see in the above-mentioned chart that ETH is trading inside a parole Chanel and broke the mid dotted trend line support.
Now here I am expecting a drop till the lower trend line support this channel pattern.
A candle that closes below the lower trend line will change the market sentiment.
Remember:- This is not a piece of financial advice. All investments made by me are at my own risk and I am held responsible for my profits and losses. So, do your own research before investing in this trade.
Thank you for your time, we hope that our work is good for you, and you are satisfied, we wish you a good day and big profits.
Thanks.

ETH Analysis - Trade Setup & Target Levels!Hello Traders, here is my analysis for ETHUSD.
To start, if you follow my posts you may notice that the TA for ETH looks somewhat similar to BTC... However there is one major difference.
- BTC is currently trading within the "Parallel Channel" while ETH broke below and has yet to break above it's "Parallel Channel".
- The reason this matters is because this mean ETH will have an extra level of resistance to break through than BTC.
- We will have to keep an eye on this, aside from that the price action and TA will be similar, but it's important to take note of that.
Price Action Summary
- ETH looks short term Bullish, following BTC after the massive green daily candle yesterday. Today price is consolidating and is holding support. The probabilities favor further upside continuation in the short term.
Target Levels
- As you can see ETH has many levels of resistance to contend with, despite that ETH should still be able to make some decent gains when BTC rallies.
- Once ETH breaks above the Parallel Channel, buyer's will be more enthusiastic and ETH should reach "Take Profit #1 & Take Profit #2"
- The probabilities favor ETH reaching at least $2,300 by the end of it's rally.
- Beyond that the next levels are at $2,500 and $2,600. There is a much lower probability that ETH reaches the last 2 "Take Profit" levels.
***Enter a long below $2,000. Any higher and the risks are to high for a swing trade.
- I will be taking 1/2 profits at TP#1 and the other 1/2 at TP#2.
Invalidation
- If ETH drops and confirms below $1,700 then this swing trade setup is invalidated. If ETH confirms below $1,700 then I would expect further downside continuation beyond that point.
***Also if ETH was to drop below $1,700 that would mean BTC broke below the its "Parallel Channel" and would be highly Bearish for BTC and the majority of Crypto's would dump.
**Note on taking profits in a Bear Market**
- We are in a Bear Market... you trade a Bear and Bull market differently. In a Bull Market it might make sense to wait till "Take Profit #4" to be hit before taking profits, however in a Bear Market we know that at some point the Rally will end and price will continue lower. We have to be reasonable with our take profit levels and not get to greedy. So even if I was to think that ETH could easily hit "Take Profit #3" for example, I would still close the trade at "Take Profit #2" to lock in profits. Otherwise if you were to hold out for too long you could be in a situation where price drops sharply down and continues lower while you are still holding out in hopes that it goes back up. That is a losing mentality and will get you in trouble in trading.
Thanks everyone and best of luck trading!

#ETH/USDT WEEKLY UPDATE !!Hello dear traders welcome to this ETH/USDT weekly chart analysis.
Hello dear traders, we are new here so we ask you to support your ideas with your LIKE and COMMENT, feel free to ask any questions in the comments, and we will try to answer for all, thanks Friends.
#ETH/USDT analysis
As we can see from the chart above, the ETH/USDT weekly candle closed at a price level of $1813.
After the weekly close, ETH pumped out around 7.77% of the closing price.
Here we can also see that ETH is printing a bullish divergence and a good amount of bars, so here we can expect the next weekly close above 0f $2025.
Candle below the current weekly close would invalidate this chart
Remember:- This is not a financial advice. All investments made by me are at my own risk and I am held responsible for my profits and losses. So, do your own research before investing in this trade.
Thank you for your time, we hope that our work is good for you, and you are satisfied, we wish you a good day and big profits.
Thanks.

#ETH/USDT 4HOUR UPDATE !Hello, dear traders welcome you to this ETH/USDT 4Hr chart analysis.
Hello dear traders, we here new so we ask you to support our ideas with your LIKE and COMMENT, also be free to ask any question in the comments, and we will try to answer for all, thank you, guys.
ETH/USDT ANALYSIS:-
ETH currently holding the green support zone well for the last few days, ETH needs to close above the price level of $1.9k otherwise it will change the market sentiment in the lower time frame.
candle close below the green support zone will lead ETH down towards the price level of $1.4k.
At this market condition, we should wait and avoid long trades otherwise it can be harmful to your assets.
Remember:-This is not a piece of financial advice. All investment made by me is at my own risk and I am held responsible for my own profit and losses. So, do your own research before investing in this trade.
Thanks for your time, we hope our work is good for you, and you are satisfied, we wish you a good day and big profits.
THANK YOU.

#ETH/USDT 4Hr UPDATE !Hello, dear traders welcome you to this ETH/USDT 4Hr chart analysis.
Hello dear traders, we here new so we ask you to support our ideas with your LIKE and COMMENT, also be free to ask any question in the comments, and we will try to answer for all, thank you, guys.
Ethereum is trading below the support area.
eth/usdt is testing the 4-hour time frame.
The amount of decline increased.
I expect the price to test the upper boundary of the channel.
Remember:-This is not a piece of financial advice. All investment made by me is at my own risk and I am held responsible for my own profit and losses. So, do your own research before investing in this trade.
Thanks for your time, we hope our work is good for you, and you are satisfied, we wish you a good day and big profits.
THANK YOU.

ETH PRICE POJECTION TILL SUNDAYHere's my price projection till Sunday 29 of may.
Don't hesitate to subscribe to follow my next projections.
-Frank
#ETH/USDT 2DAY UPDATE BY CRYPTOSANDERS !Hello, members and welcome to this ETH/USDT quick chart analysis.
As I mentioned in my previous chart that is Nothing much change to see at this daily time frame ETH is still trading above the support zone which is $1958 and the support zone is $1800 and the 1st resistance label is $2470
This is not a piece of financial advice.
Then, hit the like button and share your chart in the comment section if you like it.
thank you.

#ETH/USDT DAILY UPDATE !!Hello members and welcome to this ETH/USDT Quick Chart Analysis.
Nothing much has changed yet in this daily time frame.
As we can see ash the above-mentioned chart that ETH/USDT still trading still inside and at a lower trend line in support of descending channel pattern.
Here, we can see ETH bounced right from the lower trend line support and FIB LEVEL of 0.618 and bounced for 4 consecutive days.
This is not a piece of financial advice.
Then, hit the like button and share your chart in the comments section if you like it.
Thanks.

#ETH/USDT DAILY UPDATE !!Hello members and welcome to this ETH/USDT Quick Chart Analysis.
s I mentioned in my previous chart that there is not much change to watch on this daily time frame Fib Retracement Label support area is $1900 sa bounce huaa and first resistance label is $2450 and is currently trending at $2028
This is not a piece of financial advice.
Then, hit the like button and share your chart in the comments section if you like it.
Thanks.

#ETH/USDT DAILY UPDATE !!Hello, members and welcome to this ETH/USDT quick chart analysis.
s I mentioned in my previous chart there is not much change to watch on this daily time frame, ETH is still trading above the support area which is $1950 and fib retracement label support area at $1900 and The first resistance label is $3000
This is not a piece of financial advice.
Then, hit the like button and share your chart in the comment section if you like it.
thank you.

#ETH/USDT 1HOUR UPDATE !!Hello, dear traders welcome you to this ETH/USDT 1HOUR chart analysis.
Hello dear traders, If you find our charts helpful then support our ideas with your LIKE and COMMENT, also be free to ask any question in the comments, and we will try to answer for all, thank you, guys.
CHART ANALYSIS:-Now coming to the chart. Eth is forming an ascending triangle pattern on the 1-hours time frame. The direction of the breakout will determine the next step for ethics. Our target is $2.5k if eth breaks this wedge (closes above $2.3k) or if eth breaks through this triangle (closes below $1.9k) we should target $1.5k
This is not a piece of financial advice.
Sorry for my English it is not my native language.
If you like it, hit the like button and share your charts in the comments section.
thank you

#ETH/USDT DAILY UPDATE !!Hello, members and welcome to this ETH/USDT quick chart analysis.
As I mentioned in my previous chart that is Nothing much change to see at this daily time frame ETH is still trading above the support zone which is $1950 - $2050 and the support zone is $1795 and the resistance label is $3073
This is not a piece of financial advice.
Then, hit the like button and share your chart in the comment section if you like it.
thank you.

#ETH/USDT DAILY UPDATE BY CRYPTOSANDERS Hello, members and welcome to this ETH /USDT quick chart analysis.
In the current scenario, ETH is heading towards the lower support area of $2075
As per the current scenario, if ETH holds the $2100 level, we could see a rally from that level.
Now, IMO we should sit aside from the market until there is a bullish divergence.
This is not a piece of financial advice.
Do hit the like button if you like it and share your charts in the comments section.
thank you.
