#ETH/USDT#ETH
The price is moving within a descending channel on the 1-hour frame, adhering well to it, and is heading for a strong breakout and retest.
We are seeing a rebound from the lower boundary of the descending channel, which is support at 1555.
We have a downtrend on the RSI indicator that is about to be broken and retested, supporting the upward trend.
We are looking for stability above the 100 moving average.
Entry price: 1591
First target: 1628
Second target: 1658
Third target: 1695
Ethlong

The impossible is possible and ETH can cost 12,000In my humble opinion we are seeing bullish accumulation which could lead to a rise to $12,000
And we have a lot of fundamental growth drivers for Ethereum:
The Pectra upgrade is expected to launch in May. It will introduce key improvements like account abstraction, increased staking limits (from 32 ETH to 2048 ETH)
Vitalik Buterin recently proposed transitioning Ethereum’s execution layer from the EVM (Ethereum Virtual Machine) to RISC-V, it would be a long-term game-changer for Ethereum’s infrastructure.
The market currently shows a massive imbalance — ETH shorts on CME have reached historical all-time highs. This extreme bearish positioning could set the stage for a powerful short squeeze.
The movement can be fast and sharp and now it is important to hold the support at 1500. And in order for your deposit to be happy with this price of 12k, you need to be patient and not work with high leverage and not check the chart every 5 minutes, but DYOR)


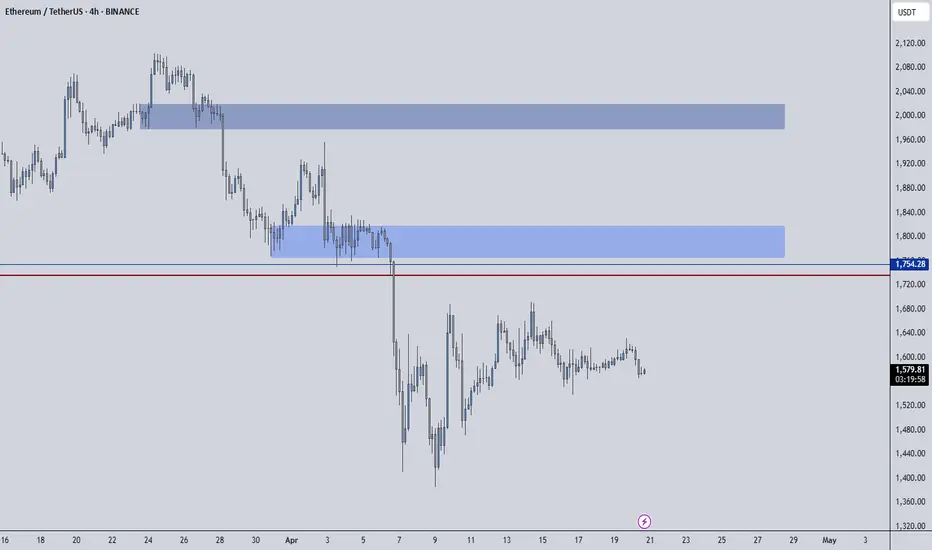
ETHUSDT | One of Today’s Top Volume GainersEthereum has been attracting a lot of attention today, with trading activity picking up noticeably. If you’ve been watching closely, you’ll see that the blue boxes above price are acting as reliable resistance zones. Every test of these areas has been met with selling pressure, suggesting bears remain cautious here.
Key Observations
• Blue Boxes as Resistance
These zones have halted rallies before. Expect price to struggle when it reaches these levels unless strong bullish energy steps in.
• Potential Bullish Shift
Markets can turn quickly. If Ethereum breaks above a blue box with solid volume and then retests it successfully, I will drop my short bias and look for a long entry. Until I see that confirmation, I remain skeptical of further upside.
How to Trade This Setup
Short Entries on Rejection
Wait for price to approach a blue box and show clear signs of weakness on a 5‑ or 15‑minute chart. Once you see a confirmed break down in structure and CDV supports selling pressure, that’s your signal to short.
Switching to Long
If a breakout occurs above the blue box with conviction and price comes back to retest it successfully, shift your bias. Only after a retest holds and lower‑time‑frame confirmations appear will I consider going long.
Patient Execution
Trading isn’t about jumping at every move. We wait to see what the market tells us. When you trade based on confirmation rather than assumption, you avoid the traps that catch so many.
Why Trust This Analysis
I focus on setups that combine volume, structure, and real‑time order flow signals. My track record—verifiable right on my profile—shows a high success rate because I trade with discipline and clear rules. If you want clarity instead of noise, stay tuned and act on confirmed signals.
📌I keep my charts clean and simple because I believe clarity leads to better decisions.
📌My approach is built on years of experience and a solid track record. I don’t claim to know it all but I’m confident in my ability to spot high-probability setups.
📌If you would like to learn how to use the heatmap, cumulative volume delta and volume footprint techniques that I use below to determine very accurate demand regions, you can send me a private message. I help anyone who wants it completely free of charge.
🔑I have a long list of my proven technique below:
🎯 ZENUSDT.P: Patience & Profitability | %230 Reaction from the Sniper Entry
🐶 DOGEUSDT.P: Next Move
🎨 RENDERUSDT.P: Opportunity of the Month
💎 ETHUSDT.P: Where to Retrace
🟢 BNBUSDT.P: Potential Surge
📊 BTC Dominance: Reaction Zone
🌊 WAVESUSDT.P: Demand Zone Potential
🟣 UNIUSDT.P: Long-Term Trade
🔵 XRPUSDT.P: Entry Zones
🔗 LINKUSDT.P: Follow The River
📈 BTCUSDT.P: Two Key Demand Zones
🟩 POLUSDT: Bullish Momentum
🌟 PENDLEUSDT.P: Where Opportunity Meets Precision
🔥 BTCUSDT.P: Liquidation of Highly Leveraged Longs
🌊 SOLUSDT.P: SOL's Dip - Your Opportunity
🐸 1000PEPEUSDT.P: Prime Bounce Zone Unlocked
🚀 ETHUSDT.P: Set to Explode - Don't Miss This Game Changer
🤖 IQUSDT: Smart Plan
⚡️ PONDUSDT: A Trade Not Taken Is Better Than a Losing One
💼 STMXUSDT: 2 Buying Areas
🐢 TURBOUSDT: Buy Zones and Buyer Presence
🌍 ICPUSDT.P: Massive Upside Potential | Check the Trade Update For Seeing Results
🟠 IDEXUSDT: Spot Buy Area | %26 Profit if You Trade with MSB
📌 USUALUSDT: Buyers Are Active + %70 Profit in Total
🌟 FORTHUSDT: Sniper Entry +%26 Reaction
🐳 QKCUSDT: Sniper Entry +%57 Reaction
📊 BTC.D: Retest of Key Area Highly Likely
📊 XNOUSDT %80 Reaction with a Simple Blue Box!
📊 BELUSDT Amazing %120 Reaction!
I stopped adding to the list because it's kinda tiring to add 5-10 charts in every move but you can check my profile and see that it goes on..
Global Market Overview. Part 4.1: ETHEthereum: Fell. Miscalculated. Still Believe.
(Previous post:https://www.tradingview.com/chart/BTCUSD/ecmMaAdq-Global-Market-Overview-Part-4-BITCOIN/)
Let me get straight to the point: I lost over $300,000 during the last Ethereum rally. That’s a fact. And I’m not alone.
But here’s what truly matters: I still consider Ethereum one of the most fundamentally strong assets in the entire crypto market.
And I’ll explain why this drop isn’t a collapse into the abyss — but a temporary breakdown in price mechanics, driven not by fundamentals, but by greed and speculation.
What went wrong?
At first glance, the market behavior made no sense.
While BTC, Solana, XRP — and even meme coins — were being aggressively bought up, Ethereum just... froze.
No breakout. No test of previous highs. Not even a real attempt.
Which is strange, considering:
Ethereum has become a deflationary asset — more ETH is being burned than issued
ETH ETFs have attracted hundreds of millions of dollars
Developers are consistently improving the network and reducing fees
It remains the backbone of both the DeFi and NFT ecosystems
And yet — the price stood still. And then it fell.
Why? Because we are to blame.
Let’s be honest. I made a mistake. Just like millions of others.
Instead of holding ETH on spot, I went long with leverage on futures.
I thought I’d amplify my volume. Boost my profits.
Instead — I amplified my liquidation.
That’s exactly what happened to the market:
ETH futures volume exceeded spot volume
Open interest in long positions skyrocketed
Market makers saw the imbalance — and began systematically flushing out over-leveraged positions
The price didn’t fall because there’s something wrong with Ethereum.
It fell because the market became too one-sided.
Greed became vulnerability — and the market makers took full advantage.
And then came tariffs.
As if the futures flush wasn’t enough, the market got hit with more bad news:
Trump’s administration escalated a new trade war.
Stock indices dropped. The dollar strengthened.
Crypto got slammed again — this time not technically, but macroeconomically.
Now Ethereum is sitting far below its highs.
Disappointment in the eyes of millions.
And yes — heavy losses, including mine.
Will there be a reversal?
Yes. Hell yes.
I don’t know exactly when, but I’m absolutely certain that it will come.
Ethereum will recover.
Why?
There’s fundamental demand. Exchanges are running low. Whales are accumulating and transferring ETH to cold storage.
Technologically, it’s stronger than its competitors. No other L1 or L2 has the developer base or ecosystem Ethereum commands.
The market will get a tailwind. Any de-escalation in the trade war could reignite the entire crypto space.
It’s undervalued. ETH at $2,000 is a floor. In a normal market phase, it’ll trade much higher — significantly.
This isn’t a revenge play. It’s analysis.
I’m not writing this to justify myself.
I’m writing to say this: Ethereum is not dead.
It’s exhausted. Temporarily.
I understand those who sold. It’s human.
But I’m staying. Because unlike hype-driven altcoins, Ethereum is infrastructure.
You can’t replace it.
You can’t bypass it.
You can only ignore it — and regret it later.
Bottom line
Ethereum doesn’t have to move in sync with Bitcoin.
It has its own path.
But that path is not downward.
Right now, it just happens to go through the pain of futures liquidations and media noise.
As soon as Trump exhales, as soon as the rhetoric shifts — the market will see ETH at $2,500 and beyond.
And this growth won’t be speculative — it’ll be based on fundamentals.
Yes, I lost $300K.
But I haven’t lost faith in the asset.
And I’m not going anywhere.
Because Ethereum doesn’t end with this drawdown.
It’s just getting ready for its next phase.

ETH: NEW UPDATEHello friends
Given the price decline we had and the lower lows that the price made in a support area, you can see that buyers entered and broke the downtrend and made higher lows, which is expected to move the price to the specified targets.
*Trade safely with us*

XRP/USDT(UPDATE)Hello friends
Given the price growth we had, we can enter into transactions within the specified limits with capital and risk management and move towards the specified goals.
*Trade safely with us*

LTC/USDT:BUYHello friends
Due to the good price growth, we see that the price has hit a lower ceiling and has fallen, which we can buy in stages during the price decline, within the specified ranges and move with it to the specified targets.
Observe capital and risk management.
*Trade safely with us*

APT/USDT:BUYHello friends
Given the good price growth, we see that the price is in an ascending channel and has fallen, we can buy in a stepwise manner in the price decline within the specified ranges and move with it to the specified targets.
Observe capital and risk management.
*Trade safely with us*

Short-term trade for ETHEREUM with RR of 1:2.6Short term trade for ETHEREUM with RR of 1:2.6
Following the recovery from the recent dip, this is a short-term trade.
Entry: $1,640
Stop Loss: $1,632
Take profit: $1,660
Trade with care

ETH | Either OR Scenario | ALTSEASONThe previous update was on the current low that ETH hit a couple of days ago, and what happened the previous time we hit that price:
POTUS Donald Trump signed a bill that exempts DeFi platforms from reporting on their clients' taxes, unlike traditional brokers. This may explain the bullish sentiment we're observing across the market currently.
💥 ALTS Part 1 and 2 below, stay tuned for Part 3 ! 💥
____________
BINANCE:ETHUSDT

PI/USDT:SIGNALHello friends
Given the price growth, you can see that we had a stop and a triangle pattern was formed, which is a continuation pattern of the trend.
Now, given the complex market conditions, our suggestion to you is to buy in stages and be sure to observe risk and capital management.
I have also specified goals for you.
*Trade safely with us*

$ETHUSD Buy After the recent drop in prices of major crypto currencies, BITSTAMP:ETHUSD seemed poised to rally and 1,756 to 2000 remains a crucial zone to see watch because price moving above would mean a solid recovery and possibly a new all time high

DOGE/USDTHello friends
Due to the price drop, we reached a good support area where good buyers supported the price.
Now we can buy in steps and with capital management in the specified areas and move to the specified targets.
Always buy in fear and sell in greed.
*Trade safely with us*

PEPE/USDT:BUY!!!Hello friends
Due to the heavy price drop we had, the market has fallen into fear and the price has been well supported in the specified support area, according to which we can buy in steps in the specified areas with capital and risk management and move to the specified goals.
Always buy in fear and sell in greed.
*Trade safely with us*

SOL/USDT:BUY...Hello friends
Due to the heavy price drop we had, the market fell into fear and at the specified support, buyers supported the price, which is a good sign that we should buy within the support ranges with capital and risk management and move with it to the specified targets.
Always buy in fear and sell in greed.
*Trade safely with us*
EHT/USDT:BUY...Hello friends
Due to the heavy price drop we had, the market fell into fear and at the specified support, buyers supported the price, which is a good sign that we should buy within the support ranges with capital management and move with it to the specified targets.
(Always buy in fear and sell in greed)
*Trade safely with us*

ETH in Bullish mode, short term target, 1750 is nextETH is in Bullish mode.
LONG ETH:
Buying/Long from range: $ 1587 to 1600
Sale/Short at targets: $ 1735, 1750, 1770
Disclaimer:
Please note, this chart analysis is for ideas only. No financial advice.

3k before august, is it real?Looking at history, ETH corrections of 65–75% have often been followed by sharp rallies. I believe we’re in a similar situation right now. With the upcoming Pectra upgrade on the horizon, there’s a strong chance we could see this pattern repeat.
At the same time, ETH is currently undervalued — not just against BTC, but also compared to many altcoins.
In my opinion, ETH is the most undervalued asset in the market right now.

ETH | Ethereum Hits 2 YEAR LOW - What's Next?Could it be that ETH bottoms out here?
Low from March 2023:
Interestingly enough, it could be said that it was the previous cycle's accumulation zone. Considering the previous cycle's price action, this isn't a ad zone to load up - for the longer term.
From here, although the price bounced high, and low, it was the 8-month price action before the next bullish cycle started. This gives us perspective in terms of time
___________________
BINANCE:ETHUSDT

Ethereum Failing against BITCION ? Here is a valid reason why.
In a world being thrown upside down and sideways and Markets Rising and falling and Rising again on a few words and actions, there is one Shining Light in the world of Crypto
Ethereum - And its constant DROP when compared to BITCOIN
It is possibly the Only coin in the top 10 that has failed to rally at least once, to any significant degree since 2023, when nearly everything else took off.
It currently sits at the same price it was in May 2020 !
It reached its ATH in Nov 2021 and ever since then, has fallen in what is becoming a parabolic reverse curve;
All this despite coins like BASE, Coinbases Crypto, being based on that ETH Layer.
This is pretty well ALL down to the adoption of BITCOIN by corporate ventures, keeping the Bitcoin Dominance high.
I mentioned in a post back in 2023 ( maybe here but certainly on X) how BTC could be used in the "Financial Wars" to come, as a means to weaken and scupper ALT coins.
They tried to Destroy crypto, they failed and so, by allowing Bitcoin ETF's etc, BTC dominance remains High and ALTS Fail
And that is EXACTLY what we have seen so far. As Corporations continue to Buy Bitcoin, Dominance remains high..... It isd as simple as that.
And this ETH BTC chart shows that very clearly.
The REAL question is why the ETH ETF's failed so much.
Maybe that is because MANY people realised the "energy behind Ethereum" - The American crypto , Protected by Gensler and predecessors. The Not really Descentralised structure and power if you hoold a LOT, something not many independants can do

Ethereum Surges Past Resistance as Trump Halts Tariff Plans..!🚨 **Market Update** 🚨
President Donald Trump has announced a 90-day pause on the full effect of new tariffs for certain countries, and the markets are reacting strongly! 📈 Both the stock and crypto markets are surging as a result.
Right now, Ethereum is testing the $1600 resistance level on the 1-hour timeframe. 💥 Our trading strategy is to let it break the resistance and sustain above it, then look for a solid entry on the pullback.
Stay tuned and trade wisely! 🚀💰

ETH ready for Pectra and bull run LONGETH HODLs ready for jump at the end of APRIL for Pectra upgrade.
inte
rest rate of usa
weekly RSI
break
the trend line
im ready for new ATH even for the most important altcoin
