TRUMPHello friends
Due to the price drop, we reached a good support area where good buyers supported the price.
Now we can buy in steps and with capital management in the specified support areas and move to the specified targets.
Always buy in fear and sell in greed.
*Trade safely with us*
Ethlong

ETH $ Target 2025we getting near the bottom for this year , now we tested the first support , that's why we see bait of buying pressure happening .

Ethereum Weekly Analysis: Double Top BreakdownHello guys!
Ethereum has formed a clear double top pattern on the weekly timeframe — a strong bearish reversal signal. The pattern is confirmed by:
🔹 A break of the ascending trendline
🔹 Strong rejection from the $3,200–$3,400 resistance zone
🔹 Current price action hovering near $1,780
🧭 Target of the double top pattern lies in the $1,350–$1,450 zone — aligned with a low-volume area on the volume profile, which could act as a magnet for price.
Key Takeaways:
If ETH fails to reclaim the $2,000 zone, more downside pressure is likely.
A bounce may occur in the target zone, providing a possible mid-term long opportunity.
📌 Stay cautious and watch for reaction zones, especially if ETH reaches the $1,400 region.
You can buy it at $1400!

WOW, I can see ALTSEASON of 2025 what about you?USDT.D can show me as a big sign of starting ALTSEASON. also if break the line.


US100 Bullish SideUS100 show clear bullish momentum and many indicators shows that US100 in uptrend which are given below:
RSI daily timeframe bullish divergence
Descending parallel channel which show that US100 in a strong uptrend
Strong support zone
All these indicator indicators shows us that US100 in a clear bullish momentum

PEPE/USDT:FREE SIGNALHello dear friends
Given the price drop we had in the specified support range, a double bottom pattern has formed, indicating the entry of buyers.
Now, given the good support of buyers for the price, we can buy in steps with capital and risk management and move to the specified targets.
*Trade safely with us*

ETH/USDT:UPDATEHello dear friends
Given the price drop we had, a head and shoulders pattern has formed within the specified support range, indicating the entry of buyers.
Now, given the good support of buyers for the price, we can buy in steps with capital and risk management and move towards the specified targets.
*Trade safely with us*

SEI/USDT:BUY LIMITHello dear friends
Given the price drop we had in the specified support range, the price has been able to create higher ceilings and floors.
Now, given the good support of buyers for the price, we can buy in steps with capital and risk management and move towards the specified goals.
*Trade safely with us*

CRV/USDT: BUYHello dear friends
Due to the good price growth
Now we can buy in stages with capital and risk management and move towards the specified goals.
*Trade safely with us*

Long on BabydogeI onpen log position on Babydoge. Every time when it his support its gain almost 300%

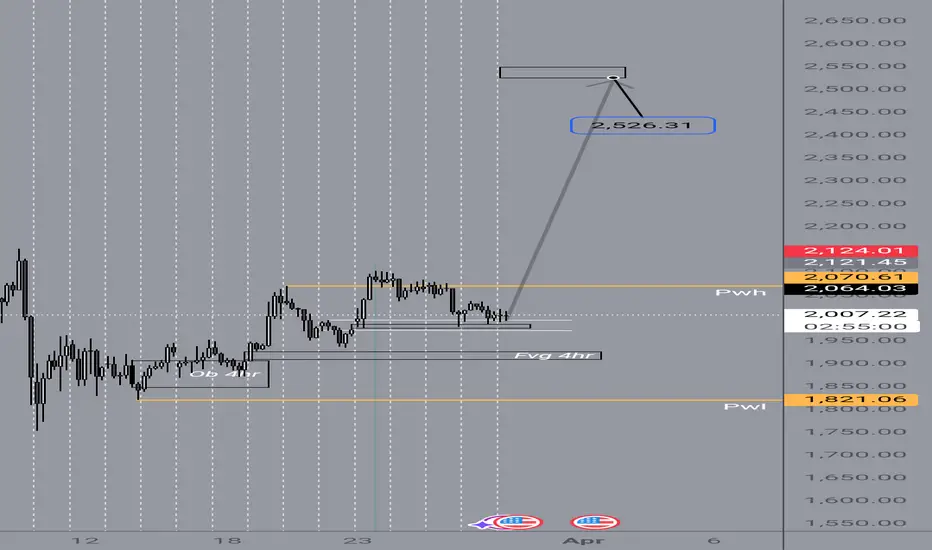
LONG ON ETHEREUM (ETH/USD)Ethereum has given a change of character (choc) to the upside on the 4 hour timeframe...
followed by a nice sweep of engineered liquidity!
Its currently respecting a key demand are and I believe it will now rise for 300-500 points this week.
I am buying Eth to the next level of resistance.

ETH.DOMINANCE Bullish divergenceIn ETH.DOMINANCE chart show clear bullish divergence on daily timeframe which means ETHUSD and ALTCOINS in bullish momentum in coming days. Stay focus on bullish side and ready for uptrend.


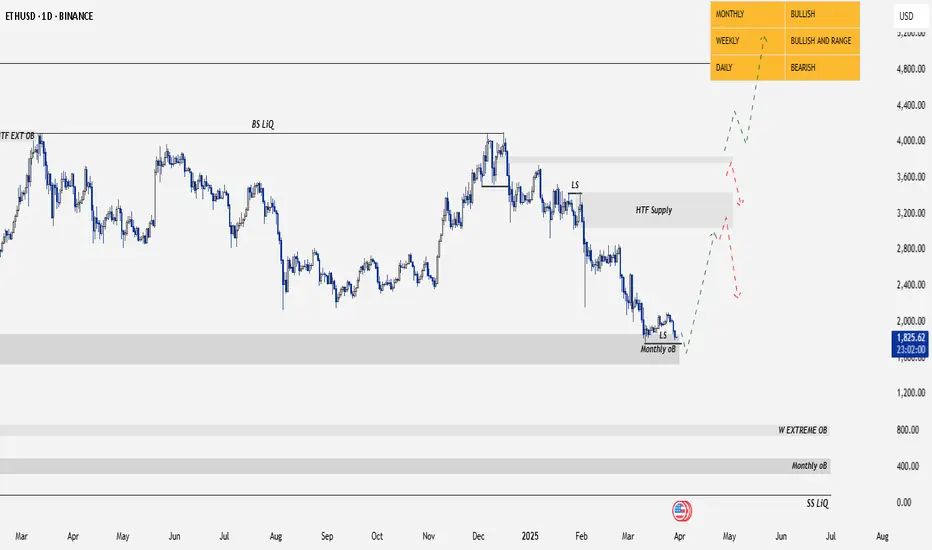
ETH/USDT | Potential Trend Reversal from Monthly Demand Zone📉 Market Overview:
ETH/USDT is currently holding within a strong monthly demand zone, showing signs of possible accumulation. Price has tested this level and indicating a potential reaction.
🔍 Key Trading Conditions:
✅ Liquidity Sweep: If price sweeps the daily previous low, this could be a liquidity grab to trap sellers.
✅ Market Structure Shift (MSS): If price breaks a key lower high to the upside, it would confirm a short term bullish structure shift, signaling a potential trend reversal.
📊 Trade Plan:
🎯 Bullish Confirmation: Wait for a clear MSS to the upside on lower timeframes (4H/1H).
🔹 Entry: After a successful daily low sweep & bullish confirmation.
🔹 SL: Below the liquidity sweep low.
🔹 TP1: Mid-range supply zone.
🔹 TP2: Previous structural highs.
🚨 Risk Management:
Always wait for confirmation before entering.
Monitor price action around key levels.
Manage risk with proper stop-loss placement.
📌 Conclusion:
If ETH sweeps liquidity and shifts structure bullishly, we can expect a potential reversal. Stay patient and let price confirm the move!
📈 Like & Follow for More Market Updates! 🚀
ETHUSD ETHEREUM Long in short termVery hard week for ETHEREUM:
In my opinion eth has a good chance at this level to climb higher
It has nearly brokeen every possible support,but nobuilding signs of deivergences.
The strategy is short term
Never the less ,Trump´s policy is not good nor for crypto neither for other markets.
And thereforwe should think only in short term,taking chances.
On monday /tuesdays positive ton of the white house,on wed/ to Friday aggressive tons,at the weekend then again taming tone of the white house.
This will accompany us until 2029.
Ofcourse it wont be easy.For no one.
Therefor i make 5-10 different strategies,different apporches.
In case the profit targets hit,then its is ok.If not I immediately cut the positions.
STop is below themajor support.
If that level breaks,ETH will potentially fall to 1100-1250. Idont hope,that it happens.But these days,I expect always the unexpected.You may do this,too.
Position sizing: depends on your risk appetite.
I would use stops in any case....Good luck

ETH as well in a big opportunity as btc eth is in a big ascendant channel, where is formed a big falling wedge inside the channel, we are now on the support of the channel and of the wedge, so should be a nice level hard to let it down, there is even fib retracement to fill the gap formed, so i expect eth a nice move of 20/30% if trump doesnt say shit as every day of his life !!! trade safe and open a max leverage of 10x

ETHUSD Bullish ScenarioIn ETHUSD chart shows us clear bullish momentum.
RSI bullish divergence
Double bottom formation
Support zone
Bullish Falling Wedge
All these indicators shows that ETHUSD in upward direction after the breakout of trendline

Going Long on ETH with 100x Leverage !Alright, let’s talk about a high-probability setup that I’m trading right now—long ETH, stop-loss at $1,935, take-profit at $2,300. This isn’t just a random entry; it’s based on a super reliable pattern called a Running Flat.
What’s a Running Flat?
A Running Flat is a repetitive market structure that occurs all the time—so often, it feels like an infinite money glitch. It plays out nearly 90% of the time, making it one of the easiest and most profitable patterns to trade.
Think of it like a market cheat code:
📌 It traps early shorts
📌 It creates liquidity for smart money
📌 It explodes in the direction of the trend
And when you spot it? You take the trade, set your stop, and let the magic happen.
Why This ETH Trade?
We’ve got a textbook Running Flat formation
The market is primed for a breakout
The EW 2.0 model confirms the setup
Risk is tightly managed (SL at $1,935 means no overexposure)
100x Leverage – High Risk, High Reward
I know what you’re thinking: 100x leverage? Are you crazy? Well, maybe a little. But when you’re trading a setup with a 90% win rate, it’s all about maximizing opportunity while keeping risk under control. Tight stop, big reward. Simple.
The Trade Plan
✅ Go long ETH
✅ Stop-loss: $1,935 (discipline matters)
✅ Take-profit: $2,300 (targeting the move)
✅ Risk-reward: Favorable and repeatable
Final Thoughts
If this trade works, it’s another example of why Running Flats are pure magic. If it doesn’t? No big deal—we trade the next one.
But history says… we’re about to print money. Let’s see if the infinite money glitch delivers again. 🚀

Ethereum Major Breakout Confirmed, Targeting $7800Ethereum has just confirmed a major breakout above a critical resistance zone, signaling a strong bullish continuation. Here's the detailed breakdown:
1.Ascending Triangle Breakout:
ETHUSD had been consolidating within an ascending triangle pattern since late 2024, with the upper resistance around $4000 and a rising support trendline (highlighted in yellow).
The breakout above $4000 on high volume confirms the bullish pattern, often a precursor to significant upward moves.
2. Accumulation Zone:
Prior to the breakout, ETH spent several months in an accumulation zone between $2000 and $4000. This phase allowed buyers to build positions, setting the stage for the current rally.
3. Price Targets:
The measured move of the ascending triangle (height of the pattern) projects a target around $7800. This is calculated by taking the height of the triangle (from the base at $2000 to the resistance at $4000, which is $2000) and adding it to the breakout point ($4000 + $2000 = $6000). However, considering the momentum and historical price action, the next psychological level at $7800 seems achievable.
4. Support Levels:
The previous resistance at $4000 now acts as strong support. If ETH pulls back, this level should hold to maintain the bullish structure.
Additional support lies around $3000, aligning with the 50-day moving average (not shown but inferred from typical setups).
5. Momentum Indicators:
While the chart doesn’t display specific indicators like RSI or MACD, the sharp upward move suggests strong momentum. Traders should watch for overbought conditions on RSI (above 70) as ETH approaches higher levels, which could signal a potential pullback.

ETH Did his last kiss! Huge upmove inComing I share my thoughts and ideas rarely
I always draw my lines to find out how the majority of people see the charts.
dont want to explain more , but now I think market makers tried their best to show market is bearish , ( as a prove check the fear and greed index ) which made wounder if these prices really are fairly valued or not ?!
anyway , maybe its time for eth to reclaim some shares from market dominance :)
will update this soon ...

Ethereum’s Rebound: V-Shaped Surge to an October 2025 PeakI have come today with a new ETH perspective, one that I think is more accurate than my last ETH TA.
Take a look here at how I got this one wrong, mainly because I was counting too much on this diagonal support to hold. Why didn’t it hold? Because there were too many traders looking at it, and when too many people are watching, the opposite happens, and it breaks.
I would advise looking at this TA first before you carry on with this one because the two tie together neatly.
My view is that from here, we will start a V-shaped recovery that will send ETH to $15,000–$18,000 by mid-October 2025. There is a very interesting fractal playing out that I discovered.
So, my alarm went off with this "Wyckoff Spring" indicator. It has only fired off two other times in history: once at the bottom of the COVID crash and the other time at the December 2016 bottom when ETH was just $8. So, I thought, well, let’s take a look to see if the first cycle has anything interesting.
As soon as I flipped to the daily chart, I immediately saw similarities. What if ETH is forming the fractal from the first cycle before the massive run-up? The timeframe and the drawdown percentages are nearly the same, the fractal is nearly identical, and the fact is, the Wyckoff Spring has fired off now, forming this fractal like in 2016. What are the chances…?
When you overlay the fractal, it lines up with mid-October 2025.
I have scanned the entire history of ETH, and I cannot find a fractal closer to this one. This could very well be the pico bottom for ETH this year.

Possible buy on ethereumPrice retesting the liquidity void formed by the gap expecting price to continue with uptrend with final targets at 3262