CRV/USDTHello friends
Due to the heavy price drop, buyers have been supporting the price well on the indicated support, which has caused a good price growth.
Now in the indicated support areas, you can buy in steps with capital management.
If you want to be with us in the Alt Season, send us a message.
*Trade safely with us*
Ethlong

SUI/USDTHello friends
Given that the price has reached a good support and buyers have entered and supported the price, you can now buy in stages at the specified levels with capital and risk management and move towards the specified goals.
If you would like to be with us in the Alt Season, send us a message.
*Trade safely with us*

Breaking: Ethereum Is Good Coin ($EBULL) Surged 66% TodayThe Ethereum is Good coin ($EBULL) a token used as Ethereum's mascot saw a noteworthy uptick in price surging 66% today a move we believe to have been related to the rise in the Ethereum price to reclaim the $2k pivot point.
The $EBULL token recently in the start of year underwent a Community Take Over (CTO) as the community took to their hands to make the project a worthwhile project under the Ethereum network. With backings from Vitalik Buterin and notable crypto exchanges like Poloniex, the $EBULL coin stands to be a coin or token worth hording in your wallet.
Technical Outlook
As of the time of writing, the $EBULL is up 35% trading with a bullish RSI of 71. The surge today was as a result of a breakout from a falling wedge pattern that saw $EBULL tanked to $968k in market cap from a high of $3.4 million just months ago.
$EBULL might encounter a reprieve in the $0.00011 support point before picking momentum up towards recent highs.
ETHEREUM IS GOOD Price Live Data
The live ETHEREUM IS GOOD price today is $0.000122 USD with a 24-hour trading volume of $103,532 USD. ETHEREUM IS GOOD is up 30.72% in the last 24 hours, with a live market cap of $1,215,331 USD. It has a circulating supply of 10,000,000,000 EBULL coins and a max. supply of 10,000,000,000 EBULL coins.

Ethereum (ETH/USD) Breakout – Next Targets $2,328 & Beyond!
Overview:
Ethereum has been in a downtrend, forming a descending channel, but it recently found strong support at $1,764 and has now broken out of a range-bound consolidation. This could be the beginning of a bullish move towards higher resistance levels.
Key Market Structure Analysis:
🔸 Previous Downtrend: ETH was trading within a bearish channel, creating lower highs and lower lows before bottoming out.
🔸 Accumulation Phase: A sideways consolidation range between $1,764 - $2,017 formed after the downtrend, signaling potential accumulation.
🔸 Breakout Confirmation: ETH has broken above the $2,017 resistance, suggesting that buyers are stepping in.
Potential Trade Setup:
✅ Bullish Scenario:
A successful breakout retest around $2,000 - $1,950 could provide an entry opportunity.
Upside targets:
🎯 $2,328.95 – Major resistance level from previous price action.
🎯 $2,559.17 – Next key resistance if momentum continues.
⚠️ Bearish Scenario (Invalidation):
A drop below $1,950 - $1,900 could push ETH back into the previous range.
Losing the $1,764 support could lead to a retest of $1,600 or lower.
Final Thoughts:
Ethereum is showing strength after breaking out of a key consolidation range. If the breakout holds, ETH could be gearing up for a strong rally toward $2,328 - $2,559. However, a retest of the breakout zone may provide a better risk-to-reward entry.
What do you think? Will ETH push toward $2,328 next? Drop your thoughts below! 🔥📈

JUST IN: Ethereum ($ETH) reclaims $2,000The price of the first altcoin (I.e alternative coins) Ethereum ( CRYPTOCAP:ETH ) surged 5% to $2030 price levels reclaiminng the $2k price point. Albeit the general crypto landscape is facing consolidation CRYPTOCAP:ETH seems to break the nuance. This move by Ethereum is tandem with the incoming Ethereum upgrades called "Pectra Upgrade""
The Pectra upgrade is bringing faster transactions, lower fees, & better staking to ETH! With account abstraction (EIP-7702) & higher staking limits (EIP-7251), Ethereum is stepping up its game against Solana!
Technical Outlook
As of the time of writing, CRYPTOCAP:ETH is up 5.12% with a bullish Relative strength index (RSI) of 69 hinting at a continuous rising trend. The 38.2% Fibonacci retracement level is serving as pivot point a move to the $2300 zone would catalyse a bullish spree for Ethereum.
Ethereum Price Live Data
The live Ethereum price today is $2,027.90 USD with a 24-hour trading volume of $13,340,876,260 USD. Ethereum is up 7.20% in the last 24 hours. The current CoinMarketCap ranking is #2, with a live market cap of $244,618,878,972 USD. It has a circulating supply of 120,626,703 ETH coins and the max. supply is not available as per data from CMC.

Bullish ETH theories I think this could be a possible scenario for ETH's next breakout. I think it's possible because of the ETH ETFs that will most likely gain some traction over time, and retail will have to play "catch up" due to the price consolidation over these past years. The winds will turn, and I think everything will play out quite quickly when it happens.
I also think the FED will announce the end of QT today at the FOMC, which COULD trigger the next ETH bull run.
Looking at the ETH/BTC chart, I think this will trigger the next leg up and complete the pattern when looking at the weekly chart, testing the previous highs.
When I look at ETH relative to SOL/USD, it also looks bullish in the short term. I think this is quite reliable, but we will see over time. Although I think ETH will outperform both BTC and SOL and play catch-up with them both.
Conclusion: I have deployed most of my crypto portfolio to ETH now, believing ETH will give me the most beta in this bull run over the coming months. I know the sentiment looks quite bad at the moment for ETH, but I believe there is a saying: "Buy when others are fearful, sell when everybody is greedy." I think this is quite similar to value investing, and I believe there is a lot of value in BTC, ETH, and SOL.
Good luck! And share your thoughts, I like to discuss things like this. =)

ETH/USDT Weekly Chart Analysis. The Ethereum (ETH/USDT) weekly chart suggests a potential bullish reversal from a key support area. Here are the details of the analysis:
Support area: Around $1,750 – $1,830, where the price recently rebounded.
Resistance levels:
First target: $4,015
Key resistance: $4,663, which marks a key breakout level.
ETH has bounced off historical support levels, indicating potential accumulation.
If the price sustains above $1,800, the next target is $4,015, followed by $4,663 if the momentum continues.
A break below $1,747 – $1,700 could lead to further declines, with the next strong support near $1,053.
Look for a confirmation of a breakout above $2,000 to confirm a strong uptrend.
Keep an eye on volume and indicators (RSI, MACD) for further confirmation of momentum.
Risk management is important in volatile market conditions.
If you found this analysis helpful, hit the Like button and share your thoughts or questions in the comments below. Your feedback matters!
Thanks for your support!
DYOR. NFA

ETH is Trying to SurviveETH has formed a descending wedge formation which could help itself to climb a little bit more higher.
Breaking above the accumulation box could lead to an upwards move for ETH.
You can get a long position around 1950.
Good Luck.

ETHUSDT – Bullish Breakout from Trendline, Eyeing Higher TargetEthereum has successfully broken out of the descending trendline, signaling potential bullish momentum. The price is currently holding within a strong support zone, which could act as a launchpad for further upside movement.
I expect the market to push higher towards the next key resistance levels. My target levels are set at $1,989.71, $2,155.17, and $2,267.42, while the stop-loss is positioned at $1,776.44 for risk management.
A retest of the breakout zone could provide an optimal entry before continuation to the upside. Watching for confirmation and volume increase to validate the move.

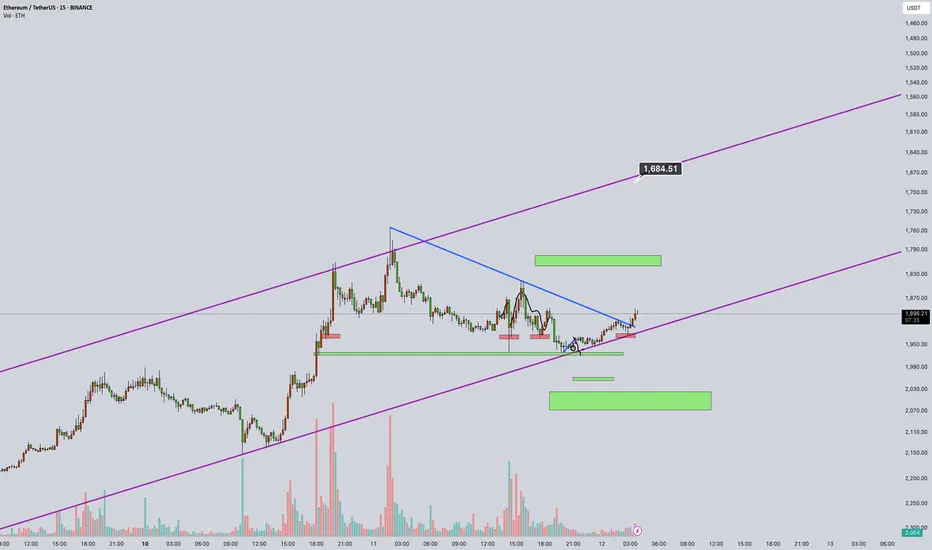
ETHEREUM ( SHORT TERM )Hello crypto community!
In this analysis, I’ve examined the Ethereum (ETH/USDT) 15M chart by inverting it.
It’s 12 March 2025, exactly 5 years since 12 March 2020, when Bitcoin crashed 55% in a single day, marking the “Black Thursday” that shook the market.
Now, the ETH chart shows the purple trendline as resistance (inverted to 1,684 USD) and green zones as support (inverted to 1,500-1,600 USD).
The pattern suggests a potential downturn; a break below the blue line could trigger a sharp pullback. Volume has risen by ~20% in the last hour, supporting this move.
Potential Scenario:
If resistance at 1,684 holds, the price may test support at 1,500-1,600, with a possible drop to 1,400. While not as severe as the 12 March 2020 crash, this week calls for caution. As a spot trader, I’m planning positions around the 1,600-1,500 range.
What do you think? Will ETH drop, or will the bull run continue? Share your thoughts below! 📉📈
$ETH PRICE RIDE TO $3K ON THIS BULL RUN 2025As of March 16, 2025, here are the latest developments in the Ethereum ecosystem:
Market Performance
Ethereum (ETH) is currently trading around $1,900, reflecting a 7.71% decrease over the past 24 hours.
Security Concerns
The FBI has accused North Korean-backed hackers, known as the Lazarus Group or TraderTraitor, of executing a $1.5 billion theft from Bybit, a Dubai-based cryptocurrency exchange. This heist, primarily involving Ethereum, is considered the largest in crypto history. The stolen assets are being laundered across multiple blockchains, raising significant security concerns within the crypto community.
Network Upgrades
The Ethereum community is anticipating the activation of the Pectra upgrade on the mainnet. This upgrade is expected to enhance network performance and could potentially drive ETH prices toward the $5,000 mark. However, the exact timeline for Pectra's implementation remains uncertain.
Competitive Landscape
Ethereum faces increasing competition from other layer-one blockchains. Notably, Solana (SOL) is reportedly forming a bullish setup that could lead to a substantial price surge, potentially impacting Ethereum's market dominance.
Investment Opportunities
For those interested in Ethereum investments, platforms like ICOminer offer cloud mining services with stable daily returns and principal refund guarantees. This presents an alternative avenue for earning passive income through Ethereum.
Privacy and Decentralization
Recent research has highlighted privacy issues within Ethereum's peer-to-peer network, revealing that validators can be deanonymized, which poses risks to decentralization. Additionally, studies indicate an oligopolistic trend in Ethereum's block-building auctions, suggesting increased centralization.
These developments underscore the dynamic nature of the Ethereum ecosystem, encompassing market fluctuations, security challenges, technological advancements, and competitive pressures.
Disclaimer: This article is for informational purposes only and does not constitute financial advice. Always conduct your own research before making any investment decisions.


ETHUSDT (4H) Analysis - Support, Resistance & Profit Opportunit🔥 ETHUSDT (4H) Analysis - Support, Resistance & Profit Opportunities
Based on the ETHUSDT (4H) chart, here are key support and resistance zones that can guide your trading decisions.
⸻
📌 1. Key Support & Resistance Levels
Price Level (USDT) Role Significance
2,858.82 Strong Resistance Sell target if price tests this level
2,732.76 Fibonacci 0.886 Resistance Potential retracement point
2,622.17 Fibonacci 0.786 Resistance Key level for bullish continuation
2,436.40 Fibonacci 0.618 Resistance If broken, potential bullish trend shift
2,305.91 First Resistance Breaking above could lead to further gains
2,125.10 First Support Key level for buyers to step in
1,928.14 Current Price Attempting recovery
1,861.48 Secondary Support Important level for a rebound
1,753.00 Strong Support If broken, potential further downside
1,492.03 Stop Loss Level Below this, long-term downtrend risk increases
⸻
📊 2. Trading Strategies
💰 ✅ Long (Buy) Strategy
• Wait for a retest at the support zone 1,861 - 1,753 USDT
• Set a Stop Loss below 1,700 USDT
• Target Take Profit (TP) levels at 2,125 - 2,305 - 2,436 USDT
🔥 Aggressive Entry:
• If the price breaks above 2,305 USDT with strong volume, consider a Follow Buy targeting 2,436 - 2,622 USDT
⸻
📉 ❌ Short (Sell) Strategy
• If price rejects at 2,305 - 2,436 USDT with bearish signals (Bearish Engulfing / Shooting Star)
• Set a Stop Loss above 2,450 USDT
• Target TP levels at 2,125 - 1,928 - 1,861 USDT
⚠️ If price breaks below 1,753 USDT, it may drop further to 1,500 USDT
⸻
🔎 3. Key Signals to Watch
✅ If price breaks 2,305 USDT with high volume, bullish continuation is likely.
❌ If price gets rejected at 2,305 - 2,436 USDT, a pullback may occur.
⚠️ If price breaks below 1,753 USDT, strong selling pressure could follow.
⸻
💡 Summary
• ETH is recovering from 1,928 USDT support
• Breaking 2,305 USDT could lead to 2,436 - 2,622 USDT
• Failure to break could result in a retest of 1,861 - 1,753 USDT
ETH/USDT – Is Momentum Heating Up?I’m spotting a bullish structure on the ETH/USDT 15-minute chart, with the price moving within an ascending channel near the $1,900 support zone. If the bullish momentum holds, I’m looking at a potential target around $2,050–$2,100, with a reasonable risk–reward ratio.
What are your thoughts? Are we headed to the moon, or do you foresee another pullback before further upside? Feel free to share your alternative scenarios and the rationale behind them. Good luck and happy trading!

ETHUSDT 📉 ETHUSDT Trade Signal 📈
🔥 Long Entry: $1,990
🎯 Targets:
✅ 1️⃣ $2,277
✅ 2️⃣ $2,507
✅ 3️⃣ $2,818
🛑 Stop Loss: $1,774
⚡ Breakout Watch: Wait for confirmation above $1,990 before entering! 🚀

Is it ETHEREUM waking up now? ETHBTCI´d love to see how this one goes. We can see a breakout, and should ride it at least for a +25%.

Ethereum - Bottom Test Ethereum is attempting to find a bottom before attempting its next leg of the bull run
This touch is shown along the yellow dotted line which I have shown in the green circles
Bulls will have there day when this line is tested
This also aligns with the 0.618 fib
Weekly timeframe

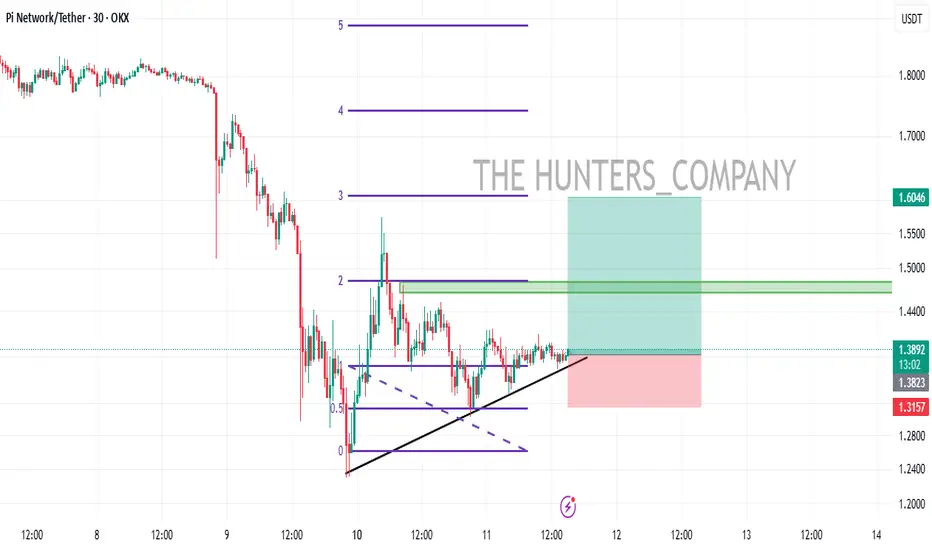
PI/USDT (UPDATE)Hello friends
Given the price drop, now with the formation of a triangle and the price compression, we will probably have a good pump, so we have determined the entry point and price targets for you to enter with risk and capital management.
*Trade safely with us*
ETH SimplifiedTrading doesn't need to be unnecessarily complicated.
This is my view on ETH for the upcoming months and will revisit this later in May 2025.
ETH/BTC RSI on monthly chart is at all time lows at 22 and once this starts going up it won't take a lot of time to reach the target mentioned.
My ETH target of 18k corresponds with BTC reaching 150k and ETH/BTC reaching 0.125
NFA & DYOR
🥂

"ETH/USDT 1H: Bullish Reversal in Play – Targeting $2,280?ETH/USDT 1H: Bullish Reversal in Play – Targeting $2,280?
🚀 Follow me on TradingView if you respect our charts! 📈 Daily updates!
Market Structure (Confidence Level: 8/10):
Bullish reversal forming after testing $1,800 support.
RSI confirms hidden bullish divergence, with higher lows on RSI while price made lower lows.
Smart Money Analysis:
Strong order block formed at $1,880, reinforcing demand.
Break of market structure at $1,950, confirming a shift in trend.
Institutional accumulation visible in the volume profile, suggesting Smart Money positioning.
Trade Setup:
Entry: $1,953 - $1,960 (current retest).
Targets:
T1: $2,120 (Fair Value Gap fill).
T2: $2,280 (high-timeframe resistance).
Stop Loss: $1,880 (below recent swing low).
Risk Score:
7/10 – Favorable risk-to-reward, but a stoprun below $1,900 remains a risk.
Market Maker Activity:
Currently engineering a stoprun below $1,900, likely before a continued move higher.
Volume increasing on bullish moves, confirming institutional buying interest.
Key Levels:
Support: $1,880, $1,800.
Resistance: $2,120, $2,280.
Recommendation:
Long positions remain favorable at the $1,953 - $1,960 entry zone.
Monitor for a stoprun below $1,900 as liquidity is being engineered before continuation.
Manage risk tightly, as Smart Money is accumulating ahead of a potential breakout.
🚀 Follow me on TradingView if you respect our charts! 📈 Daily updates!

ETH(based on NEo wave)This supercycle is a nice nature triangle which E wave is ending and its look like a diamon diametrical.
so I will update it for the confirmation, I think ALTseason is so close and we can see that happening soon but this season take about 400 to 450 days and after that there is a huge CRASH!

eth usdt scalpeth has formed a support and broke the range in 30 min time frame , targeting 200 ema resistance and stops below the range.

Solana's important supporthello friends
Due to the heavy demand of Solana and the construction of new floors based on the market cycle, we expect a new floor within the specified range.
If we reach the support range of 105-110 dollars, we can buy with confirmation, of course, with capital management...
*Trade safely with us*
