Ripple analysis: when to buy?hello friends
According to the drops we had, now the price has reached the specified support range, which is also an important range, and by maintaining it, it can move up to the specified targets.
*Trade safely with us*
Ethlong

Ethereum: the Pawn Stars "best I can do is dump" period...Right now, Ethereum feels less like a blue-chip crypto and more like the butt of all memes. Everyone is taking a shot at ETH, dunking on its price action, and turning it into a laughing stock. But here’s the deal – while the masses are trolling, BlackRock and Trump seem to be accumulating. 🧐
I’ve sprinkled some Ethereum memes in this post—the Transformers one is a classic. 😂 But beyond the jokes, let’s talk charts. ETH has just tested the $2,135 support for the third time and bounced aggressively. I’m still salty that my broker didn’t execute my order at that level at 3 AM—but hey, trading life! 😅
Why does ETH matter now?
Ethereum is often the key to altseason. If the market expects a broad altcoin pump, Ethereum needs to take the lead. And let’s not forget, Ethereum ETFs are here—a game changer that could set the stage for massive institutional flow. 🚀
📈 Back at $3,600, I posted that ETH was heading higher. Fast forward, ETH dipped under $3K, even testing $2,135. The beauty of trading is that you might be wrong today, but right tomorrow. The charts always tell the bigger story—patience pays. 🎯
And speaking of memes, that Pawn Stars "best I can do is dump" image is Ethereum in a nutshell right now. 😂 But when the market finally wakes up… well, let’s just say, I hope Vitalik is ready.
One Love,
The FXPROFESSOR 💙

SOL (SOLANA) is going to touch 420 - DO NOT IGNORE Crypto TradeI AM THE CRYPTO CHIEF
I AM THE FOUNDER OF CHIEF ANALYSIS
Sometimes (Like in the recent past) I over exaggerate my idea to capture your attention and provide you with meaningful information for your own benefit of course. I don’t get paid by Trading View to post these idea. I AM just another crypto trader living in Paris , managing multi million portfolio of my investors, enjoying my life, producing music (Trap Hiphop) with my goons and my Egyptian Turkisk Angora. (He is male by the way, I call him Bruno) So the question arises, Why I post these ideas?
Because my ANALYSIS is always right.
Now listen to ME yall mean comment hurling keyboard captains
SOLANA is going to touch 420+ very very very soon.
Apart from Fundamental Infractions - My Slant Support is ready to thrust SOL, firstly to 230 then 280 then my Main Intervene Support will push it further to 360 (I am excluding all the drama, like temporary corrections and liquidation wicks to clear out high leverage gamblers—-I AM stating just the Bullish Trajectory) So I was saying, After 360, SOL won’t crash it’ll further grow up to 420 with ETH at 5K.
Welcome to BULL RUN my fellow Earth Dweller.
In the last: I WOULD LIKE TO SHOW MY DEEPEST LOVE AND GRATITUDE TO TRADING VIEW AND ALL THE BRILLIANT ONES RUNNING THIS PLATFORM.
I LOVE YOU T.V and I promise until I hibernate I will upload as much valuable ideas to elevate your vision of making a better world for our next ones to come.
CRYPTO CHIEF Signing Out

ETH/USDT 1H: Hidden Bullish Divergence – $3,300 on the Horizon?!ETH/USDT 1H Analysis
🚀 Follow me on TradingView if you respect our charts! 📈 Daily updates!
Current Market Structure:
Price at $2,785 consolidating in equilibrium zone after recovering from the $2,400 low.
RSI showing hidden bullish divergence, confirming strong momentum with higher lows.
Market structure remains bullish, but a clean break of $2,900 is required for continuation.
Smart Money Concepts:
Market Makers likely accumulating in the $2,750-$2,780 range, shaking out weak hands.
Liquidity resting above $2,900, suggesting potential breakout to premium zones.
Volume profile supports bullish continuation if resistance is cleared.
Key Levels:
Entry Zone: $2,750-$2,780
Targets:
T1: $2,900 (key resistance)
T2: $3,100 (psychological level)
T3: $3,300 (premium zone)
Stop Loss: Below $2,650 (recent swing low).
Risk Score:
7/10 – Favorable R:R ratio with clear invalidation point below $2,650.
Market Maker Intent:
Liquidity appears to be building above $2,900, indicating Smart Money's intent to push higher.
A break of $2,900 could trigger significant upward momentum toward premium zones.
Recommendation:
Long positions favorable within the $2,750-$2,780 range.
Monitor for volume confirmation above $2,900 before adding to positions.
Confidence Level:
8/10 – Bullish bias supported by strong technical structure and volume profile.
🚀 Follow me on TradingView if you respect our charts! 📈 Daily updates!

Ethereum Analysis – Inverse Head and Shoulders Formationhello guys!
Pattern Formation:
The chart illustrates a bullish inverse head and shoulders pattern, which is a well-known reversal signal indicating a potential shift from a downtrend to an uptrend. The structure includes:
Left Shoulder – A price decline followed by a minor recovery.
Head – A deeper price drop, marking the lowest point.
Right Shoulder – A higher low compared to the head, signaling to weaken bearish momentum.
Key Technical Levels:
Support Area (~$2,175): The price has bounced off this key level multiple times, reinforcing its strength.
Neckline (~$3,100 - $3,200): A breakout above this level would confirm the bullish pattern.
Target Projection: Based on the height of the pattern, a successful breakout could lead ETH to $4,000+.
Bullish Confirmation:
If ETH breaks and closes above $3,100-$3,200, it would confirm the breakout, leading to further upside.
Volume confirmation is crucial – a spike in buying pressure would strengthen the breakout signal.
Bearish Scenario:
If ETH fails to break the neckline, it could retest the support area at $2,400-$2,600 before another attempt.
A breakdown below the right shoulder ($2,400) would invalidate the bullish setup.
Conclusion:
Bullish Bias: The pattern suggests an upcoming rally if ETH surpasses the neckline.
Key Levels to Watch: $3,100 resistance and $2,600 support.
Next Target: If the breakout occurs, a move toward $4,000 is likely.

ETH Long Setup: Catching the Rebound After a 51% DropEthereum has pulled back significantly, experiencing a sharp 51% decline from its recent high. This steep correction presents a solid opportunity to go long. Currently, ETH is sitting at a critical support level, making it an ideal entry point for a potential recovery.
Trade Setup:
• Entry: Market price after the 51% drop
• Target: $4,400
• Stop Loss: $2,200
• Risk-to-Reward: Favorable for swing traders looking to capitalize on a medium-term rebound.
Fundamental Catalysts:
• Regulatory Optimism: The US is adopting a constructive approach to crypto regulations, reducing uncertainty in the market.
• Global Adoption: Big moves like El Salvador adopting Bitcoin as legal tender signal broader crypto acceptance.
• Institutional Inflow: With the potential approval of a Bitcoin ETF and traditional finance embracing blockchain, institutional demand is set to rise.
• Macroeconomic Boost: Fewer rate hikes from the Fed, coupled with inflation hedging narratives, create a bullish backdrop for digital assets.
ETH’s technical setup aligns perfectly with the current bullish fundamentals. This is more than just a technical bounce—it’s a chance to ride the next wave of crypto growth. Risk is managed with a tight SL, and the upside potential is compelling.
Note: Please remember to adjust this trade idea according to your individual trading conditions, including position size, broker-specific price variations, and any relevant external factors. Every trader’s situation is unique, so it’s crucial to tailor your approach to your own risk tolerance and market environment.

ETH IdeaThe ETH > BTC rotation from the last cycle shows the same dynamic playing out again as BTC tops out.

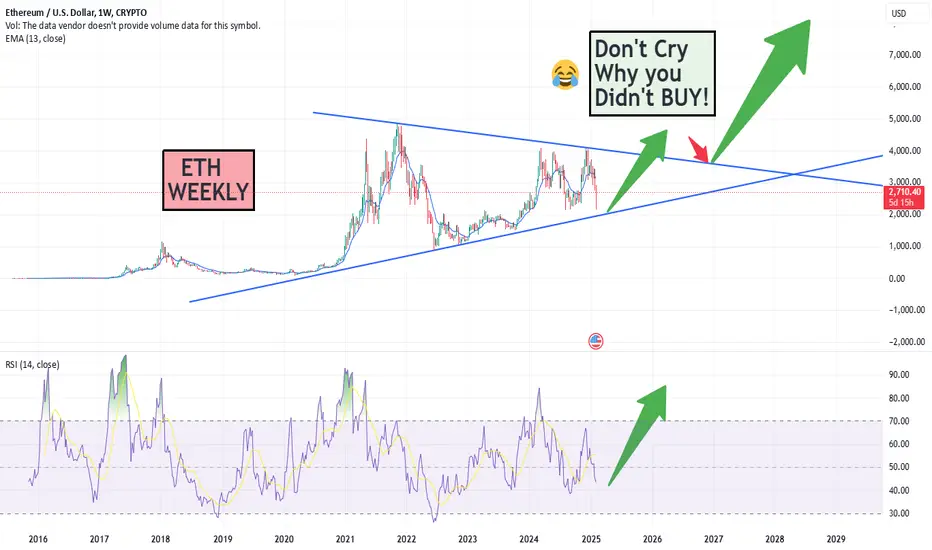
ETH - Weekly chartETH weekly chart
I can not ignore from the RSI that goes down, after having double top in the PA and RSI had a Bearish divergence, now we are after the execuiton, that means ATH is coming once we are out of the triangle.
I lean to 8000$- 10,000$ target.
NFA
just my thoughts
#ETH/USDT#ETH
The price is moving in a descending channel on the 1-hour frame and is adhering to it well and is heading to break it strongly upwards
We have a bounce from the lower limit of the descending channel, this support is at a price of 2374
We have a downtrend on the RSI indicator that is about to be broken, which supports the rise
We have a trend to stabilize above the moving average 100
Entry price 2600
First target 2742
Second target 2942
Third target 3127

ETH/USDT 1H: Bulls Gaining Strength – $3,300 in Sight? ETH/USDT 1H Chart Analysis
🚀 Follow me on TradingView if you respect our charts! 📈Daily charts!
Current Market Structure:
Price at $2,890 showing bullish momentum after breaking premium zone.
RSI at 65.32, confirming strength but not overbought yet.
Volume confirmation on breakout above previous resistance.
Smart Money Concepts:
Market Makers completed accumulation at the $2,400-$2,500 zone.
Premium Zone established around $3,100-$3,300.
Fair Value Gap (FVG) needs filling at $3,100.
Key Levels:
Entry Zone: Current price ($2,890) or pullback to $2,850.
Targets:
T1: $3,100 (FVG Fill).
T2: $3,300 (Premium Zone).
Stop Loss: Below $2,750 (recent swing low).
Risk Score:
7/10 (Favorable R:R but watch for rejection at premium zone).
Market Maker Intent:
Accumulation phase complete, now in markup/distribution phase.
Expect ranging between $2,850-$3,100 before the next major move.
No significant divergences present, structure suggests continued upside after FVG fill.
Recommendation:
Long positions favorable within $2,850-$2,890 range.
Monitor price action around $3,100 resistance for rejection signs.
Avoid chasing, best entries on pullbacks.
Confidence Level:
8/10 for bullish continuation.
🚀 Follow me on TradingView if you respect our charts! 📈Daily charts!

Bitcoin analysis: where is the important support?hello friends
Considering the growth we had, it is natural for the price to take a break.
Now that a formed range has seen the bottom of its range and returned according to the specified support area, it is very, very important that this area is not broken, and if it is, it will give us attractive buying points on altcoins, so there is no need to worry. ..
And by maintaining the support, we will witness the beginning of the next upward movement.
*Trade safely with us*

ETH Update!Here is my analysis on ETH, marked zone is the last standing zone for me, if ETH breaks it, it will be bad, for me Eth still is bearish on weekly time frame. However, triangle pattern can turn the tables if it plays right.
Took this trade, will manage accordingly, follow for more ideas.

ETH 18000 DOLLARS BY SEPTEMBER 2025 God dam what a beautiful day it is , one dreams of such a entry in a bull market.
ETH will hit 18000 dollars by september 2025 there is nothing you can about it , this is the game, leverage wiped out and reset now we enter the "only up period" from this moment .
The key to finding out the next move was the USDT DOM like always pointing the way , the lower higher on the RSI showing divergence.
The money flow on MC indicator was very clearly showing this move , private indicator cant publish it on here.
The Fractal from 2020 on ETH is playing out FORGET THIS HAMMER WICK it is happening from here ETH will close in this channel and rally to 18k!
Do not give in to fear this is where you want to stack as much as possible . Invalidation of idea would be ETH closing a weekly candle under this ascending macro channel .

ETH – What Happened? A Detailed Breakdown and What to do next!Crypto Panic or Manipulation? Breaking Down Ethereum’s Crash and the Entire Market
🔥 Hello everyone, this is Ronin!
The last two trading days have seen one of the biggest crashes in the history of the cryptocurrency market. 📉 We witnessed a massive wave of liquidations that burned through the capital of many traders.
Looking at the numbers:
Most assets lost 10–30% of their value.
Some altcoins dropped by 50%.
The total crypto market capitalization shrank by more than 10% in just a few days.
But the biggest victim of this crash was not Bitcoin, nor low-cap altcoins—it was Ethereum (ETH) itself.
What Happened to Ethereum? Why Did It Drop from $3600 to $2000?
If we talk about the strangest asset in this cycle, Ethereum stands out.
While other coins were breaking all-time highs, ETH didn’t even come close to its peak valuation. This is despite:
The launch of Bitcoin ETFs, bringing in a wave of institutional capital.
News that Donald Trump was reportedly buying ETH for his projects.
Growing interest in L2 scaling solutions and Ethereum network upgrades.
None of these bullish catalysts helped ETH break even $4000.
And then, within just four days, Ethereum plunged from $3600 to $2000. On Binance’s futures market, the price briefly hit $2080.
❓ Has Ethereum ever seen such a sharp drop before?
Personally, I don’t remember such a massive drop happening in such a short time without catastrophic fundamental events.
This wasn’t a network hack, a mining ban, or a major DeFi collapse—nothing fundamentally bad happened.
So who crashed the market, and why?
Who Benefited from This Crash?
Let’s analyze the key question: who had the most to gain from this crash?
The obvious answer is that the biggest winners were major crypto exchanges and market makers.
Why Didn’t Bitcoin Drop as Much?
At the time of the crash:
📌 Bitcoin’s liquidation zones were nearly empty. Many traders had both buy and sell orders in place, so there was no strong incentive to push BTC down.
What About Ethereum?
📉 ETH futures open interest exceeded tens of billions of dollars.
📉 Leverage was heavily skewed towards long positions, meaning liquidations brought massive profits to exchanges.
📉 ETH’s open interest was even higher than BTC’s, making it a prime target for manipulation.
How Crypto Exchanges Made $2 Billion in One Night
The cryptocurrency market is unique because the major players not only provide liquidity but also profit from liquidations.
💰 Crypto exchanges are not just trading platforms—they are global market makers who actively move prices.
📌 On Sunday night, the following happened:
Big players spotted an overloaded leverage in ETH long positions.
They triggered a wave of sell-offs, forcing liquidations.
On Binance alone, exchanges raked in $2 billion in a single day from liquidations.
⚠ Ask yourself this: if you had the power to make $2 billion in a single day, wouldn’t you do it?
Of course, they want to and they do.
How the Smart Money Strategy Works
If you’ve heard of Smart Money trading strategies, you know that big players always think ahead.
📌 The classic scheme:
1️⃣ Pump the market up—give traders confidence that the rally will continue.
2️⃣ Open short positions in zones overloaded with leverage.
3️⃣ Dump the market sharply, triggering stop losses and liquidations.
4️⃣ Buy back at the bottom, raking in billions.
📉 This is exactly what happened with Ethereum—exchanges used a false news narrative about trade sanctions to tank the price.
How I Survived This Crash
🔥 I was long on Ethereum with leverage and held a total position of over 200 ETH.
Honestly, that night was brutal.
📌 When the price dropped to $2080, I had two options:
❌ Panic and close the position, taking a six-figure loss.
✅ Hold and wait for a recovery, because I knew this was a fake move.
I chose the latter. Not only that—I added to my position at the lower levels.
This doesn’t mean the market can’t drop further, but…
📌 Trading rule: Buy when everyone is selling—Sell when everyone is buying.
📌 Right now, the market is in panic mode—which means some smart players are accumulating ETH at these prices.
Conclusion: What Comes Next?
📌 This was an artificial correction—big players intentionally crashed the market.
📌 The coming days should see a recovery, especially if trading volumes start picking up again.
📌 Market psychology is the key factor. When everyone is afraid, that’s when big players accumulate assets.
If you’re interested in how I will navigate my $200,000 ETH drawdown, follow me on TradingView—I’ll be posting regular updates.
🚀 In upcoming articles, we’ll break down the analysis of other altcoins and provide a microeconomic perspective on the most promising assets.
💬 Boost this post if you found it insightful—your engagement helps, and a little positive activity never hurts!
This was Ronin—stay tuned for more updates! Big things are coming. 🎯

ETH/USDT 1H: Oversold & Ready to Rebound – Bulls Eyeing $3,320! ETH/USDT 1H Chart Analysis
🚀 Follow me on TradingView if you respect our charts! 📈Daily Charts!
Market Condition:
Price: $2,939, currently in a discount zone.
RSI: 26.4, indicating extreme oversold conditions.
Key SMC Levels:
Support: $2,880 (major discount zone).
Resistance: $3,120 (equilibrium).
Premium Zone: $3,320 - $3,400.
Trade Setup (Confidence 8/10):
Long Entry: $2,880 - $2,900 zone.
Targets:
T1: $3,120.
T2: $3,320.
Stop Loss: $2,840 (below discount).
Risk/Reward Ratio: 1:3.5 (favorable R:R).
Market Maker Analysis:
Distribution Phase Complete—now transitioning to accumulation.
Hidden Bullish Divergence Forming on RSI, signaling a potential reversal.
Expect a liquidity grab below $2,880 before price rebounds.
Smart Money likely accumulating at these levels.
Risk Score: 7/10
Wait for confirmation of support at discount zone before entering.
Declining volume suggests a potential reversal is forming.
Strong technical setup for longs once support is validated.
📈 Follow me on TradingView if you respect our charts! 🚀Daily Charts!

ETHEREUM NEAR ABOUT TO EXPLODE !!!We may see Ethereum drop upto 2700. where maximum chances are of completing it's C wave of micro wave (ii).

ARKUSDT Trendline Betrayal Bearish Plunge !Trendline Break
The chart shows a clear upward trendline that has been broken. This break indicates a potential shift in market sentiment from bullish to bearish.
Retest Confirmation
After breaking the trendline, the price retraced upward, testing the previous trendline as resistance (red zone). This is a classic confirmation for a short setup.
Entry and Risk Zone
Entry :The short position is initiated just below the retest of the trendline, around the price of 0.5510.
Stop-Loss : Placed slightly above the retest zone, around 0.5897, to minimize risk if the price reclaims the trendline.
Target Zone
The blue area indicates the take-profit target, with a potential level around 0.3908. This level might have been chosen based on prior support or Fibonacci retracement levels.
Risk-to-Reward
The setup has a favorable risk-to-reward ratio, with the stop-loss relatively close to the entry and a much larger distance to the target.
Market Context
The sharp drop in price following the trendline break signals strong bearish momentum. Ensure that this move aligns with higher timeframes and broader market sentiment for confirmation.
Key Considerations
Watch for any sudden buying pressure or market reversal signs that could invalidate the setup.
Volume analysis can provide additional confirmation for the strength of the trendline break and the retest rejection.
Stay disciplined with stop-loss placement to manage risk effectively.
Book profits with usual profit locking rule of 10% by moving SL to BE for safe ride

ETH is going to surprise mostI think everyone is focusing on how many other crypto assets as SOL, XRP could soon get an ETF.
I think the better trade is to stock up on ETH, mainly because it is being hated by most and weak hands have been shaken out.
Stop is year lows.

ETH long or shortI share this analysis where I used my indicators that I developed based on Gann's theory. The time indicator predicts that tomorrow, February 1, the price will have a big movement. In my opinion, from here we could climb towards the 3500 area and later higher.
what do u think? long or short?

ETH/USDT 1H: Bulls in Control – Eyeing $3,500 Next! ETH/USDT 1H Chart Analysis
🚀 Follow me on TradingView if you respect our charts 📈Daily charts!
Market Condition:
Price: $3,380, showing strong bullish momentum after breaking premium zone.
RSI: 65.48, indicating room for upside but nearing overbought territory.
Volume: High, confirming breakout above previous range highs.
Key Levels:
Support: $3,225 (Equilibrium).
Resistance: $3,425 (Premium Zone).
Risk Level: 8/10 (High volatility expected).
Trade Setup (Confidence 8/10):
Entry: Wait for a pullback to $3,325 - $3,350 before entering.
Targets:
T1: $3,425 (Premium Zone).
T2: $3,500 (Psychological Level).
Stop Loss: Below $3,280 (Last swing low).
Smart Money Analysis:
Institutional Buying Pressure: Visible in strong breakouts above previous highs.
No significant divergences present.
Market Makers Likely Accumulating before next leg up.
Volume Profile Supports bullish continuation.
Recommendation:
Look for long positions on pullbacks—current price slightly extended.
Avoid chasing longs at these levels, wait for confirmation.
Monitor volume on retest of $3,325 - $3,350 for ideal entry.
Confidence Level: 8/10 for bullish continuation.
🚀 Follow me on TradingView if you respect our charts! 📈Daily charts!

ETH/USD. Technical analysis from 28.01.25 (Hold BUY!)Glad to welcome everyone!
On Monday, there was an event that truly shook the US stock market and the cryptocurrency market in particular. In brief, friends from the Celestial Empire created an AI called DeepSeek, which is an analog of chatGPT. It is cheaper to produce, with free libraries, consumes less power, runs faster than other AIs, etc.
This news mostly hit the tech sector the hardest. Indices are recovering from the correction. Cryptocurrency market is also feeling confident (Link to analysis on btc/usd pair below).
Regarding eth/usd pair. The price continues to consolidate in a descending triangle within the corrective wave 4. 3070$-2985$ is the key volume auction. This zone has more than once been the strongest support from which the rebound took place. A breakdown of this zone and updating of the local minimum will indicate the continuation of the downtrend.
For buyers, it is extremely important to break the upper boundary on aggressive volume and consolidate above $3486, which will confirm the bullish mood. I still hold my position, and I don't plan to retreat. The rats run away from the ship first. The captain is faithful to the ship till the end! The targets are the same: 3700-3800$. Good luck to all traders and don't forget about risk management.
Translated with DeepL.com (free version)

Ethereum’s Falling Wedge A Massive Breakout on the Horizon ?Ethereum (ETH/USDT) 4H Chart Analysis Falling Wedge Breakout Potential
Technical Breakdown
The 4-hour timeframe for ETH/USDT indicates a falling wedge pattern, a typically bullish structure that suggests a potential upside breakout.
Price recently hit $3,200, currently consolidating within the wedge formation.
The wedge pattern consists of lower highs and lower lows, compressing price action into a tightening range, which increases the probability of a breakout.
A breakout above the upper trendline could trigger a strong bullish move, confirming buyers stepping in.
Key Levels to Watch
Breakout Confirmation
A 4H candle close above the wedge trendline is crucial to confirm a bullish breakout.
Immediate Resistance
$3,500 This level might act as the first resistance after a breakout.
Support Zone
$2,750 - $2,700 – If price faces rejection, this zone could serve as strong support before another attempt to break higher.
Trading Strategy
Long Entry
Wait for a 4H candle close above the wedge trendline to confirm the breakout.
Stop Loss
Below $2,900 (recent swing low) to manage risk in case of a false breakout.
Targets
First Target $3,500 (psychological and technical resistance)
Second Target $3,900 (major resistance from previous price action)
Third Target $4,300+ (bullish continuation if momentum sustains)
ETH is at a critical inflection point, and a breakout above the wedge could lead to a significant bullish move. Keep an eye on price action, volume, and confirmation signals before entering any trades.

ETH/USDT 1H: Bulls Charge Toward $3420 After Breaking Key LevelsETH/USDT 1H Chart Analysis
🚀 Follow me on TradingView if you respect our charts 📈Daily charts!
Current Market Structure:
Bullish trend confirmed after breaking previous high at $3280.
RSI: Hidden Bullish Divergence at 58.80, aligning with price momentum.
Volume Confirmation: Strong buying pressure supports the breakout.
Smart Money Levels:
Support: $3180 (Previous Consolidation High - PCH).
Resistance: $3340 (Premium Zone).
Key Level: $3246 (acting as equilibrium).
Trade Setup (Confidence 8/10):
Entry Zone: $3246 - $3250.
Targets:
T1: $3340
T2: $3380
T3: $3420
Stop Loss: Below $3175 (under PCH).
Risk Score: 7/10 (favorable Risk/Reward).
Market Maker Intent:
Accumulation phase completed at lower levels.
Currently in markup phase, targeting premium zones.
Volume Profile: Indicates strong institutional demand, supporting continuation.
Recommendation:
Long positions favored in the $3246 - $3250 range.
Watch for volume confirmation above $3280 for added confidence.
Maintain tight stops below $3175 to minimize downside risk.
Confidence Level: 8/10 for bullish continuation.
🚀 Follow me on TradingView if you respect our charts 📈Daily charts!
