Ethereum price to BitcoinHere's the information about Ethereum's price relative to Bitcoin:
Price tends to rise after halving:
Historically, the price of Ethereum compared to Bitcoin (ETH/BTC) has a tendency to peak around a year after a Bitcoin halving event.
Price dips after the peak:
Following this peak, the price of ETH/BTC typically falls for several months, reaching its lowest point somewhere between 5 and 6 months after the halving.
Price holds above previous lows:
There's an interesting trend where the price of ETH/BTC seems to never fall below the lowest point it reached during the previous cycle (year-long period)
Currently, in a buying phase:
Right now, it's believed that ETH/BTC is in an accumulation phase, where the price is slowly going up in anticipation of a future rise.
Ethlong

$CKB performing Falling wedge in 4hr TF Keep eyes on it Sure, here are three key points on how to trade in a falling wedge pattern:
1. **Identify the Falling Wedge:** Look for a downward sloping trendline connecting the lower highs and a second trendline connecting the lower lows, creating a wedge shape. The price should be gradually narrowing within this pattern, indicating a potential reversal.
2. **Wait for Confirmation:*
* Wait for confirmation of a bullish reversal. This can be signaled by a breakout above the upper trendline of the falling wedge pattern, accompanied by increased volume. This breakout validates the pattern and suggests that buying pressure may be overcoming selling pressure.
3. **Set Stop Loss and Target:** Set a stop-loss order below the lower trendline to limit potential losses in case the trade fails. Determine a target price based on the height of the wedge pattern, measured from the initial high to the low within the wedge, and project that distance upward from the breakout point. This provides a potential profit target.
Remember to always manage risk and be cautious of false breakouts by waiting for confirmation signals before entering a trade.

$ENA Breakout Falling wedge in 2hr TF ** XETR:ENA Breakout Falling wedge in 2hr TF **
Trading a falling wedge breakout involves identifying a chart pattern called a falling wedge and executing trades when the price breaks out of this pattern. Here are the steps you can follow:
1. **Identify the Falling Wedge:**
- Look for a downtrend in the price movement.
- Identify converging trendlines where the upper trendline (resistance) slopes down at a steeper angle than the lower trendline (support).
- The pattern resembles a wedge pointing downwards.
2. **Confirm the Falling Wedge:**
- Confirm the pattern using other technical indicators like volume. Ideally, during the formation of a falling wedge, the trading volume should decrease.
3. **Wait for Breakout:**
- Patiently wait for a breakout to occur. Breakout refers to the point where the price moves above the upper trendline of the falling wedge.
- The breakout should ideally be accompanied by a noticeable increase in trading volume, confirming the strength of the breakout.
4. **Entry Point:**
- Enter a long (buy) position as soon as the price breaks above the upper trendline.
- Some traders prefer to wait for a confirmed close above the upper trendline to reduce the risk of false breakouts.
5. **Stop-Loss Placement:**
- Set a stop-loss order below the lower trendline or a recent swing low. This helps limit potential losses in case the breakout fails and the price moves back into the wedge.
6. **Target Price:**
- Determine a target price based on the height of the wedge. Measure the distance from the widest part of the wedge to the starting point of the wedge and project that distance upwards from the breakout point.
Remember that trading always involves risks, and it's crucial to have a well-thought-out strategy, risk management plan, and the discipline to stick to your plan.

ETH/USDT SPOT BUY ZONESETH has clear target that's it's ATH.
First green dotted bars are places to cosnider LONG position on futures with targets for recent heights or even ath.
Solid green bars are the places to set BUY orders.
The best place to buy is in high time frame double imbalance (BPR/purple zone) but it's a bit far for the price. BUT
Remember that the chart can do anything

ETH longEntered CRYPTOCAP:ETH scalp, I dont expect a new ATH, expecting a dump around halving...
#trading #ethereum

Ethereum: Next Target in FocusFor Ethereum, we have a new setup and anticipate that Wave ((i)) has completed at approximately $3,525. We now expect to see Wave ((ii)). We believe we are currently in a Wave (c) within Wave ((ii)), which should reach a retracement between 50% and 78.6%, equating to a range from $3,324 to a maximum of $3,175. Following this, we anticipate a rise to at least $4,092.

ETH/USDT 4HOUR CHART UPDATE !!Hello friends, welcome to this ETH/USDT update from Crypto Sanders.
Chart Analysis:- Hello friends, what do you think after seeing the chart? Please comment on the ETH 4-HOUR update.
Ethereum is ready to surge from here, looks like even more ALTCOINs may surge along with it
I have tried to bring the best possible results in this chart.
If you like it, hit the like button and share your charts in the comments section.
Thank you.

ETHUSD 12HETH ~ 12H 📈
#ETH Make purchases gradually within this pattern zone, with a target of at least 10%+

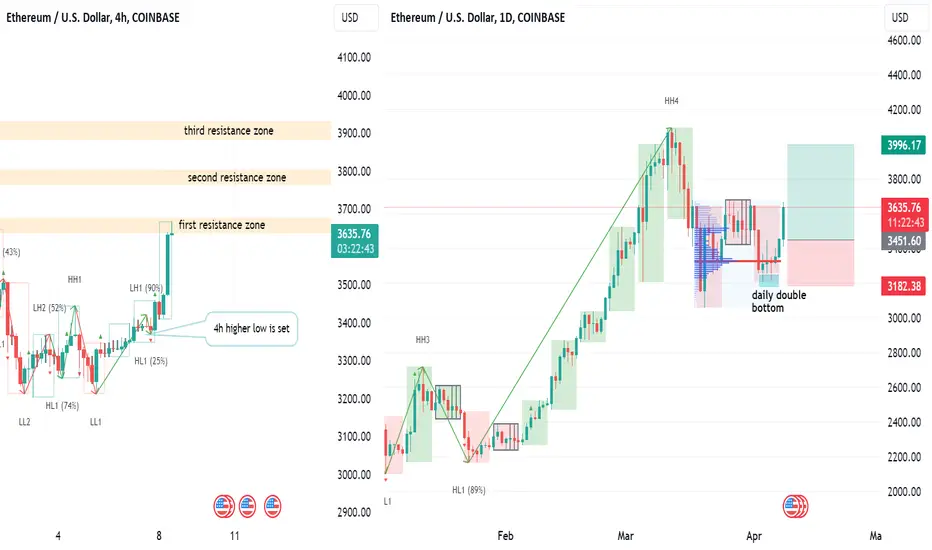
ETH is shaping weekly higher lowEthereum is trying to set weekly higher low (we're still in a weekly uptrend, setting weekly higher low is strong signal of trend continuation).
It failed one time (last week of March) but now it has better chance of accomplishing it. While it opens opportunity for a LONG play we should recognize that there was quite aggressive selling in the middle of March. Bears might be still waiting at certain levels (marked on the chart). So, entering trade at this moment doesn't provide good P/L ratio. It would be better to wait for some sort of retest (e.g. lower value area, near current week low) to enter. Consider partial profit taking at resistance zones.
Example of the trade is shown on the chart.
Disclaimer
I don't give trading or investing advice, just sharing my thoughts.
$ETH-Long IdeaEthereum broke through the swing high. Expecting a follow through in the price. Will be looking to take longs/buy at the marked bullish zones. A break below the swing low would invalidate the trade.

ETH: buy in liquidity zone📊Analysis by AhmadArz:
🔍Entry: 3500
🛑Stop Loss: 3325
🎯Take Profit: 3659-3885-3975
🔗"Uncover new opportunities in the world of cryptocurrencies with AhmadArz.
💡Join us on TradingView and expand your investment knowledge with our five years of experience in financial markets."
🚀Please boost and💬 comment to share your thoughts with us!

ETHUDSDT The Last HypeI say go from here. Looking at the lows, they look like the lows after BTC's first fall from the 64k peak. While everyone is waiting for the 62-63s, I say BTC will leave them behind.

Ethereum Skyrockets: Next Stop $5,400?Ethereum indicates that we are now approaching the completion of Wave 3, which is expected to be between $3,274 and $5,400. There is potential for an increase in the coming days that could drive prices significantly higher. However, the 161% extension level within Wave 3 is seen as very important and significant, and the resistance line at $3,581 could become a major hurdle. Accordingly, preparations for a retreat to Wave 4 are being made, based on the subordinate wave structure, which is expected to be between 38.2% and 61.8% and would place it between $2,600 and $2,200.
Nevertheless, there is still considerable potential for an upward movement to complete the overarching Wave 3, which is likely to coincide with the previous peak of Wave 5 at $2,400, representing an almost 72% increase. Such a retreat is considered crucial at this stage of the market, as it provides an opportunity for a subsequent rise and the possibility to "flush out cheap money" from the market, thus setting the stage for healthier market dynamics in the future.

Ethereum: Let's GoWe are filled on Ethereum. We expect this wave 4 either to end here or secondarly it could be the first leg of the wave 4 correction, the wave (a). Either way we expect Ethereum to rise in the coming days to either complete the wave 5 or wave (b). We will update you accordingly on the developments of Ethereum.

ETH Waiting for a breakEthereum is preparing a new pump. I am waiting a break above the yellow trendline before taking any action. I would like to see a little accumulation with a range above the trendline before entering in a long trade. My targets would be the resistance area at $3.600 first and $3.900 next

ETHUSD - Strong Trend LineThis is the 4Hr chart for ETHUSD showing price settling above a dominant trend line
I think this trend line will act as support for price and allow further continuation for the bulls
Very bullish on ETHUSD

ETH/USD Analysis (7th April 2024)
ETHUSD Analysis
On the 4 hour timeframe, price created a retracement after creating the all time highs at 4091.
After retracing, price action created a bullish CHOCH with a body candle close at 3389.10. This indicates bullish continuation is possible after some retest of the bullish orderblock.
The most recent price action retested the orderblock and has created another bullish Change of character with a wick candle closure above the level 3388.86. Ideally i want to see price break above 3439.81 with a body candle close to look for longs.
Else, should price go bearish, I want to see 3216.44 get broken below with a Body candle close, looking for a break and retest to continue shorting.

ETH/USDT 4HOUR CHART UPDATE !!Hello friends, welcome to this ETH/USDT update from Crypto Sanders.
Chart Analysis:- Hello friends, what do you think after seeing the chart? Please comment on the ETH 4-HOUR update.
Looking at the chart of Ethereum, it seems that there can be a bounce from here and along with this, other ALTCOIN will also bounce.
I have tried to bring the best possible results in this chart.
If you like it, hit the like button and share your charts in the comments section.
Thank you.

Ethereum Eyes Rebound After Finding Support at $3,200In a positive sign for Ethereum bulls, the price appears to have found support at $3,200 on a daily timeframe chart. If overall market conditions improve, ETH could bounce back to resistance at $3,640 . In a bullish scenario, the price could even reach $4,000 again.

ETH/USDT 4HOUR UPDATE BY CRYPTOSANDERS !!Hello friends, welcome to this ETH/USDT update from Crypto Sanders.
Chart Analysis:- Hello friends, what do you think after seeing the chart? Please comment on the ETH 4-HOUR update.
Looking at the 4-hour chart, the recent market consolidation seems clearer. The price created a rising wedge and broke it to the downside, which is a classical bearish continuation pattern.
While ETH is approaching the 3,000 support level, the RSI is dropping below the 30% mark, which indicates ETH is oversold in this timeframe. Therefore, it might only be a matter of time before the price rebounds higher, probably from the 3,000 support zone.
I have tried to bring the best possible results in this chart.
If you like it, hit the like button and share your charts in the comments section.
Thank you.

ETH $20k Bull Run Price ForecastA few members have asked me about my prediction for ETH in the bull run. I want to start by saying I don’t like to make these predictions because a lot of things can change over time, such as the ETH ETF gets approved or ETH could experience a string of bad events. But based on TA, there is a red resistance target to consider for this upcoming bull run that gives a forecast around $20k by Sept 2025, which is when I think the crypto markets could peak. I think ETH could have several touches at this red resistance line throughout the bull run, and I think this will be a key resistance target to consider over the next few months.

ETHUSDT ABCD PatternETHUSD taking good support and moving towards point D of ABCD pattern to complete pattern.

ETH: BEGINNER FRIENDLY ✅ Methods for Predicting Ahead For those who have been following me here for the past three years, you'll know that I usually never miss an opportunity at a April Fool's prank. However, today's post is NOT one of them. Instead, I'm going to take a turn and do a post that may be of real value to many investors and speculators at this point in the market cycle.
We'll specifically use ETH for this example but these methods can be used across ALL MARKETS.
Understanding the crypto/stock/forex markets can feel like stepping into a vast ocean of numbers, trends, and predictions. As an investor, you might wonder which pricing information is truly crucial: is it the current price or the future selling price? Interestingly, many investors look beyond these immediate numbers and delve into historical pricing data to guide their decisions. But does recent pricing history actually provide reliable insight into future market movements?
Let's explore four perspectives on this topic and dive into the academic research supporting each viewpoint.
❕1. Momentum: Riding the Wave
Picture yourself on a surfboard catching a wave. Momentum in the stock market is somewhat similar - it's about riding the wave of market trends without fighting against them. Think of it as the market's way of saying, "Go with the flow!" Behavioral finance tells us that investors tend to flock towards rising stocks out of fear of missing out or driven by greed.
Academic studies, like the one by Narasimhan Jegadeesh and Sheridan Titman in 1993, suggest that stocks which have performed well in recent months are likely to continue outperforming in the short term. However, this momentum effect seems to reverse over longer periods, hinting at something called mean reversion.
❕2. Mean Reversion: Finding Balance
Experienced investors often preach the gospel of mean reversion - the idea that over time, markets tend to return to an average value. This phenomenon isn't limited to stocks; it can be observed in various economic indicators like GDP growth or interest rates. While some studies support mean reversion in certain datasets, it's not a universal truth. It might take years, even decades, for these subtle shifts to become apparent.
❕3. Wyckoff Method : Planning WAY ahead
The Wyckoff Method is a technical analysis approach to trading in financial markets, particularly stocks. Developed by Richard D. Wyckoff in the early 20th century, it focuses on understanding the intentions of large institutional players, such as smart money, through the analysis of price and volume.
The method emphasizes the principles of supply and demand dynamics, as well as market sentiment, to identify potential trends and trading opportunities. Traders using the Wyckoff Method typically study price charts, volume patterns, and market phases to make informed decisions about when to buy or sell securities. Overall, it aims to provide a framework for interpreting market activity and making more effective trading decisions.
ETH is clearly in profit release phase atm:
❕4. The Search for Value: Digging for Diamonds
Value investors are like treasure hunters scouring the market for undervalued gems. But this method also accounts for knowing when the price is over- or under valued at its current level.
Valuation Metrics include:
Market Capitalization (Market Cap): Compares a crypto's total value (price x circulating supply) to similar projects. A high Market Cap relative to peers might indicate overvaluation.
Network Value to Transaction (NVT) Ratio: Divides Market Cap by daily transaction volume. A high NVT suggests potential overvaluation, while a low NVT might hint at undervaluation.
Both ETH (436 at time of writing) and BTC (417 at time of writing) have a relatively high NVT ratio, which could be an indication of overvaluation.
❕Long-Term vs. Short-Term Investing:
Investors should consider their investment goals and time horizons when formulating strategies. Long-term investing typically involves buying and holding assets for an extended period, while short-term investing focuses on capitalizing on immediate market movements. Each approach has its advantages and risks, depending on individual circumstances and preferences.
The long and short of the matter here is buying low and selling high.
Two methods for TECHNICAL PRICE PREDICTION:
1) Fibonacci
Fibonacci can be helpful to speculate future price targets by using it on a macro scale:
2) Logarithmic Analysis
Find more information on ETH LOG here:
